class: center, middle, inverse, title-slide .title[ # Tables and Geographic Data ] .author[ ### Maithreyi Gopalan ] .date[ ### Week 8 ] --- layout: true <script> feather.replace() </script> <div class="slides-footer"> <span> <a class = "footer-icon-link" href = "https://github.com/maithgopalan/c2-dataviz-2026/raw/main/static/slides/w8.pdf"> <i class = "footer-icon" data-feather="download"></i> </a> <a class = "footer-icon-link" href = "https://dataviz-win2026.netlify.app/slides/w8.html"> <i class = "footer-icon" data-feather="link"></i> </a> <a class = "footer-icon-link" href = "https://github.com/maithgopalan/c2-dataviz-2026"> <i class = "footer-icon" data-feather="github"></i> </a> </span> </div> --- # Agenda * Refresher: Flexdashboards and Quarto Blog Deployment * Tables + [{gt}](https://gt.rstudio.com/) + [{kableExtra}](https://haozhu233.github.io/kableExtra/) + [{reactable}](https://glin.github.io/reactable/index.html) * Geographic data + Vector/raster data + Producing basic maps + Geospatial ecosystem --- class: inverse-red middle # Refresher ## Flexdashboards and Quarto Blog Deployment --- # What is a Flexdashboard? * R Markdown format for building dashboard layouts — no Shiny required for static versions * Install: `install.packages("flexdashboard")` * New file: **File → New File → R Markdown → From Template → Flex Dashboard** * Knit to HTML — deploy like any other HTML file ```yaml --- title: "My Dashboard" output: flexdashboard::flex_dashboard: orientation: columns vertical_layout: fill --- ``` --- # Flexdashboard Layout Basics Columns and rows are defined with level 2 headers and dashes: ```md Column {data-width=650} ------------------------------------- ### Chart A < r code > Column {data-width=350} ------------------------------------- ### Chart B < r code > ### Chart C < r code > ``` * `###` creates a new panel — panels split space evenly within a column * `{data-width=650}` sets column width (no spaces around `=`!) --- # Rows Instead of Columns ```yaml output: flexdashboard::flex_dashboard: orientation: rows ``` ```md Row {data-height=500} ------------------------------------- ### Chart A Row {data-height=300} ------------------------------------- ### Chart B ### Chart C ``` --- # Multiple Pages ```md # Page 1 Column {data-width=650} ------------------------------------- ### Chart A # Page 2 Column ------------------------------------- ### Chart B ``` Level 1 headers (`#`) create new pages in the nav bar. --- # Tabsets ```md Column {.tabset data-width=650} ------------------------------------- ### Chart 1 < r code > ### Chart 2 < r code > ### Data Table < r code > ``` No comma between multiple column arguments: * ✅ `Column {.tabset data-width=650}` * ❌ `Column {.tabset, data-width=650}` --- # Sidebar ```md Sidebar {.sidebar} ===================================== Describe the dashboard here. Supports **markdown**, [links](http://example.com), etc. ``` Use `====` (not `----`) to keep the sidebar across multiple pages. --- # Adding Interactivity For `plotly` and `reactable` — no Shiny needed: ``` r library(plotly) p <- ggplot(mpg, aes(displ, cty)) + geom_point() + geom_smooth() ggplotly(p) ``` For full Shiny interactivity, add `runtime: shiny` to YAML and use `render*` functions. --- # Deploying a Flexdashboard Since it renders to HTML, deploy anywhere that hosts HTML: * **GitHub Pages** — push the `.html` file to your repo, enable Pages * **Netlify** — drag and drop the HTML file at [netlify.com/drop](https://app.netlify.com/drop) * **shinyapps.io** — required if using `runtime: shiny` For GitHub Pages, simplest approach: ```bash # Keep your dashboard in the root or docs/ folder # Ensure that its renamed to index.html # Enable Pages in repo Settings → Pages → /root or /docs ``` --- class: inverse-blue middle # Quarto Blog ## Quick Deployment Refresher --- # Quarto Blog: The Key Files ``` my-blog/ ├── _quarto.yml # site settings — theme, navbar, output-dir ├── index.qmd # listing page (your home page) ├── about.qmd # about/bio page ├── posts/ # one subfolder per post │ └── my-post/ │ └── index.qmd ├── styles.css # CSS overrides └── docs/ # built site — this gets pushed to GitHub ``` `output-dir: docs` in `_quarto.yml` is what makes GitHub Pages work. --- # `_quarto.yml` Essentials ```yaml project: type: website output-dir: docs website: title: "My Blog" site-url: https://USERNAME.github.io/my-blog/ navbar: right: - about.qmd - icon: github href: https://github.com/USERNAME format: html: theme: flatly css: styles.css toc: true execute: freeze: auto warning: false ``` --- # Writing a Post Create `posts/my-post/index.qmd`: ```yaml --- title: "My Post Title" author: "Maithreyi Gopalan" date: "2026-02-18" categories: [R, education policy] image: "thumbnail.png" draft: false --- ``` Write content below the `---`. Use `#|` for chunk options: ```r ``` --- # Render and Preview ```bash # Live preview with hot reload quarto preview # Build the full site to /docs quarto render ``` `freeze: auto` means posts only re-run when source changes — commit `_freeze/` to GitHub! --- # Deploying to GitHub Pages 1. Run `quarto render` — builds site into `docs/` 2. Commit everything including `docs/`: ```bash git add . git commit -m "Build site" git push ``` 3. On GitHub: **Settings → Pages → Branch: main, Folder: /docs → Save** Your site goes live at `https://USERNAME.github.io/REPO/` --- # Troubleshooting Deployment | Problem | Fix | |---|---| | Posts missing from listing | Check `draft: false` and post is in `posts/` | | Site not updating | Confirm `docs/` is committed, not in `.gitignore` | | YAML errors | Remove `#` inline comments from YAML blocks | | Push rejected | Use a PAT token, not your GitHub password | | Fonts not loading | `@import` must be first line of `styles.css` | --- class: inverse-blue middle # Tables <style type="text/css"> table { font-size: 1rem; } .rt-table { font-size: 0.9rem; } .rt-pagination { font-size: 0.9rem; } .rt-search { font-size: 0.9rem; } </style> --- class: inverse-green background-image: url(https://github.com/rstudio/gt/raw/master/man/figures/logo.svg?sanitize=TRUE) background-size: contain --- # {gt} Overview * Pipe-oriented — works naturally with `%>%` * Beautiful tables with minimal code * Spanner heads and grouping built in * Renders to HTML and PDF seamlessly -- Probably the best package for static tables. [{kableExtra}](https://haozhu233.github.io/kableExtra/) is also excellent — fewer people know `gt`, which is why we cover it here. --- # Install ``` r install.packages("gt") ``` --- # The hard part * Getting your data into the right shape for a table * Use your `pivot_*` skills ``` r library(fivethirtyeight) flying ``` ``` ## # A tibble: 1,040 × 27 ## respondent_id gender age height children_under_18 household_income education location frequency recline_frequency recline_obligation recline_rude ## <dbl> <chr> <ord> <ord> <lgl> <ord> <ord> <chr> <ord> <ord> <lgl> <ord> ## 1 3436139758 <NA> <NA> <NA> NA <NA> <NA> <NA> Once a y… <NA> NA <NA> ## 2 3434278696 Male 30-44 "6'3\"" TRUE <NA> Graduate degree Pacific Once a y… About half the t… TRUE Somewhat ## 3 3434275578 Male 30-44 "5'8\"" FALSE $100,000 - $149,999 Bachelor degree Pacific Once a y… Usually TRUE No ## 4 3434268208 Male 30-44 "5'11\"" FALSE $0 - $24,999 Bachelor degree Pacific Once a y… Always FALSE No ## 5 3434250245 Male 30-44 "5'7\"" FALSE $50,000 - $99,999 Bachelor degree Pacific Once a m… About half the t… FALSE No ## 6 3434245875 Male 30-44 "5'9\"" TRUE $25,000 - $49,999 Graduate degree East No… Once a y… Usually TRUE No ## 7 3434235351 Male 30-44 "6'2\"" TRUE <NA> Some college or… Pacific Once a m… Once in a while FALSE Somewhat ## 8 3434218031 Male 30-44 "6'0\"" TRUE $0 - $24,999 Bachelor degree New Eng… Once a y… Once in a while TRUE No ## 9 3434213681 <NA> <NA> "6'0\"" TRUE <NA> <NA> <NA> Once a y… Once in a while TRUE No ## 10 3434172894 Male 30-44 "5'6\"" FALSE $0 - $24,999 Bachelor degree Pacific Once a y… Never TRUE Very ## # ℹ 1,030 more rows ## # ℹ 15 more variables: recline_eliminate <lgl>, switch_seats_friends <ord>, switch_seats_family <ord>, wake_up_bathroom <ord>, wake_up_walk <ord>, baby <ord>, ## # unruly_child <ord>, two_arm_rests <chr>, middle_arm_rest <chr>, shade <chr>, unsold_seat <ord>, talk_stranger <ord>, get_up <ord>, electronics <lgl>, ## # smoked <lgl> ``` --- ``` r flying %>% count(gender, age, recline_frequency) ``` ``` ## # A tibble: 53 × 4 ## gender age recline_frequency n ## <chr> <ord> <ord> <int> ## 1 Female 18-29 Never 24 ## 2 Female 18-29 Once in a while 36 ## 3 Female 18-29 About half the time 10 ## 4 Female 18-29 Usually 13 ## 5 Female 18-29 Always 10 ## 6 Female 18-29 <NA> 19 ## 7 Female 30-44 Never 21 ## 8 Female 30-44 Once in a while 25 ## 9 Female 30-44 About half the time 22 ## 10 Female 30-44 Usually 22 ## # ℹ 43 more rows ``` --- ``` r smry <- flying %>% count(gender, age, recline_frequency) %>% drop_na(age, recline_frequency) %>% pivot_wider( names_from = "age", values_from = "n" ) smry ``` ``` ## # A tibble: 10 × 6 ## gender recline_frequency `18-29` `30-44` `45-60` `> 60` ## <chr> <ord> <int> <int> <int> <int> ## 1 Female Never 24 21 19 23 ## 2 Female Once in a while 36 25 30 36 ## 3 Female About half the time 10 22 18 17 ## 4 Female Usually 13 22 26 28 ## 5 Female Always 10 21 29 12 ## 6 Male Never 24 17 20 18 ## 7 Male Once in a while 19 39 40 29 ## 8 Male About half the time 11 11 16 11 ## 9 Male Usually 14 30 15 27 ## 10 Male Always 11 14 21 14 ``` --- # Turn into a table ``` r library(gt) smry %>% gt() ``` -- ## Note: these may look slightly different on slides The way they render locally is how they'll appear in a standard R Markdown or Quarto file. --- class: middle <div id="jnlomstjhw" style="padding-left:0px;padding-right:0px;padding-top:10px;padding-bottom:10px;overflow-x:auto;overflow-y:auto;width:auto;height:auto;"> <style>#jnlomstjhw table { font-family: system-ui, 'Segoe UI', Roboto, Helvetica, Arial, sans-serif, 'Apple Color Emoji', 'Segoe UI Emoji', 'Segoe UI Symbol', 'Noto Color Emoji'; -webkit-font-smoothing: antialiased; -moz-osx-font-smoothing: grayscale; } #jnlomstjhw thead, #jnlomstjhw tbody, #jnlomstjhw tfoot, #jnlomstjhw tr, #jnlomstjhw td, #jnlomstjhw th { border-style: none; } #jnlomstjhw p { margin: 0; padding: 0; } #jnlomstjhw .gt_table { display: table; border-collapse: collapse; line-height: normal; margin-left: auto; margin-right: auto; color: #333333; font-size: 16px; font-weight: normal; font-style: normal; background-color: #FFFFFF; width: auto; border-top-style: solid; border-top-width: 2px; border-top-color: #A8A8A8; border-right-style: none; border-right-width: 2px; border-right-color: #D3D3D3; border-bottom-style: solid; border-bottom-width: 2px; border-bottom-color: #A8A8A8; border-left-style: none; border-left-width: 2px; border-left-color: #D3D3D3; } #jnlomstjhw .gt_caption { padding-top: 4px; padding-bottom: 4px; } #jnlomstjhw .gt_title { color: #333333; font-size: 125%; font-weight: initial; padding-top: 4px; padding-bottom: 4px; padding-left: 5px; padding-right: 5px; border-bottom-color: #FFFFFF; border-bottom-width: 0; } #jnlomstjhw .gt_subtitle { color: #333333; font-size: 85%; font-weight: initial; padding-top: 3px; padding-bottom: 5px; padding-left: 5px; padding-right: 5px; border-top-color: #FFFFFF; border-top-width: 0; } #jnlomstjhw .gt_heading { background-color: #FFFFFF; text-align: center; border-bottom-color: #FFFFFF; border-left-style: none; border-left-width: 1px; border-left-color: #D3D3D3; border-right-style: none; border-right-width: 1px; border-right-color: #D3D3D3; } #jnlomstjhw .gt_bottom_border { border-bottom-style: solid; border-bottom-width: 2px; border-bottom-color: #D3D3D3; } #jnlomstjhw .gt_col_headings { border-top-style: solid; border-top-width: 2px; border-top-color: #D3D3D3; border-bottom-style: solid; border-bottom-width: 2px; border-bottom-color: #D3D3D3; border-left-style: none; border-left-width: 1px; border-left-color: #D3D3D3; border-right-style: none; border-right-width: 1px; border-right-color: #D3D3D3; } #jnlomstjhw .gt_col_heading { color: #333333; background-color: #FFFFFF; font-size: 100%; font-weight: normal; text-transform: inherit; border-left-style: none; border-left-width: 1px; border-left-color: #D3D3D3; border-right-style: none; border-right-width: 1px; border-right-color: #D3D3D3; vertical-align: bottom; padding-top: 5px; padding-bottom: 6px; padding-left: 5px; padding-right: 5px; overflow-x: hidden; } #jnlomstjhw .gt_column_spanner_outer { color: #333333; background-color: #FFFFFF; font-size: 100%; font-weight: normal; text-transform: inherit; padding-top: 0; padding-bottom: 0; padding-left: 4px; padding-right: 4px; } #jnlomstjhw .gt_column_spanner_outer:first-child { padding-left: 0; } #jnlomstjhw .gt_column_spanner_outer:last-child { padding-right: 0; } #jnlomstjhw .gt_column_spanner { border-bottom-style: solid; border-bottom-width: 2px; border-bottom-color: #D3D3D3; vertical-align: bottom; padding-top: 5px; padding-bottom: 5px; overflow-x: hidden; display: inline-block; width: 100%; } #jnlomstjhw .gt_spanner_row { border-bottom-style: hidden; } #jnlomstjhw .gt_group_heading { padding-top: 8px; padding-bottom: 8px; padding-left: 5px; padding-right: 5px; color: #333333; background-color: #FFFFFF; font-size: 100%; font-weight: initial; text-transform: inherit; border-top-style: solid; border-top-width: 2px; border-top-color: #D3D3D3; border-bottom-style: solid; border-bottom-width: 2px; border-bottom-color: #D3D3D3; border-left-style: none; border-left-width: 1px; border-left-color: #D3D3D3; border-right-style: none; border-right-width: 1px; border-right-color: #D3D3D3; vertical-align: middle; text-align: left; } #jnlomstjhw .gt_empty_group_heading { padding: 0.5px; color: #333333; background-color: #FFFFFF; font-size: 100%; font-weight: initial; border-top-style: solid; border-top-width: 2px; border-top-color: #D3D3D3; border-bottom-style: solid; border-bottom-width: 2px; border-bottom-color: #D3D3D3; vertical-align: middle; } #jnlomstjhw .gt_from_md > :first-child { margin-top: 0; } #jnlomstjhw .gt_from_md > :last-child { margin-bottom: 0; } #jnlomstjhw .gt_row { padding-top: 8px; padding-bottom: 8px; padding-left: 5px; padding-right: 5px; margin: 10px; border-top-style: solid; border-top-width: 1px; border-top-color: #D3D3D3; border-left-style: none; border-left-width: 1px; border-left-color: #D3D3D3; border-right-style: none; border-right-width: 1px; border-right-color: #D3D3D3; vertical-align: middle; overflow-x: hidden; } #jnlomstjhw .gt_stub { color: #333333; background-color: #FFFFFF; font-size: 100%; font-weight: initial; text-transform: inherit; border-right-style: solid; border-right-width: 2px; border-right-color: #D3D3D3; padding-left: 5px; padding-right: 5px; } #jnlomstjhw .gt_stub_row_group { color: #333333; background-color: #FFFFFF; font-size: 100%; font-weight: initial; text-transform: inherit; border-right-style: solid; border-right-width: 2px; border-right-color: #D3D3D3; padding-left: 5px; padding-right: 5px; vertical-align: top; } #jnlomstjhw .gt_row_group_first td { border-top-width: 2px; } #jnlomstjhw .gt_row_group_first th { border-top-width: 2px; } #jnlomstjhw .gt_summary_row { color: #333333; background-color: #FFFFFF; text-transform: inherit; padding-top: 8px; padding-bottom: 8px; padding-left: 5px; padding-right: 5px; } #jnlomstjhw .gt_first_summary_row { border-top-style: solid; border-top-color: #D3D3D3; } #jnlomstjhw .gt_first_summary_row.thick { border-top-width: 2px; } #jnlomstjhw .gt_last_summary_row { padding-top: 8px; padding-bottom: 8px; padding-left: 5px; padding-right: 5px; border-bottom-style: solid; border-bottom-width: 2px; border-bottom-color: #D3D3D3; } #jnlomstjhw .gt_grand_summary_row { color: #333333; background-color: #FFFFFF; text-transform: inherit; padding-top: 8px; padding-bottom: 8px; padding-left: 5px; padding-right: 5px; } #jnlomstjhw .gt_first_grand_summary_row { padding-top: 8px; padding-bottom: 8px; padding-left: 5px; padding-right: 5px; border-top-style: double; border-top-width: 6px; border-top-color: #D3D3D3; } #jnlomstjhw .gt_last_grand_summary_row_top { padding-top: 8px; padding-bottom: 8px; padding-left: 5px; padding-right: 5px; border-bottom-style: double; border-bottom-width: 6px; border-bottom-color: #D3D3D3; } #jnlomstjhw .gt_striped { background-color: rgba(128, 128, 128, 0.05); } #jnlomstjhw .gt_table_body { border-top-style: solid; border-top-width: 2px; border-top-color: #D3D3D3; border-bottom-style: solid; border-bottom-width: 2px; border-bottom-color: #D3D3D3; } #jnlomstjhw .gt_footnotes { color: #333333; background-color: #FFFFFF; border-bottom-style: none; border-bottom-width: 2px; border-bottom-color: #D3D3D3; border-left-style: none; border-left-width: 2px; border-left-color: #D3D3D3; border-right-style: none; border-right-width: 2px; border-right-color: #D3D3D3; } #jnlomstjhw .gt_footnote { margin: 0px; font-size: 90%; padding-top: 4px; padding-bottom: 4px; padding-left: 5px; padding-right: 5px; } #jnlomstjhw .gt_sourcenotes { color: #333333; background-color: #FFFFFF; border-bottom-style: none; border-bottom-width: 2px; border-bottom-color: #D3D3D3; border-left-style: none; border-left-width: 2px; border-left-color: #D3D3D3; border-right-style: none; border-right-width: 2px; border-right-color: #D3D3D3; } #jnlomstjhw .gt_sourcenote { font-size: 90%; padding-top: 4px; padding-bottom: 4px; padding-left: 5px; padding-right: 5px; } #jnlomstjhw .gt_left { text-align: left; } #jnlomstjhw .gt_center { text-align: center; } #jnlomstjhw .gt_right { text-align: right; font-variant-numeric: tabular-nums; } #jnlomstjhw .gt_font_normal { font-weight: normal; } #jnlomstjhw .gt_font_bold { font-weight: bold; } #jnlomstjhw .gt_font_italic { font-style: italic; } #jnlomstjhw .gt_super { font-size: 65%; } #jnlomstjhw .gt_footnote_marks { font-size: 75%; vertical-align: 0.4em; position: initial; } #jnlomstjhw .gt_asterisk { font-size: 100%; vertical-align: 0; } #jnlomstjhw .gt_indent_1 { text-indent: 5px; } #jnlomstjhw .gt_indent_2 { text-indent: 10px; } #jnlomstjhw .gt_indent_3 { text-indent: 15px; } #jnlomstjhw .gt_indent_4 { text-indent: 20px; } #jnlomstjhw .gt_indent_5 { text-indent: 25px; } #jnlomstjhw .katex-display { display: inline-flex !important; margin-bottom: 0.75em !important; } #jnlomstjhw div.Reactable > div.rt-table > div.rt-thead > div.rt-tr.rt-tr-group-header > div.rt-th-group:after { height: 0px !important; } </style> <table class="gt_table" data-quarto-disable-processing="false" data-quarto-bootstrap="false"> <thead> <tr class="gt_col_headings"> <th class="gt_col_heading gt_columns_bottom_border gt_left" rowspan="1" colspan="1" scope="col" id="gender">gender</th> <th class="gt_col_heading gt_columns_bottom_border gt_center" rowspan="1" colspan="1" scope="col" id="recline_frequency">recline_frequency</th> <th class="gt_col_heading gt_columns_bottom_border gt_right" rowspan="1" colspan="1" scope="col" id="a18-29">18-29</th> <th class="gt_col_heading gt_columns_bottom_border gt_right" rowspan="1" colspan="1" scope="col" id="a30-44">30-44</th> <th class="gt_col_heading gt_columns_bottom_border gt_right" rowspan="1" colspan="1" scope="col" id="a45-60">45-60</th> <th class="gt_col_heading gt_columns_bottom_border gt_right" rowspan="1" colspan="1" scope="col" id="a>-60">> 60</th> </tr> </thead> <tbody class="gt_table_body"> <tr><td headers="gender" class="gt_row gt_left">Female</td> <td headers="recline_frequency" class="gt_row gt_center">Never</td> <td headers="18-29" class="gt_row gt_right">24</td> <td headers="30-44" class="gt_row gt_right">21</td> <td headers="45-60" class="gt_row gt_right">19</td> <td headers="> 60" class="gt_row gt_right">23</td></tr> <tr><td headers="gender" class="gt_row gt_left">Female</td> <td headers="recline_frequency" class="gt_row gt_center">Once in a while</td> <td headers="18-29" class="gt_row gt_right">36</td> <td headers="30-44" class="gt_row gt_right">25</td> <td headers="45-60" class="gt_row gt_right">30</td> <td headers="> 60" class="gt_row gt_right">36</td></tr> <tr><td headers="gender" class="gt_row gt_left">Female</td> <td headers="recline_frequency" class="gt_row gt_center">About half the time</td> <td headers="18-29" class="gt_row gt_right">10</td> <td headers="30-44" class="gt_row gt_right">22</td> <td headers="45-60" class="gt_row gt_right">18</td> <td headers="> 60" class="gt_row gt_right">17</td></tr> <tr><td headers="gender" class="gt_row gt_left">Female</td> <td headers="recline_frequency" class="gt_row gt_center">Usually</td> <td headers="18-29" class="gt_row gt_right">13</td> <td headers="30-44" class="gt_row gt_right">22</td> <td headers="45-60" class="gt_row gt_right">26</td> <td headers="> 60" class="gt_row gt_right">28</td></tr> <tr><td headers="gender" class="gt_row gt_left">Female</td> <td headers="recline_frequency" class="gt_row gt_center">Always</td> <td headers="18-29" class="gt_row gt_right">10</td> <td headers="30-44" class="gt_row gt_right">21</td> <td headers="45-60" class="gt_row gt_right">29</td> <td headers="> 60" class="gt_row gt_right">12</td></tr> <tr><td headers="gender" class="gt_row gt_left">Male</td> <td headers="recline_frequency" class="gt_row gt_center">Never</td> <td headers="18-29" class="gt_row gt_right">24</td> <td headers="30-44" class="gt_row gt_right">17</td> <td headers="45-60" class="gt_row gt_right">20</td> <td headers="> 60" class="gt_row gt_right">18</td></tr> <tr><td headers="gender" class="gt_row gt_left">Male</td> <td headers="recline_frequency" class="gt_row gt_center">Once in a while</td> <td headers="18-29" class="gt_row gt_right">19</td> <td headers="30-44" class="gt_row gt_right">39</td> <td headers="45-60" class="gt_row gt_right">40</td> <td headers="> 60" class="gt_row gt_right">29</td></tr> <tr><td headers="gender" class="gt_row gt_left">Male</td> <td headers="recline_frequency" class="gt_row gt_center">About half the time</td> <td headers="18-29" class="gt_row gt_right">11</td> <td headers="30-44" class="gt_row gt_right">11</td> <td headers="45-60" class="gt_row gt_right">16</td> <td headers="> 60" class="gt_row gt_right">11</td></tr> <tr><td headers="gender" class="gt_row gt_left">Male</td> <td headers="recline_frequency" class="gt_row gt_center">Usually</td> <td headers="18-29" class="gt_row gt_right">14</td> <td headers="30-44" class="gt_row gt_right">30</td> <td headers="45-60" class="gt_row gt_right">15</td> <td headers="> 60" class="gt_row gt_right">27</td></tr> <tr><td headers="gender" class="gt_row gt_left">Male</td> <td headers="recline_frequency" class="gt_row gt_center">Always</td> <td headers="18-29" class="gt_row gt_right">11</td> <td headers="30-44" class="gt_row gt_right">14</td> <td headers="45-60" class="gt_row gt_right">21</td> <td headers="> 60" class="gt_row gt_right">14</td></tr> </tbody> </table> </div> --- # Add gender as a grouping variable ``` r smry %>% * group_by(gender) %>% gt() ``` --- class: middle <div id="lscunlcbly" style="padding-left:0px;padding-right:0px;padding-top:10px;padding-bottom:10px;overflow-x:auto;overflow-y:auto;width:auto;height:auto;"> <style>#lscunlcbly table { font-family: system-ui, 'Segoe UI', Roboto, Helvetica, Arial, sans-serif, 'Apple Color Emoji', 'Segoe UI Emoji', 'Segoe UI Symbol', 'Noto Color Emoji'; -webkit-font-smoothing: antialiased; -moz-osx-font-smoothing: grayscale; } #lscunlcbly thead, #lscunlcbly tbody, #lscunlcbly tfoot, #lscunlcbly tr, #lscunlcbly td, #lscunlcbly th { border-style: none; } #lscunlcbly p { margin: 0; padding: 0; } #lscunlcbly .gt_table { display: table; border-collapse: collapse; line-height: normal; margin-left: auto; margin-right: auto; color: #333333; font-size: 16px; font-weight: normal; font-style: normal; background-color: #FFFFFF; width: auto; border-top-style: solid; border-top-width: 2px; border-top-color: #A8A8A8; border-right-style: none; border-right-width: 2px; border-right-color: #D3D3D3; border-bottom-style: solid; border-bottom-width: 2px; border-bottom-color: #A8A8A8; border-left-style: none; border-left-width: 2px; border-left-color: #D3D3D3; } #lscunlcbly .gt_caption { padding-top: 4px; padding-bottom: 4px; } #lscunlcbly .gt_title { color: #333333; font-size: 125%; font-weight: initial; padding-top: 4px; padding-bottom: 4px; padding-left: 5px; padding-right: 5px; border-bottom-color: #FFFFFF; border-bottom-width: 0; } #lscunlcbly .gt_subtitle { color: #333333; font-size: 85%; font-weight: initial; padding-top: 3px; padding-bottom: 5px; padding-left: 5px; padding-right: 5px; border-top-color: #FFFFFF; border-top-width: 0; } #lscunlcbly .gt_heading { background-color: #FFFFFF; text-align: center; border-bottom-color: #FFFFFF; border-left-style: none; border-left-width: 1px; border-left-color: #D3D3D3; border-right-style: none; border-right-width: 1px; border-right-color: #D3D3D3; } #lscunlcbly .gt_bottom_border { border-bottom-style: solid; border-bottom-width: 2px; border-bottom-color: #D3D3D3; } #lscunlcbly .gt_col_headings { border-top-style: solid; border-top-width: 2px; border-top-color: #D3D3D3; border-bottom-style: solid; border-bottom-width: 2px; border-bottom-color: #D3D3D3; border-left-style: none; border-left-width: 1px; border-left-color: #D3D3D3; border-right-style: none; border-right-width: 1px; border-right-color: #D3D3D3; } #lscunlcbly .gt_col_heading { color: #333333; background-color: #FFFFFF; font-size: 100%; font-weight: normal; text-transform: inherit; border-left-style: none; border-left-width: 1px; border-left-color: #D3D3D3; border-right-style: none; border-right-width: 1px; border-right-color: #D3D3D3; vertical-align: bottom; padding-top: 5px; padding-bottom: 6px; padding-left: 5px; padding-right: 5px; overflow-x: hidden; } #lscunlcbly .gt_column_spanner_outer { color: #333333; background-color: #FFFFFF; font-size: 100%; font-weight: normal; text-transform: inherit; padding-top: 0; padding-bottom: 0; padding-left: 4px; padding-right: 4px; } #lscunlcbly .gt_column_spanner_outer:first-child { padding-left: 0; } #lscunlcbly .gt_column_spanner_outer:last-child { padding-right: 0; } #lscunlcbly .gt_column_spanner { border-bottom-style: solid; border-bottom-width: 2px; border-bottom-color: #D3D3D3; vertical-align: bottom; padding-top: 5px; padding-bottom: 5px; overflow-x: hidden; display: inline-block; width: 100%; } #lscunlcbly .gt_spanner_row { border-bottom-style: hidden; } #lscunlcbly .gt_group_heading { padding-top: 8px; padding-bottom: 8px; padding-left: 5px; padding-right: 5px; color: #333333; background-color: #FFFFFF; font-size: 100%; font-weight: initial; text-transform: inherit; border-top-style: solid; border-top-width: 2px; border-top-color: #D3D3D3; border-bottom-style: solid; border-bottom-width: 2px; border-bottom-color: #D3D3D3; border-left-style: none; border-left-width: 1px; border-left-color: #D3D3D3; border-right-style: none; border-right-width: 1px; border-right-color: #D3D3D3; vertical-align: middle; text-align: left; } #lscunlcbly .gt_empty_group_heading { padding: 0.5px; color: #333333; background-color: #FFFFFF; font-size: 100%; font-weight: initial; border-top-style: solid; border-top-width: 2px; border-top-color: #D3D3D3; border-bottom-style: solid; border-bottom-width: 2px; border-bottom-color: #D3D3D3; vertical-align: middle; } #lscunlcbly .gt_from_md > :first-child { margin-top: 0; } #lscunlcbly .gt_from_md > :last-child { margin-bottom: 0; } #lscunlcbly .gt_row { padding-top: 8px; padding-bottom: 8px; padding-left: 5px; padding-right: 5px; margin: 10px; border-top-style: solid; border-top-width: 1px; border-top-color: #D3D3D3; border-left-style: none; border-left-width: 1px; border-left-color: #D3D3D3; border-right-style: none; border-right-width: 1px; border-right-color: #D3D3D3; vertical-align: middle; overflow-x: hidden; } #lscunlcbly .gt_stub { color: #333333; background-color: #FFFFFF; font-size: 100%; font-weight: initial; text-transform: inherit; border-right-style: solid; border-right-width: 2px; border-right-color: #D3D3D3; padding-left: 5px; padding-right: 5px; } #lscunlcbly .gt_stub_row_group { color: #333333; background-color: #FFFFFF; font-size: 100%; font-weight: initial; text-transform: inherit; border-right-style: solid; border-right-width: 2px; border-right-color: #D3D3D3; padding-left: 5px; padding-right: 5px; vertical-align: top; } #lscunlcbly .gt_row_group_first td { border-top-width: 2px; } #lscunlcbly .gt_row_group_first th { border-top-width: 2px; } #lscunlcbly .gt_summary_row { color: #333333; background-color: #FFFFFF; text-transform: inherit; padding-top: 8px; padding-bottom: 8px; padding-left: 5px; padding-right: 5px; } #lscunlcbly .gt_first_summary_row { border-top-style: solid; border-top-color: #D3D3D3; } #lscunlcbly .gt_first_summary_row.thick { border-top-width: 2px; } #lscunlcbly .gt_last_summary_row { padding-top: 8px; padding-bottom: 8px; padding-left: 5px; padding-right: 5px; border-bottom-style: solid; border-bottom-width: 2px; border-bottom-color: #D3D3D3; } #lscunlcbly .gt_grand_summary_row { color: #333333; background-color: #FFFFFF; text-transform: inherit; padding-top: 8px; padding-bottom: 8px; padding-left: 5px; padding-right: 5px; } #lscunlcbly .gt_first_grand_summary_row { padding-top: 8px; padding-bottom: 8px; padding-left: 5px; padding-right: 5px; border-top-style: double; border-top-width: 6px; border-top-color: #D3D3D3; } #lscunlcbly .gt_last_grand_summary_row_top { padding-top: 8px; padding-bottom: 8px; padding-left: 5px; padding-right: 5px; border-bottom-style: double; border-bottom-width: 6px; border-bottom-color: #D3D3D3; } #lscunlcbly .gt_striped { background-color: rgba(128, 128, 128, 0.05); } #lscunlcbly .gt_table_body { border-top-style: solid; border-top-width: 2px; border-top-color: #D3D3D3; border-bottom-style: solid; border-bottom-width: 2px; border-bottom-color: #D3D3D3; } #lscunlcbly .gt_footnotes { color: #333333; background-color: #FFFFFF; border-bottom-style: none; border-bottom-width: 2px; border-bottom-color: #D3D3D3; border-left-style: none; border-left-width: 2px; border-left-color: #D3D3D3; border-right-style: none; border-right-width: 2px; border-right-color: #D3D3D3; } #lscunlcbly .gt_footnote { margin: 0px; font-size: 90%; padding-top: 4px; padding-bottom: 4px; padding-left: 5px; padding-right: 5px; } #lscunlcbly .gt_sourcenotes { color: #333333; background-color: #FFFFFF; border-bottom-style: none; border-bottom-width: 2px; border-bottom-color: #D3D3D3; border-left-style: none; border-left-width: 2px; border-left-color: #D3D3D3; border-right-style: none; border-right-width: 2px; border-right-color: #D3D3D3; } #lscunlcbly .gt_sourcenote { font-size: 90%; padding-top: 4px; padding-bottom: 4px; padding-left: 5px; padding-right: 5px; } #lscunlcbly .gt_left { text-align: left; } #lscunlcbly .gt_center { text-align: center; } #lscunlcbly .gt_right { text-align: right; font-variant-numeric: tabular-nums; } #lscunlcbly .gt_font_normal { font-weight: normal; } #lscunlcbly .gt_font_bold { font-weight: bold; } #lscunlcbly .gt_font_italic { font-style: italic; } #lscunlcbly .gt_super { font-size: 65%; } #lscunlcbly .gt_footnote_marks { font-size: 75%; vertical-align: 0.4em; position: initial; } #lscunlcbly .gt_asterisk { font-size: 100%; vertical-align: 0; } #lscunlcbly .gt_indent_1 { text-indent: 5px; } #lscunlcbly .gt_indent_2 { text-indent: 10px; } #lscunlcbly .gt_indent_3 { text-indent: 15px; } #lscunlcbly .gt_indent_4 { text-indent: 20px; } #lscunlcbly .gt_indent_5 { text-indent: 25px; } #lscunlcbly .katex-display { display: inline-flex !important; margin-bottom: 0.75em !important; } #lscunlcbly div.Reactable > div.rt-table > div.rt-thead > div.rt-tr.rt-tr-group-header > div.rt-th-group:after { height: 0px !important; } </style> <table class="gt_table" data-quarto-disable-processing="false" data-quarto-bootstrap="false"> <thead> <tr class="gt_col_headings"> <th class="gt_col_heading gt_columns_bottom_border gt_center" rowspan="1" colspan="1" scope="col" id="recline_frequency">recline_frequency</th> <th class="gt_col_heading gt_columns_bottom_border gt_right" rowspan="1" colspan="1" scope="col" id="a18-29">18-29</th> <th class="gt_col_heading gt_columns_bottom_border gt_right" rowspan="1" colspan="1" scope="col" id="a30-44">30-44</th> <th class="gt_col_heading gt_columns_bottom_border gt_right" rowspan="1" colspan="1" scope="col" id="a45-60">45-60</th> <th class="gt_col_heading gt_columns_bottom_border gt_right" rowspan="1" colspan="1" scope="col" id="a>-60">> 60</th> </tr> </thead> <tbody class="gt_table_body"> <tr class="gt_group_heading_row"> <th colspan="5" class="gt_group_heading" scope="colgroup" id="Female">Female</th> </tr> <tr class="gt_row_group_first"><td headers="Female recline_frequency" class="gt_row gt_center">Never</td> <td headers="Female 18-29" class="gt_row gt_right">24</td> <td headers="Female 30-44" class="gt_row gt_right">21</td> <td headers="Female 45-60" class="gt_row gt_right">19</td> <td headers="Female > 60" class="gt_row gt_right">23</td></tr> <tr><td headers="Female recline_frequency" class="gt_row gt_center">Once in a while</td> <td headers="Female 18-29" class="gt_row gt_right">36</td> <td headers="Female 30-44" class="gt_row gt_right">25</td> <td headers="Female 45-60" class="gt_row gt_right">30</td> <td headers="Female > 60" class="gt_row gt_right">36</td></tr> <tr><td headers="Female recline_frequency" class="gt_row gt_center">About half the time</td> <td headers="Female 18-29" class="gt_row gt_right">10</td> <td headers="Female 30-44" class="gt_row gt_right">22</td> <td headers="Female 45-60" class="gt_row gt_right">18</td> <td headers="Female > 60" class="gt_row gt_right">17</td></tr> <tr><td headers="Female recline_frequency" class="gt_row gt_center">Usually</td> <td headers="Female 18-29" class="gt_row gt_right">13</td> <td headers="Female 30-44" class="gt_row gt_right">22</td> <td headers="Female 45-60" class="gt_row gt_right">26</td> <td headers="Female > 60" class="gt_row gt_right">28</td></tr> <tr><td headers="Female recline_frequency" class="gt_row gt_center">Always</td> <td headers="Female 18-29" class="gt_row gt_right">10</td> <td headers="Female 30-44" class="gt_row gt_right">21</td> <td headers="Female 45-60" class="gt_row gt_right">29</td> <td headers="Female > 60" class="gt_row gt_right">12</td></tr> <tr class="gt_group_heading_row"> <th colspan="5" class="gt_group_heading" scope="colgroup" id="Male">Male</th> </tr> <tr class="gt_row_group_first"><td headers="Male recline_frequency" class="gt_row gt_center">Never</td> <td headers="Male 18-29" class="gt_row gt_right">24</td> <td headers="Male 30-44" class="gt_row gt_right">17</td> <td headers="Male 45-60" class="gt_row gt_right">20</td> <td headers="Male > 60" class="gt_row gt_right">18</td></tr> <tr><td headers="Male recline_frequency" class="gt_row gt_center">Once in a while</td> <td headers="Male 18-29" class="gt_row gt_right">19</td> <td headers="Male 30-44" class="gt_row gt_right">39</td> <td headers="Male 45-60" class="gt_row gt_right">40</td> <td headers="Male > 60" class="gt_row gt_right">29</td></tr> <tr><td headers="Male recline_frequency" class="gt_row gt_center">About half the time</td> <td headers="Male 18-29" class="gt_row gt_right">11</td> <td headers="Male 30-44" class="gt_row gt_right">11</td> <td headers="Male 45-60" class="gt_row gt_right">16</td> <td headers="Male > 60" class="gt_row gt_right">11</td></tr> <tr><td headers="Male recline_frequency" class="gt_row gt_center">Usually</td> <td headers="Male 18-29" class="gt_row gt_right">14</td> <td headers="Male 30-44" class="gt_row gt_right">30</td> <td headers="Male 45-60" class="gt_row gt_right">15</td> <td headers="Male > 60" class="gt_row gt_right">27</td></tr> <tr><td headers="Male recline_frequency" class="gt_row gt_center">Always</td> <td headers="Male 18-29" class="gt_row gt_right">11</td> <td headers="Male 30-44" class="gt_row gt_right">14</td> <td headers="Male 45-60" class="gt_row gt_right">21</td> <td headers="Male > 60" class="gt_row gt_right">14</td></tr> </tbody> </table> </div> --- # Add a spanner head ``` r smry %>% group_by(gender) %>% gt() %>% tab_spanner( label = "Age Range", * columns = c(`18-29`, `30-44`, `45-60`, `> 60`) ) ``` --- class: middle <div id="hwotymcylb" style="padding-left:0px;padding-right:0px;padding-top:10px;padding-bottom:10px;overflow-x:auto;overflow-y:auto;width:auto;height:auto;"> <style>#hwotymcylb table { font-family: system-ui, 'Segoe UI', Roboto, Helvetica, Arial, sans-serif, 'Apple Color Emoji', 'Segoe UI Emoji', 'Segoe UI Symbol', 'Noto Color Emoji'; -webkit-font-smoothing: antialiased; -moz-osx-font-smoothing: grayscale; } #hwotymcylb thead, #hwotymcylb tbody, #hwotymcylb tfoot, #hwotymcylb tr, #hwotymcylb td, #hwotymcylb th { border-style: none; } #hwotymcylb p { margin: 0; padding: 0; } #hwotymcylb .gt_table { display: table; border-collapse: collapse; line-height: normal; margin-left: auto; margin-right: auto; color: #333333; font-size: 16px; font-weight: normal; font-style: normal; background-color: #FFFFFF; width: auto; border-top-style: solid; border-top-width: 2px; border-top-color: #A8A8A8; border-right-style: none; border-right-width: 2px; border-right-color: #D3D3D3; border-bottom-style: solid; border-bottom-width: 2px; border-bottom-color: #A8A8A8; border-left-style: none; border-left-width: 2px; border-left-color: #D3D3D3; } #hwotymcylb .gt_caption { padding-top: 4px; padding-bottom: 4px; } #hwotymcylb .gt_title { color: #333333; font-size: 125%; font-weight: initial; padding-top: 4px; padding-bottom: 4px; padding-left: 5px; padding-right: 5px; border-bottom-color: #FFFFFF; border-bottom-width: 0; } #hwotymcylb .gt_subtitle { color: #333333; font-size: 85%; font-weight: initial; padding-top: 3px; padding-bottom: 5px; padding-left: 5px; padding-right: 5px; border-top-color: #FFFFFF; border-top-width: 0; } #hwotymcylb .gt_heading { background-color: #FFFFFF; text-align: center; border-bottom-color: #FFFFFF; border-left-style: none; border-left-width: 1px; border-left-color: #D3D3D3; border-right-style: none; border-right-width: 1px; border-right-color: #D3D3D3; } #hwotymcylb .gt_bottom_border { border-bottom-style: solid; border-bottom-width: 2px; border-bottom-color: #D3D3D3; } #hwotymcylb .gt_col_headings { border-top-style: solid; border-top-width: 2px; border-top-color: #D3D3D3; border-bottom-style: solid; border-bottom-width: 2px; border-bottom-color: #D3D3D3; border-left-style: none; border-left-width: 1px; border-left-color: #D3D3D3; border-right-style: none; border-right-width: 1px; border-right-color: #D3D3D3; } #hwotymcylb .gt_col_heading { color: #333333; background-color: #FFFFFF; font-size: 100%; font-weight: normal; text-transform: inherit; border-left-style: none; border-left-width: 1px; border-left-color: #D3D3D3; border-right-style: none; border-right-width: 1px; border-right-color: #D3D3D3; vertical-align: bottom; padding-top: 5px; padding-bottom: 6px; padding-left: 5px; padding-right: 5px; overflow-x: hidden; } #hwotymcylb .gt_column_spanner_outer { color: #333333; background-color: #FFFFFF; font-size: 100%; font-weight: normal; text-transform: inherit; padding-top: 0; padding-bottom: 0; padding-left: 4px; padding-right: 4px; } #hwotymcylb .gt_column_spanner_outer:first-child { padding-left: 0; } #hwotymcylb .gt_column_spanner_outer:last-child { padding-right: 0; } #hwotymcylb .gt_column_spanner { border-bottom-style: solid; border-bottom-width: 2px; border-bottom-color: #D3D3D3; vertical-align: bottom; padding-top: 5px; padding-bottom: 5px; overflow-x: hidden; display: inline-block; width: 100%; } #hwotymcylb .gt_spanner_row { border-bottom-style: hidden; } #hwotymcylb .gt_group_heading { padding-top: 8px; padding-bottom: 8px; padding-left: 5px; padding-right: 5px; color: #333333; background-color: #FFFFFF; font-size: 100%; font-weight: initial; text-transform: inherit; border-top-style: solid; border-top-width: 2px; border-top-color: #D3D3D3; border-bottom-style: solid; border-bottom-width: 2px; border-bottom-color: #D3D3D3; border-left-style: none; border-left-width: 1px; border-left-color: #D3D3D3; border-right-style: none; border-right-width: 1px; border-right-color: #D3D3D3; vertical-align: middle; text-align: left; } #hwotymcylb .gt_empty_group_heading { padding: 0.5px; color: #333333; background-color: #FFFFFF; font-size: 100%; font-weight: initial; border-top-style: solid; border-top-width: 2px; border-top-color: #D3D3D3; border-bottom-style: solid; border-bottom-width: 2px; border-bottom-color: #D3D3D3; vertical-align: middle; } #hwotymcylb .gt_from_md > :first-child { margin-top: 0; } #hwotymcylb .gt_from_md > :last-child { margin-bottom: 0; } #hwotymcylb .gt_row { padding-top: 8px; padding-bottom: 8px; padding-left: 5px; padding-right: 5px; margin: 10px; border-top-style: solid; border-top-width: 1px; border-top-color: #D3D3D3; border-left-style: none; border-left-width: 1px; border-left-color: #D3D3D3; border-right-style: none; border-right-width: 1px; border-right-color: #D3D3D3; vertical-align: middle; overflow-x: hidden; } #hwotymcylb .gt_stub { color: #333333; background-color: #FFFFFF; font-size: 100%; font-weight: initial; text-transform: inherit; border-right-style: solid; border-right-width: 2px; border-right-color: #D3D3D3; padding-left: 5px; padding-right: 5px; } #hwotymcylb .gt_stub_row_group { color: #333333; background-color: #FFFFFF; font-size: 100%; font-weight: initial; text-transform: inherit; border-right-style: solid; border-right-width: 2px; border-right-color: #D3D3D3; padding-left: 5px; padding-right: 5px; vertical-align: top; } #hwotymcylb .gt_row_group_first td { border-top-width: 2px; } #hwotymcylb .gt_row_group_first th { border-top-width: 2px; } #hwotymcylb .gt_summary_row { color: #333333; background-color: #FFFFFF; text-transform: inherit; padding-top: 8px; padding-bottom: 8px; padding-left: 5px; padding-right: 5px; } #hwotymcylb .gt_first_summary_row { border-top-style: solid; border-top-color: #D3D3D3; } #hwotymcylb .gt_first_summary_row.thick { border-top-width: 2px; } #hwotymcylb .gt_last_summary_row { padding-top: 8px; padding-bottom: 8px; padding-left: 5px; padding-right: 5px; border-bottom-style: solid; border-bottom-width: 2px; border-bottom-color: #D3D3D3; } #hwotymcylb .gt_grand_summary_row { color: #333333; background-color: #FFFFFF; text-transform: inherit; padding-top: 8px; padding-bottom: 8px; padding-left: 5px; padding-right: 5px; } #hwotymcylb .gt_first_grand_summary_row { padding-top: 8px; padding-bottom: 8px; padding-left: 5px; padding-right: 5px; border-top-style: double; border-top-width: 6px; border-top-color: #D3D3D3; } #hwotymcylb .gt_last_grand_summary_row_top { padding-top: 8px; padding-bottom: 8px; padding-left: 5px; padding-right: 5px; border-bottom-style: double; border-bottom-width: 6px; border-bottom-color: #D3D3D3; } #hwotymcylb .gt_striped { background-color: rgba(128, 128, 128, 0.05); } #hwotymcylb .gt_table_body { border-top-style: solid; border-top-width: 2px; border-top-color: #D3D3D3; border-bottom-style: solid; border-bottom-width: 2px; border-bottom-color: #D3D3D3; } #hwotymcylb .gt_footnotes { color: #333333; background-color: #FFFFFF; border-bottom-style: none; border-bottom-width: 2px; border-bottom-color: #D3D3D3; border-left-style: none; border-left-width: 2px; border-left-color: #D3D3D3; border-right-style: none; border-right-width: 2px; border-right-color: #D3D3D3; } #hwotymcylb .gt_footnote { margin: 0px; font-size: 90%; padding-top: 4px; padding-bottom: 4px; padding-left: 5px; padding-right: 5px; } #hwotymcylb .gt_sourcenotes { color: #333333; background-color: #FFFFFF; border-bottom-style: none; border-bottom-width: 2px; border-bottom-color: #D3D3D3; border-left-style: none; border-left-width: 2px; border-left-color: #D3D3D3; border-right-style: none; border-right-width: 2px; border-right-color: #D3D3D3; } #hwotymcylb .gt_sourcenote { font-size: 90%; padding-top: 4px; padding-bottom: 4px; padding-left: 5px; padding-right: 5px; } #hwotymcylb .gt_left { text-align: left; } #hwotymcylb .gt_center { text-align: center; } #hwotymcylb .gt_right { text-align: right; font-variant-numeric: tabular-nums; } #hwotymcylb .gt_font_normal { font-weight: normal; } #hwotymcylb .gt_font_bold { font-weight: bold; } #hwotymcylb .gt_font_italic { font-style: italic; } #hwotymcylb .gt_super { font-size: 65%; } #hwotymcylb .gt_footnote_marks { font-size: 75%; vertical-align: 0.4em; position: initial; } #hwotymcylb .gt_asterisk { font-size: 100%; vertical-align: 0; } #hwotymcylb .gt_indent_1 { text-indent: 5px; } #hwotymcylb .gt_indent_2 { text-indent: 10px; } #hwotymcylb .gt_indent_3 { text-indent: 15px; } #hwotymcylb .gt_indent_4 { text-indent: 20px; } #hwotymcylb .gt_indent_5 { text-indent: 25px; } #hwotymcylb .katex-display { display: inline-flex !important; margin-bottom: 0.75em !important; } #hwotymcylb div.Reactable > div.rt-table > div.rt-thead > div.rt-tr.rt-tr-group-header > div.rt-th-group:after { height: 0px !important; } </style> <table class="gt_table" data-quarto-disable-processing="false" data-quarto-bootstrap="false"> <thead> <tr class="gt_col_headings gt_spanner_row"> <th class="gt_col_heading gt_columns_bottom_border gt_center" rowspan="2" colspan="1" scope="col" id="recline_frequency">recline_frequency</th> <th class="gt_center gt_columns_top_border gt_column_spanner_outer" rowspan="1" colspan="4" scope="colgroup" id="Age Range"> <div class="gt_column_spanner">Age Range</div> </th> </tr> <tr class="gt_col_headings"> <th class="gt_col_heading gt_columns_bottom_border gt_right" rowspan="1" colspan="1" scope="col" id="a18-29">18-29</th> <th class="gt_col_heading gt_columns_bottom_border gt_right" rowspan="1" colspan="1" scope="col" id="a30-44">30-44</th> <th class="gt_col_heading gt_columns_bottom_border gt_right" rowspan="1" colspan="1" scope="col" id="a45-60">45-60</th> <th class="gt_col_heading gt_columns_bottom_border gt_right" rowspan="1" colspan="1" scope="col" id="a>-60">> 60</th> </tr> </thead> <tbody class="gt_table_body"> <tr class="gt_group_heading_row"> <th colspan="5" class="gt_group_heading" scope="colgroup" id="Female">Female</th> </tr> <tr class="gt_row_group_first"><td headers="Female recline_frequency" class="gt_row gt_center">Never</td> <td headers="Female 18-29" class="gt_row gt_right">24</td> <td headers="Female 30-44" class="gt_row gt_right">21</td> <td headers="Female 45-60" class="gt_row gt_right">19</td> <td headers="Female > 60" class="gt_row gt_right">23</td></tr> <tr><td headers="Female recline_frequency" class="gt_row gt_center">Once in a while</td> <td headers="Female 18-29" class="gt_row gt_right">36</td> <td headers="Female 30-44" class="gt_row gt_right">25</td> <td headers="Female 45-60" class="gt_row gt_right">30</td> <td headers="Female > 60" class="gt_row gt_right">36</td></tr> <tr><td headers="Female recline_frequency" class="gt_row gt_center">About half the time</td> <td headers="Female 18-29" class="gt_row gt_right">10</td> <td headers="Female 30-44" class="gt_row gt_right">22</td> <td headers="Female 45-60" class="gt_row gt_right">18</td> <td headers="Female > 60" class="gt_row gt_right">17</td></tr> <tr><td headers="Female recline_frequency" class="gt_row gt_center">Usually</td> <td headers="Female 18-29" class="gt_row gt_right">13</td> <td headers="Female 30-44" class="gt_row gt_right">22</td> <td headers="Female 45-60" class="gt_row gt_right">26</td> <td headers="Female > 60" class="gt_row gt_right">28</td></tr> <tr><td headers="Female recline_frequency" class="gt_row gt_center">Always</td> <td headers="Female 18-29" class="gt_row gt_right">10</td> <td headers="Female 30-44" class="gt_row gt_right">21</td> <td headers="Female 45-60" class="gt_row gt_right">29</td> <td headers="Female > 60" class="gt_row gt_right">12</td></tr> <tr class="gt_group_heading_row"> <th colspan="5" class="gt_group_heading" scope="colgroup" id="Male">Male</th> </tr> <tr class="gt_row_group_first"><td headers="Male recline_frequency" class="gt_row gt_center">Never</td> <td headers="Male 18-29" class="gt_row gt_right">24</td> <td headers="Male 30-44" class="gt_row gt_right">17</td> <td headers="Male 45-60" class="gt_row gt_right">20</td> <td headers="Male > 60" class="gt_row gt_right">18</td></tr> <tr><td headers="Male recline_frequency" class="gt_row gt_center">Once in a while</td> <td headers="Male 18-29" class="gt_row gt_right">19</td> <td headers="Male 30-44" class="gt_row gt_right">39</td> <td headers="Male 45-60" class="gt_row gt_right">40</td> <td headers="Male > 60" class="gt_row gt_right">29</td></tr> <tr><td headers="Male recline_frequency" class="gt_row gt_center">About half the time</td> <td headers="Male 18-29" class="gt_row gt_right">11</td> <td headers="Male 30-44" class="gt_row gt_right">11</td> <td headers="Male 45-60" class="gt_row gt_right">16</td> <td headers="Male > 60" class="gt_row gt_right">11</td></tr> <tr><td headers="Male recline_frequency" class="gt_row gt_center">Usually</td> <td headers="Male 18-29" class="gt_row gt_right">14</td> <td headers="Male 30-44" class="gt_row gt_right">30</td> <td headers="Male 45-60" class="gt_row gt_right">15</td> <td headers="Male > 60" class="gt_row gt_right">27</td></tr> <tr><td headers="Male recline_frequency" class="gt_row gt_center">Always</td> <td headers="Male 18-29" class="gt_row gt_right">11</td> <td headers="Male 30-44" class="gt_row gt_right">14</td> <td headers="Male 45-60" class="gt_row gt_right">21</td> <td headers="Male > 60" class="gt_row gt_right">14</td></tr> </tbody> </table> </div> --- # Change column names ``` r smry %>% group_by(gender) %>% gt() %>% tab_spanner( label = "Age Range", columns = c(`18-29`, `30-44`, `45-60`, `> 60`) ) %>% * cols_label(recline_frequency = "Recline") ``` --- class: middle <div id="erohahjddu" style="padding-left:0px;padding-right:0px;padding-top:10px;padding-bottom:10px;overflow-x:auto;overflow-y:auto;width:auto;height:auto;"> <style>#erohahjddu table { font-family: system-ui, 'Segoe UI', Roboto, Helvetica, Arial, sans-serif, 'Apple Color Emoji', 'Segoe UI Emoji', 'Segoe UI Symbol', 'Noto Color Emoji'; -webkit-font-smoothing: antialiased; -moz-osx-font-smoothing: grayscale; } #erohahjddu thead, #erohahjddu tbody, #erohahjddu tfoot, #erohahjddu tr, #erohahjddu td, #erohahjddu th { border-style: none; } #erohahjddu p { margin: 0; padding: 0; } #erohahjddu .gt_table { display: table; border-collapse: collapse; line-height: normal; margin-left: auto; margin-right: auto; color: #333333; font-size: 16px; font-weight: normal; font-style: normal; background-color: #FFFFFF; width: auto; border-top-style: solid; border-top-width: 2px; border-top-color: #A8A8A8; border-right-style: none; border-right-width: 2px; border-right-color: #D3D3D3; border-bottom-style: solid; border-bottom-width: 2px; border-bottom-color: #A8A8A8; border-left-style: none; border-left-width: 2px; border-left-color: #D3D3D3; } #erohahjddu .gt_caption { padding-top: 4px; padding-bottom: 4px; } #erohahjddu .gt_title { color: #333333; font-size: 125%; font-weight: initial; padding-top: 4px; padding-bottom: 4px; padding-left: 5px; padding-right: 5px; border-bottom-color: #FFFFFF; border-bottom-width: 0; } #erohahjddu .gt_subtitle { color: #333333; font-size: 85%; font-weight: initial; padding-top: 3px; padding-bottom: 5px; padding-left: 5px; padding-right: 5px; border-top-color: #FFFFFF; border-top-width: 0; } #erohahjddu .gt_heading { background-color: #FFFFFF; text-align: center; border-bottom-color: #FFFFFF; border-left-style: none; border-left-width: 1px; border-left-color: #D3D3D3; border-right-style: none; border-right-width: 1px; border-right-color: #D3D3D3; } #erohahjddu .gt_bottom_border { border-bottom-style: solid; border-bottom-width: 2px; border-bottom-color: #D3D3D3; } #erohahjddu .gt_col_headings { border-top-style: solid; border-top-width: 2px; border-top-color: #D3D3D3; border-bottom-style: solid; border-bottom-width: 2px; border-bottom-color: #D3D3D3; border-left-style: none; border-left-width: 1px; border-left-color: #D3D3D3; border-right-style: none; border-right-width: 1px; border-right-color: #D3D3D3; } #erohahjddu .gt_col_heading { color: #333333; background-color: #FFFFFF; font-size: 100%; font-weight: normal; text-transform: inherit; border-left-style: none; border-left-width: 1px; border-left-color: #D3D3D3; border-right-style: none; border-right-width: 1px; border-right-color: #D3D3D3; vertical-align: bottom; padding-top: 5px; padding-bottom: 6px; padding-left: 5px; padding-right: 5px; overflow-x: hidden; } #erohahjddu .gt_column_spanner_outer { color: #333333; background-color: #FFFFFF; font-size: 100%; font-weight: normal; text-transform: inherit; padding-top: 0; padding-bottom: 0; padding-left: 4px; padding-right: 4px; } #erohahjddu .gt_column_spanner_outer:first-child { padding-left: 0; } #erohahjddu .gt_column_spanner_outer:last-child { padding-right: 0; } #erohahjddu .gt_column_spanner { border-bottom-style: solid; border-bottom-width: 2px; border-bottom-color: #D3D3D3; vertical-align: bottom; padding-top: 5px; padding-bottom: 5px; overflow-x: hidden; display: inline-block; width: 100%; } #erohahjddu .gt_spanner_row { border-bottom-style: hidden; } #erohahjddu .gt_group_heading { padding-top: 8px; padding-bottom: 8px; padding-left: 5px; padding-right: 5px; color: #333333; background-color: #FFFFFF; font-size: 100%; font-weight: initial; text-transform: inherit; border-top-style: solid; border-top-width: 2px; border-top-color: #D3D3D3; border-bottom-style: solid; border-bottom-width: 2px; border-bottom-color: #D3D3D3; border-left-style: none; border-left-width: 1px; border-left-color: #D3D3D3; border-right-style: none; border-right-width: 1px; border-right-color: #D3D3D3; vertical-align: middle; text-align: left; } #erohahjddu .gt_empty_group_heading { padding: 0.5px; color: #333333; background-color: #FFFFFF; font-size: 100%; font-weight: initial; border-top-style: solid; border-top-width: 2px; border-top-color: #D3D3D3; border-bottom-style: solid; border-bottom-width: 2px; border-bottom-color: #D3D3D3; vertical-align: middle; } #erohahjddu .gt_from_md > :first-child { margin-top: 0; } #erohahjddu .gt_from_md > :last-child { margin-bottom: 0; } #erohahjddu .gt_row { padding-top: 8px; padding-bottom: 8px; padding-left: 5px; padding-right: 5px; margin: 10px; border-top-style: solid; border-top-width: 1px; border-top-color: #D3D3D3; border-left-style: none; border-left-width: 1px; border-left-color: #D3D3D3; border-right-style: none; border-right-width: 1px; border-right-color: #D3D3D3; vertical-align: middle; overflow-x: hidden; } #erohahjddu .gt_stub { color: #333333; background-color: #FFFFFF; font-size: 100%; font-weight: initial; text-transform: inherit; border-right-style: solid; border-right-width: 2px; border-right-color: #D3D3D3; padding-left: 5px; padding-right: 5px; } #erohahjddu .gt_stub_row_group { color: #333333; background-color: #FFFFFF; font-size: 100%; font-weight: initial; text-transform: inherit; border-right-style: solid; border-right-width: 2px; border-right-color: #D3D3D3; padding-left: 5px; padding-right: 5px; vertical-align: top; } #erohahjddu .gt_row_group_first td { border-top-width: 2px; } #erohahjddu .gt_row_group_first th { border-top-width: 2px; } #erohahjddu .gt_summary_row { color: #333333; background-color: #FFFFFF; text-transform: inherit; padding-top: 8px; padding-bottom: 8px; padding-left: 5px; padding-right: 5px; } #erohahjddu .gt_first_summary_row { border-top-style: solid; border-top-color: #D3D3D3; } #erohahjddu .gt_first_summary_row.thick { border-top-width: 2px; } #erohahjddu .gt_last_summary_row { padding-top: 8px; padding-bottom: 8px; padding-left: 5px; padding-right: 5px; border-bottom-style: solid; border-bottom-width: 2px; border-bottom-color: #D3D3D3; } #erohahjddu .gt_grand_summary_row { color: #333333; background-color: #FFFFFF; text-transform: inherit; padding-top: 8px; padding-bottom: 8px; padding-left: 5px; padding-right: 5px; } #erohahjddu .gt_first_grand_summary_row { padding-top: 8px; padding-bottom: 8px; padding-left: 5px; padding-right: 5px; border-top-style: double; border-top-width: 6px; border-top-color: #D3D3D3; } #erohahjddu .gt_last_grand_summary_row_top { padding-top: 8px; padding-bottom: 8px; padding-left: 5px; padding-right: 5px; border-bottom-style: double; border-bottom-width: 6px; border-bottom-color: #D3D3D3; } #erohahjddu .gt_striped { background-color: rgba(128, 128, 128, 0.05); } #erohahjddu .gt_table_body { border-top-style: solid; border-top-width: 2px; border-top-color: #D3D3D3; border-bottom-style: solid; border-bottom-width: 2px; border-bottom-color: #D3D3D3; } #erohahjddu .gt_footnotes { color: #333333; background-color: #FFFFFF; border-bottom-style: none; border-bottom-width: 2px; border-bottom-color: #D3D3D3; border-left-style: none; border-left-width: 2px; border-left-color: #D3D3D3; border-right-style: none; border-right-width: 2px; border-right-color: #D3D3D3; } #erohahjddu .gt_footnote { margin: 0px; font-size: 90%; padding-top: 4px; padding-bottom: 4px; padding-left: 5px; padding-right: 5px; } #erohahjddu .gt_sourcenotes { color: #333333; background-color: #FFFFFF; border-bottom-style: none; border-bottom-width: 2px; border-bottom-color: #D3D3D3; border-left-style: none; border-left-width: 2px; border-left-color: #D3D3D3; border-right-style: none; border-right-width: 2px; border-right-color: #D3D3D3; } #erohahjddu .gt_sourcenote { font-size: 90%; padding-top: 4px; padding-bottom: 4px; padding-left: 5px; padding-right: 5px; } #erohahjddu .gt_left { text-align: left; } #erohahjddu .gt_center { text-align: center; } #erohahjddu .gt_right { text-align: right; font-variant-numeric: tabular-nums; } #erohahjddu .gt_font_normal { font-weight: normal; } #erohahjddu .gt_font_bold { font-weight: bold; } #erohahjddu .gt_font_italic { font-style: italic; } #erohahjddu .gt_super { font-size: 65%; } #erohahjddu .gt_footnote_marks { font-size: 75%; vertical-align: 0.4em; position: initial; } #erohahjddu .gt_asterisk { font-size: 100%; vertical-align: 0; } #erohahjddu .gt_indent_1 { text-indent: 5px; } #erohahjddu .gt_indent_2 { text-indent: 10px; } #erohahjddu .gt_indent_3 { text-indent: 15px; } #erohahjddu .gt_indent_4 { text-indent: 20px; } #erohahjddu .gt_indent_5 { text-indent: 25px; } #erohahjddu .katex-display { display: inline-flex !important; margin-bottom: 0.75em !important; } #erohahjddu div.Reactable > div.rt-table > div.rt-thead > div.rt-tr.rt-tr-group-header > div.rt-th-group:after { height: 0px !important; } </style> <table class="gt_table" data-quarto-disable-processing="false" data-quarto-bootstrap="false"> <thead> <tr class="gt_col_headings gt_spanner_row"> <th class="gt_col_heading gt_columns_bottom_border gt_center" rowspan="2" colspan="1" scope="col" id="recline_frequency">Recline</th> <th class="gt_center gt_columns_top_border gt_column_spanner_outer" rowspan="1" colspan="4" scope="colgroup" id="Age Range"> <div class="gt_column_spanner">Age Range</div> </th> </tr> <tr class="gt_col_headings"> <th class="gt_col_heading gt_columns_bottom_border gt_right" rowspan="1" colspan="1" scope="col" id="a18-29">18-29</th> <th class="gt_col_heading gt_columns_bottom_border gt_right" rowspan="1" colspan="1" scope="col" id="a30-44">30-44</th> <th class="gt_col_heading gt_columns_bottom_border gt_right" rowspan="1" colspan="1" scope="col" id="a45-60">45-60</th> <th class="gt_col_heading gt_columns_bottom_border gt_right" rowspan="1" colspan="1" scope="col" id="a>-60">> 60</th> </tr> </thead> <tbody class="gt_table_body"> <tr class="gt_group_heading_row"> <th colspan="5" class="gt_group_heading" scope="colgroup" id="Female">Female</th> </tr> <tr class="gt_row_group_first"><td headers="Female recline_frequency" class="gt_row gt_center">Never</td> <td headers="Female 18-29" class="gt_row gt_right">24</td> <td headers="Female 30-44" class="gt_row gt_right">21</td> <td headers="Female 45-60" class="gt_row gt_right">19</td> <td headers="Female > 60" class="gt_row gt_right">23</td></tr> <tr><td headers="Female recline_frequency" class="gt_row gt_center">Once in a while</td> <td headers="Female 18-29" class="gt_row gt_right">36</td> <td headers="Female 30-44" class="gt_row gt_right">25</td> <td headers="Female 45-60" class="gt_row gt_right">30</td> <td headers="Female > 60" class="gt_row gt_right">36</td></tr> <tr><td headers="Female recline_frequency" class="gt_row gt_center">About half the time</td> <td headers="Female 18-29" class="gt_row gt_right">10</td> <td headers="Female 30-44" class="gt_row gt_right">22</td> <td headers="Female 45-60" class="gt_row gt_right">18</td> <td headers="Female > 60" class="gt_row gt_right">17</td></tr> <tr><td headers="Female recline_frequency" class="gt_row gt_center">Usually</td> <td headers="Female 18-29" class="gt_row gt_right">13</td> <td headers="Female 30-44" class="gt_row gt_right">22</td> <td headers="Female 45-60" class="gt_row gt_right">26</td> <td headers="Female > 60" class="gt_row gt_right">28</td></tr> <tr><td headers="Female recline_frequency" class="gt_row gt_center">Always</td> <td headers="Female 18-29" class="gt_row gt_right">10</td> <td headers="Female 30-44" class="gt_row gt_right">21</td> <td headers="Female 45-60" class="gt_row gt_right">29</td> <td headers="Female > 60" class="gt_row gt_right">12</td></tr> <tr class="gt_group_heading_row"> <th colspan="5" class="gt_group_heading" scope="colgroup" id="Male">Male</th> </tr> <tr class="gt_row_group_first"><td headers="Male recline_frequency" class="gt_row gt_center">Never</td> <td headers="Male 18-29" class="gt_row gt_right">24</td> <td headers="Male 30-44" class="gt_row gt_right">17</td> <td headers="Male 45-60" class="gt_row gt_right">20</td> <td headers="Male > 60" class="gt_row gt_right">18</td></tr> <tr><td headers="Male recline_frequency" class="gt_row gt_center">Once in a while</td> <td headers="Male 18-29" class="gt_row gt_right">19</td> <td headers="Male 30-44" class="gt_row gt_right">39</td> <td headers="Male 45-60" class="gt_row gt_right">40</td> <td headers="Male > 60" class="gt_row gt_right">29</td></tr> <tr><td headers="Male recline_frequency" class="gt_row gt_center">About half the time</td> <td headers="Male 18-29" class="gt_row gt_right">11</td> <td headers="Male 30-44" class="gt_row gt_right">11</td> <td headers="Male 45-60" class="gt_row gt_right">16</td> <td headers="Male > 60" class="gt_row gt_right">11</td></tr> <tr><td headers="Male recline_frequency" class="gt_row gt_center">Usually</td> <td headers="Male 18-29" class="gt_row gt_right">14</td> <td headers="Male 30-44" class="gt_row gt_right">30</td> <td headers="Male 45-60" class="gt_row gt_right">15</td> <td headers="Male > 60" class="gt_row gt_right">27</td></tr> <tr><td headers="Male recline_frequency" class="gt_row gt_center">Always</td> <td headers="Male 18-29" class="gt_row gt_right">11</td> <td headers="Male 30-44" class="gt_row gt_right">14</td> <td headers="Male 45-60" class="gt_row gt_right">21</td> <td headers="Male > 60" class="gt_row gt_right">14</td></tr> </tbody> </table> </div> --- # Align columns ``` r smry %>% group_by(gender) %>% gt() %>% tab_spanner( label = "Age Range", columns = c(`18-29`, `30-44`, `45-60`, `> 60`) ) %>% cols_label(recline_frequency = "Recline") %>% * cols_align(align = "left", * columns = recline_frequency) ``` --- class: middle <div id="iqkookyata" style="padding-left:0px;padding-right:0px;padding-top:10px;padding-bottom:10px;overflow-x:auto;overflow-y:auto;width:auto;height:auto;"> <style>#iqkookyata table { font-family: system-ui, 'Segoe UI', Roboto, Helvetica, Arial, sans-serif, 'Apple Color Emoji', 'Segoe UI Emoji', 'Segoe UI Symbol', 'Noto Color Emoji'; -webkit-font-smoothing: antialiased; -moz-osx-font-smoothing: grayscale; } #iqkookyata thead, #iqkookyata tbody, #iqkookyata tfoot, #iqkookyata tr, #iqkookyata td, #iqkookyata th { border-style: none; } #iqkookyata p { margin: 0; padding: 0; } #iqkookyata .gt_table { display: table; border-collapse: collapse; line-height: normal; margin-left: auto; margin-right: auto; color: #333333; font-size: 16px; font-weight: normal; font-style: normal; background-color: #FFFFFF; width: auto; border-top-style: solid; border-top-width: 2px; border-top-color: #A8A8A8; border-right-style: none; border-right-width: 2px; border-right-color: #D3D3D3; border-bottom-style: solid; border-bottom-width: 2px; border-bottom-color: #A8A8A8; border-left-style: none; border-left-width: 2px; border-left-color: #D3D3D3; } #iqkookyata .gt_caption { padding-top: 4px; padding-bottom: 4px; } #iqkookyata .gt_title { color: #333333; font-size: 125%; font-weight: initial; padding-top: 4px; padding-bottom: 4px; padding-left: 5px; padding-right: 5px; border-bottom-color: #FFFFFF; border-bottom-width: 0; } #iqkookyata .gt_subtitle { color: #333333; font-size: 85%; font-weight: initial; padding-top: 3px; padding-bottom: 5px; padding-left: 5px; padding-right: 5px; border-top-color: #FFFFFF; border-top-width: 0; } #iqkookyata .gt_heading { background-color: #FFFFFF; text-align: center; border-bottom-color: #FFFFFF; border-left-style: none; border-left-width: 1px; border-left-color: #D3D3D3; border-right-style: none; border-right-width: 1px; border-right-color: #D3D3D3; } #iqkookyata .gt_bottom_border { border-bottom-style: solid; border-bottom-width: 2px; border-bottom-color: #D3D3D3; } #iqkookyata .gt_col_headings { border-top-style: solid; border-top-width: 2px; border-top-color: #D3D3D3; border-bottom-style: solid; border-bottom-width: 2px; border-bottom-color: #D3D3D3; border-left-style: none; border-left-width: 1px; border-left-color: #D3D3D3; border-right-style: none; border-right-width: 1px; border-right-color: #D3D3D3; } #iqkookyata .gt_col_heading { color: #333333; background-color: #FFFFFF; font-size: 100%; font-weight: normal; text-transform: inherit; border-left-style: none; border-left-width: 1px; border-left-color: #D3D3D3; border-right-style: none; border-right-width: 1px; border-right-color: #D3D3D3; vertical-align: bottom; padding-top: 5px; padding-bottom: 6px; padding-left: 5px; padding-right: 5px; overflow-x: hidden; } #iqkookyata .gt_column_spanner_outer { color: #333333; background-color: #FFFFFF; font-size: 100%; font-weight: normal; text-transform: inherit; padding-top: 0; padding-bottom: 0; padding-left: 4px; padding-right: 4px; } #iqkookyata .gt_column_spanner_outer:first-child { padding-left: 0; } #iqkookyata .gt_column_spanner_outer:last-child { padding-right: 0; } #iqkookyata .gt_column_spanner { border-bottom-style: solid; border-bottom-width: 2px; border-bottom-color: #D3D3D3; vertical-align: bottom; padding-top: 5px; padding-bottom: 5px; overflow-x: hidden; display: inline-block; width: 100%; } #iqkookyata .gt_spanner_row { border-bottom-style: hidden; } #iqkookyata .gt_group_heading { padding-top: 8px; padding-bottom: 8px; padding-left: 5px; padding-right: 5px; color: #333333; background-color: #FFFFFF; font-size: 100%; font-weight: initial; text-transform: inherit; border-top-style: solid; border-top-width: 2px; border-top-color: #D3D3D3; border-bottom-style: solid; border-bottom-width: 2px; border-bottom-color: #D3D3D3; border-left-style: none; border-left-width: 1px; border-left-color: #D3D3D3; border-right-style: none; border-right-width: 1px; border-right-color: #D3D3D3; vertical-align: middle; text-align: left; } #iqkookyata .gt_empty_group_heading { padding: 0.5px; color: #333333; background-color: #FFFFFF; font-size: 100%; font-weight: initial; border-top-style: solid; border-top-width: 2px; border-top-color: #D3D3D3; border-bottom-style: solid; border-bottom-width: 2px; border-bottom-color: #D3D3D3; vertical-align: middle; } #iqkookyata .gt_from_md > :first-child { margin-top: 0; } #iqkookyata .gt_from_md > :last-child { margin-bottom: 0; } #iqkookyata .gt_row { padding-top: 8px; padding-bottom: 8px; padding-left: 5px; padding-right: 5px; margin: 10px; border-top-style: solid; border-top-width: 1px; border-top-color: #D3D3D3; border-left-style: none; border-left-width: 1px; border-left-color: #D3D3D3; border-right-style: none; border-right-width: 1px; border-right-color: #D3D3D3; vertical-align: middle; overflow-x: hidden; } #iqkookyata .gt_stub { color: #333333; background-color: #FFFFFF; font-size: 100%; font-weight: initial; text-transform: inherit; border-right-style: solid; border-right-width: 2px; border-right-color: #D3D3D3; padding-left: 5px; padding-right: 5px; } #iqkookyata .gt_stub_row_group { color: #333333; background-color: #FFFFFF; font-size: 100%; font-weight: initial; text-transform: inherit; border-right-style: solid; border-right-width: 2px; border-right-color: #D3D3D3; padding-left: 5px; padding-right: 5px; vertical-align: top; } #iqkookyata .gt_row_group_first td { border-top-width: 2px; } #iqkookyata .gt_row_group_first th { border-top-width: 2px; } #iqkookyata .gt_summary_row { color: #333333; background-color: #FFFFFF; text-transform: inherit; padding-top: 8px; padding-bottom: 8px; padding-left: 5px; padding-right: 5px; } #iqkookyata .gt_first_summary_row { border-top-style: solid; border-top-color: #D3D3D3; } #iqkookyata .gt_first_summary_row.thick { border-top-width: 2px; } #iqkookyata .gt_last_summary_row { padding-top: 8px; padding-bottom: 8px; padding-left: 5px; padding-right: 5px; border-bottom-style: solid; border-bottom-width: 2px; border-bottom-color: #D3D3D3; } #iqkookyata .gt_grand_summary_row { color: #333333; background-color: #FFFFFF; text-transform: inherit; padding-top: 8px; padding-bottom: 8px; padding-left: 5px; padding-right: 5px; } #iqkookyata .gt_first_grand_summary_row { padding-top: 8px; padding-bottom: 8px; padding-left: 5px; padding-right: 5px; border-top-style: double; border-top-width: 6px; border-top-color: #D3D3D3; } #iqkookyata .gt_last_grand_summary_row_top { padding-top: 8px; padding-bottom: 8px; padding-left: 5px; padding-right: 5px; border-bottom-style: double; border-bottom-width: 6px; border-bottom-color: #D3D3D3; } #iqkookyata .gt_striped { background-color: rgba(128, 128, 128, 0.05); } #iqkookyata .gt_table_body { border-top-style: solid; border-top-width: 2px; border-top-color: #D3D3D3; border-bottom-style: solid; border-bottom-width: 2px; border-bottom-color: #D3D3D3; } #iqkookyata .gt_footnotes { color: #333333; background-color: #FFFFFF; border-bottom-style: none; border-bottom-width: 2px; border-bottom-color: #D3D3D3; border-left-style: none; border-left-width: 2px; border-left-color: #D3D3D3; border-right-style: none; border-right-width: 2px; border-right-color: #D3D3D3; } #iqkookyata .gt_footnote { margin: 0px; font-size: 90%; padding-top: 4px; padding-bottom: 4px; padding-left: 5px; padding-right: 5px; } #iqkookyata .gt_sourcenotes { color: #333333; background-color: #FFFFFF; border-bottom-style: none; border-bottom-width: 2px; border-bottom-color: #D3D3D3; border-left-style: none; border-left-width: 2px; border-left-color: #D3D3D3; border-right-style: none; border-right-width: 2px; border-right-color: #D3D3D3; } #iqkookyata .gt_sourcenote { font-size: 90%; padding-top: 4px; padding-bottom: 4px; padding-left: 5px; padding-right: 5px; } #iqkookyata .gt_left { text-align: left; } #iqkookyata .gt_center { text-align: center; } #iqkookyata .gt_right { text-align: right; font-variant-numeric: tabular-nums; } #iqkookyata .gt_font_normal { font-weight: normal; } #iqkookyata .gt_font_bold { font-weight: bold; } #iqkookyata .gt_font_italic { font-style: italic; } #iqkookyata .gt_super { font-size: 65%; } #iqkookyata .gt_footnote_marks { font-size: 75%; vertical-align: 0.4em; position: initial; } #iqkookyata .gt_asterisk { font-size: 100%; vertical-align: 0; } #iqkookyata .gt_indent_1 { text-indent: 5px; } #iqkookyata .gt_indent_2 { text-indent: 10px; } #iqkookyata .gt_indent_3 { text-indent: 15px; } #iqkookyata .gt_indent_4 { text-indent: 20px; } #iqkookyata .gt_indent_5 { text-indent: 25px; } #iqkookyata .katex-display { display: inline-flex !important; margin-bottom: 0.75em !important; } #iqkookyata div.Reactable > div.rt-table > div.rt-thead > div.rt-tr.rt-tr-group-header > div.rt-th-group:after { height: 0px !important; } </style> <table class="gt_table" data-quarto-disable-processing="false" data-quarto-bootstrap="false"> <thead> <tr class="gt_col_headings gt_spanner_row"> <th class="gt_col_heading gt_columns_bottom_border gt_left" rowspan="2" colspan="1" scope="col" id="recline_frequency">Recline</th> <th class="gt_center gt_columns_top_border gt_column_spanner_outer" rowspan="1" colspan="4" scope="colgroup" id="Age Range"> <div class="gt_column_spanner">Age Range</div> </th> </tr> <tr class="gt_col_headings"> <th class="gt_col_heading gt_columns_bottom_border gt_right" rowspan="1" colspan="1" scope="col" id="a18-29">18-29</th> <th class="gt_col_heading gt_columns_bottom_border gt_right" rowspan="1" colspan="1" scope="col" id="a30-44">30-44</th> <th class="gt_col_heading gt_columns_bottom_border gt_right" rowspan="1" colspan="1" scope="col" id="a45-60">45-60</th> <th class="gt_col_heading gt_columns_bottom_border gt_right" rowspan="1" colspan="1" scope="col" id="a>-60">> 60</th> </tr> </thead> <tbody class="gt_table_body"> <tr class="gt_group_heading_row"> <th colspan="5" class="gt_group_heading" scope="colgroup" id="Female">Female</th> </tr> <tr class="gt_row_group_first"><td headers="Female recline_frequency" class="gt_row gt_left">Never</td> <td headers="Female 18-29" class="gt_row gt_right">24</td> <td headers="Female 30-44" class="gt_row gt_right">21</td> <td headers="Female 45-60" class="gt_row gt_right">19</td> <td headers="Female > 60" class="gt_row gt_right">23</td></tr> <tr><td headers="Female recline_frequency" class="gt_row gt_left">Once in a while</td> <td headers="Female 18-29" class="gt_row gt_right">36</td> <td headers="Female 30-44" class="gt_row gt_right">25</td> <td headers="Female 45-60" class="gt_row gt_right">30</td> <td headers="Female > 60" class="gt_row gt_right">36</td></tr> <tr><td headers="Female recline_frequency" class="gt_row gt_left">About half the time</td> <td headers="Female 18-29" class="gt_row gt_right">10</td> <td headers="Female 30-44" class="gt_row gt_right">22</td> <td headers="Female 45-60" class="gt_row gt_right">18</td> <td headers="Female > 60" class="gt_row gt_right">17</td></tr> <tr><td headers="Female recline_frequency" class="gt_row gt_left">Usually</td> <td headers="Female 18-29" class="gt_row gt_right">13</td> <td headers="Female 30-44" class="gt_row gt_right">22</td> <td headers="Female 45-60" class="gt_row gt_right">26</td> <td headers="Female > 60" class="gt_row gt_right">28</td></tr> <tr><td headers="Female recline_frequency" class="gt_row gt_left">Always</td> <td headers="Female 18-29" class="gt_row gt_right">10</td> <td headers="Female 30-44" class="gt_row gt_right">21</td> <td headers="Female 45-60" class="gt_row gt_right">29</td> <td headers="Female > 60" class="gt_row gt_right">12</td></tr> <tr class="gt_group_heading_row"> <th colspan="5" class="gt_group_heading" scope="colgroup" id="Male">Male</th> </tr> <tr class="gt_row_group_first"><td headers="Male recline_frequency" class="gt_row gt_left">Never</td> <td headers="Male 18-29" class="gt_row gt_right">24</td> <td headers="Male 30-44" class="gt_row gt_right">17</td> <td headers="Male 45-60" class="gt_row gt_right">20</td> <td headers="Male > 60" class="gt_row gt_right">18</td></tr> <tr><td headers="Male recline_frequency" class="gt_row gt_left">Once in a while</td> <td headers="Male 18-29" class="gt_row gt_right">19</td> <td headers="Male 30-44" class="gt_row gt_right">39</td> <td headers="Male 45-60" class="gt_row gt_right">40</td> <td headers="Male > 60" class="gt_row gt_right">29</td></tr> <tr><td headers="Male recline_frequency" class="gt_row gt_left">About half the time</td> <td headers="Male 18-29" class="gt_row gt_right">11</td> <td headers="Male 30-44" class="gt_row gt_right">11</td> <td headers="Male 45-60" class="gt_row gt_right">16</td> <td headers="Male > 60" class="gt_row gt_right">11</td></tr> <tr><td headers="Male recline_frequency" class="gt_row gt_left">Usually</td> <td headers="Male 18-29" class="gt_row gt_right">14</td> <td headers="Male 30-44" class="gt_row gt_right">30</td> <td headers="Male 45-60" class="gt_row gt_right">15</td> <td headers="Male > 60" class="gt_row gt_right">27</td></tr> <tr><td headers="Male recline_frequency" class="gt_row gt_left">Always</td> <td headers="Male 18-29" class="gt_row gt_right">11</td> <td headers="Male 30-44" class="gt_row gt_right">14</td> <td headers="Male 45-60" class="gt_row gt_right">21</td> <td headers="Male > 60" class="gt_row gt_right">14</td></tr> </tbody> </table> </div> --- # Add a title ``` r smry %>% group_by(gender) %>% gt() %>% tab_spanner( label = "Age Range", columns = c(`18-29`, `30-44`, `45-60`, `> 60`) ) %>% cols_label(recline_frequency = "Recline") %>% cols_align(align = "left", columns = recline_frequency) %>% * tab_header( * title = "Airline Passengers", * subtitle = "Leg space is limited, what do you do?" * ) ``` --- class: middle <div id="gwgxxbkjog" style="padding-left:0px;padding-right:0px;padding-top:10px;padding-bottom:10px;overflow-x:auto;overflow-y:auto;width:auto;height:auto;"> <style>#gwgxxbkjog table { font-family: system-ui, 'Segoe UI', Roboto, Helvetica, Arial, sans-serif, 'Apple Color Emoji', 'Segoe UI Emoji', 'Segoe UI Symbol', 'Noto Color Emoji'; -webkit-font-smoothing: antialiased; -moz-osx-font-smoothing: grayscale; } #gwgxxbkjog thead, #gwgxxbkjog tbody, #gwgxxbkjog tfoot, #gwgxxbkjog tr, #gwgxxbkjog td, #gwgxxbkjog th { border-style: none; } #gwgxxbkjog p { margin: 0; padding: 0; } #gwgxxbkjog .gt_table { display: table; border-collapse: collapse; line-height: normal; margin-left: auto; margin-right: auto; color: #333333; font-size: 16px; font-weight: normal; font-style: normal; background-color: #FFFFFF; width: auto; border-top-style: solid; border-top-width: 2px; border-top-color: #A8A8A8; border-right-style: none; border-right-width: 2px; border-right-color: #D3D3D3; border-bottom-style: solid; border-bottom-width: 2px; border-bottom-color: #A8A8A8; border-left-style: none; border-left-width: 2px; border-left-color: #D3D3D3; } #gwgxxbkjog .gt_caption { padding-top: 4px; padding-bottom: 4px; } #gwgxxbkjog .gt_title { color: #333333; font-size: 125%; font-weight: initial; padding-top: 4px; padding-bottom: 4px; padding-left: 5px; padding-right: 5px; border-bottom-color: #FFFFFF; border-bottom-width: 0; } #gwgxxbkjog .gt_subtitle { color: #333333; font-size: 85%; font-weight: initial; padding-top: 3px; padding-bottom: 5px; padding-left: 5px; padding-right: 5px; border-top-color: #FFFFFF; border-top-width: 0; } #gwgxxbkjog .gt_heading { background-color: #FFFFFF; text-align: center; border-bottom-color: #FFFFFF; border-left-style: none; border-left-width: 1px; border-left-color: #D3D3D3; border-right-style: none; border-right-width: 1px; border-right-color: #D3D3D3; } #gwgxxbkjog .gt_bottom_border { border-bottom-style: solid; border-bottom-width: 2px; border-bottom-color: #D3D3D3; } #gwgxxbkjog .gt_col_headings { border-top-style: solid; border-top-width: 2px; border-top-color: #D3D3D3; border-bottom-style: solid; border-bottom-width: 2px; border-bottom-color: #D3D3D3; border-left-style: none; border-left-width: 1px; border-left-color: #D3D3D3; border-right-style: none; border-right-width: 1px; border-right-color: #D3D3D3; } #gwgxxbkjog .gt_col_heading { color: #333333; background-color: #FFFFFF; font-size: 100%; font-weight: normal; text-transform: inherit; border-left-style: none; border-left-width: 1px; border-left-color: #D3D3D3; border-right-style: none; border-right-width: 1px; border-right-color: #D3D3D3; vertical-align: bottom; padding-top: 5px; padding-bottom: 6px; padding-left: 5px; padding-right: 5px; overflow-x: hidden; } #gwgxxbkjog .gt_column_spanner_outer { color: #333333; background-color: #FFFFFF; font-size: 100%; font-weight: normal; text-transform: inherit; padding-top: 0; padding-bottom: 0; padding-left: 4px; padding-right: 4px; } #gwgxxbkjog .gt_column_spanner_outer:first-child { padding-left: 0; } #gwgxxbkjog .gt_column_spanner_outer:last-child { padding-right: 0; } #gwgxxbkjog .gt_column_spanner { border-bottom-style: solid; border-bottom-width: 2px; border-bottom-color: #D3D3D3; vertical-align: bottom; padding-top: 5px; padding-bottom: 5px; overflow-x: hidden; display: inline-block; width: 100%; } #gwgxxbkjog .gt_spanner_row { border-bottom-style: hidden; } #gwgxxbkjog .gt_group_heading { padding-top: 8px; padding-bottom: 8px; padding-left: 5px; padding-right: 5px; color: #333333; background-color: #FFFFFF; font-size: 100%; font-weight: initial; text-transform: inherit; border-top-style: solid; border-top-width: 2px; border-top-color: #D3D3D3; border-bottom-style: solid; border-bottom-width: 2px; border-bottom-color: #D3D3D3; border-left-style: none; border-left-width: 1px; border-left-color: #D3D3D3; border-right-style: none; border-right-width: 1px; border-right-color: #D3D3D3; vertical-align: middle; text-align: left; } #gwgxxbkjog .gt_empty_group_heading { padding: 0.5px; color: #333333; background-color: #FFFFFF; font-size: 100%; font-weight: initial; border-top-style: solid; border-top-width: 2px; border-top-color: #D3D3D3; border-bottom-style: solid; border-bottom-width: 2px; border-bottom-color: #D3D3D3; vertical-align: middle; } #gwgxxbkjog .gt_from_md > :first-child { margin-top: 0; } #gwgxxbkjog .gt_from_md > :last-child { margin-bottom: 0; } #gwgxxbkjog .gt_row { padding-top: 8px; padding-bottom: 8px; padding-left: 5px; padding-right: 5px; margin: 10px; border-top-style: solid; border-top-width: 1px; border-top-color: #D3D3D3; border-left-style: none; border-left-width: 1px; border-left-color: #D3D3D3; border-right-style: none; border-right-width: 1px; border-right-color: #D3D3D3; vertical-align: middle; overflow-x: hidden; } #gwgxxbkjog .gt_stub { color: #333333; background-color: #FFFFFF; font-size: 100%; font-weight: initial; text-transform: inherit; border-right-style: solid; border-right-width: 2px; border-right-color: #D3D3D3; padding-left: 5px; padding-right: 5px; } #gwgxxbkjog .gt_stub_row_group { color: #333333; background-color: #FFFFFF; font-size: 100%; font-weight: initial; text-transform: inherit; border-right-style: solid; border-right-width: 2px; border-right-color: #D3D3D3; padding-left: 5px; padding-right: 5px; vertical-align: top; } #gwgxxbkjog .gt_row_group_first td { border-top-width: 2px; } #gwgxxbkjog .gt_row_group_first th { border-top-width: 2px; } #gwgxxbkjog .gt_summary_row { color: #333333; background-color: #FFFFFF; text-transform: inherit; padding-top: 8px; padding-bottom: 8px; padding-left: 5px; padding-right: 5px; } #gwgxxbkjog .gt_first_summary_row { border-top-style: solid; border-top-color: #D3D3D3; } #gwgxxbkjog .gt_first_summary_row.thick { border-top-width: 2px; } #gwgxxbkjog .gt_last_summary_row { padding-top: 8px; padding-bottom: 8px; padding-left: 5px; padding-right: 5px; border-bottom-style: solid; border-bottom-width: 2px; border-bottom-color: #D3D3D3; } #gwgxxbkjog .gt_grand_summary_row { color: #333333; background-color: #FFFFFF; text-transform: inherit; padding-top: 8px; padding-bottom: 8px; padding-left: 5px; padding-right: 5px; } #gwgxxbkjog .gt_first_grand_summary_row { padding-top: 8px; padding-bottom: 8px; padding-left: 5px; padding-right: 5px; border-top-style: double; border-top-width: 6px; border-top-color: #D3D3D3; } #gwgxxbkjog .gt_last_grand_summary_row_top { padding-top: 8px; padding-bottom: 8px; padding-left: 5px; padding-right: 5px; border-bottom-style: double; border-bottom-width: 6px; border-bottom-color: #D3D3D3; } #gwgxxbkjog .gt_striped { background-color: rgba(128, 128, 128, 0.05); } #gwgxxbkjog .gt_table_body { border-top-style: solid; border-top-width: 2px; border-top-color: #D3D3D3; border-bottom-style: solid; border-bottom-width: 2px; border-bottom-color: #D3D3D3; } #gwgxxbkjog .gt_footnotes { color: #333333; background-color: #FFFFFF; border-bottom-style: none; border-bottom-width: 2px; border-bottom-color: #D3D3D3; border-left-style: none; border-left-width: 2px; border-left-color: #D3D3D3; border-right-style: none; border-right-width: 2px; border-right-color: #D3D3D3; } #gwgxxbkjog .gt_footnote { margin: 0px; font-size: 90%; padding-top: 4px; padding-bottom: 4px; padding-left: 5px; padding-right: 5px; } #gwgxxbkjog .gt_sourcenotes { color: #333333; background-color: #FFFFFF; border-bottom-style: none; border-bottom-width: 2px; border-bottom-color: #D3D3D3; border-left-style: none; border-left-width: 2px; border-left-color: #D3D3D3; border-right-style: none; border-right-width: 2px; border-right-color: #D3D3D3; } #gwgxxbkjog .gt_sourcenote { font-size: 90%; padding-top: 4px; padding-bottom: 4px; padding-left: 5px; padding-right: 5px; } #gwgxxbkjog .gt_left { text-align: left; } #gwgxxbkjog .gt_center { text-align: center; } #gwgxxbkjog .gt_right { text-align: right; font-variant-numeric: tabular-nums; } #gwgxxbkjog .gt_font_normal { font-weight: normal; } #gwgxxbkjog .gt_font_bold { font-weight: bold; } #gwgxxbkjog .gt_font_italic { font-style: italic; } #gwgxxbkjog .gt_super { font-size: 65%; } #gwgxxbkjog .gt_footnote_marks { font-size: 75%; vertical-align: 0.4em; position: initial; } #gwgxxbkjog .gt_asterisk { font-size: 100%; vertical-align: 0; } #gwgxxbkjog .gt_indent_1 { text-indent: 5px; } #gwgxxbkjog .gt_indent_2 { text-indent: 10px; } #gwgxxbkjog .gt_indent_3 { text-indent: 15px; } #gwgxxbkjog .gt_indent_4 { text-indent: 20px; } #gwgxxbkjog .gt_indent_5 { text-indent: 25px; } #gwgxxbkjog .katex-display { display: inline-flex !important; margin-bottom: 0.75em !important; } #gwgxxbkjog div.Reactable > div.rt-table > div.rt-thead > div.rt-tr.rt-tr-group-header > div.rt-th-group:after { height: 0px !important; } </style> <table class="gt_table" data-quarto-disable-processing="false" data-quarto-bootstrap="false"> <thead> <tr class="gt_heading"> <td colspan="5" class="gt_heading gt_title gt_font_normal" style>Airline Passengers</td> </tr> <tr class="gt_heading"> <td colspan="5" class="gt_heading gt_subtitle gt_font_normal gt_bottom_border" style>Leg space is limited, what do you do?</td> </tr> <tr class="gt_col_headings gt_spanner_row"> <th class="gt_col_heading gt_columns_bottom_border gt_left" rowspan="2" colspan="1" scope="col" id="recline_frequency">Recline</th> <th class="gt_center gt_columns_top_border gt_column_spanner_outer" rowspan="1" colspan="4" scope="colgroup" id="Age Range"> <div class="gt_column_spanner">Age Range</div> </th> </tr> <tr class="gt_col_headings"> <th class="gt_col_heading gt_columns_bottom_border gt_right" rowspan="1" colspan="1" scope="col" id="a18-29">18-29</th> <th class="gt_col_heading gt_columns_bottom_border gt_right" rowspan="1" colspan="1" scope="col" id="a30-44">30-44</th> <th class="gt_col_heading gt_columns_bottom_border gt_right" rowspan="1" colspan="1" scope="col" id="a45-60">45-60</th> <th class="gt_col_heading gt_columns_bottom_border gt_right" rowspan="1" colspan="1" scope="col" id="a>-60">> 60</th> </tr> </thead> <tbody class="gt_table_body"> <tr class="gt_group_heading_row"> <th colspan="5" class="gt_group_heading" scope="colgroup" id="Female">Female</th> </tr> <tr class="gt_row_group_first"><td headers="Female recline_frequency" class="gt_row gt_left">Never</td> <td headers="Female 18-29" class="gt_row gt_right">24</td> <td headers="Female 30-44" class="gt_row gt_right">21</td> <td headers="Female 45-60" class="gt_row gt_right">19</td> <td headers="Female > 60" class="gt_row gt_right">23</td></tr> <tr><td headers="Female recline_frequency" class="gt_row gt_left">Once in a while</td> <td headers="Female 18-29" class="gt_row gt_right">36</td> <td headers="Female 30-44" class="gt_row gt_right">25</td> <td headers="Female 45-60" class="gt_row gt_right">30</td> <td headers="Female > 60" class="gt_row gt_right">36</td></tr> <tr><td headers="Female recline_frequency" class="gt_row gt_left">About half the time</td> <td headers="Female 18-29" class="gt_row gt_right">10</td> <td headers="Female 30-44" class="gt_row gt_right">22</td> <td headers="Female 45-60" class="gt_row gt_right">18</td> <td headers="Female > 60" class="gt_row gt_right">17</td></tr> <tr><td headers="Female recline_frequency" class="gt_row gt_left">Usually</td> <td headers="Female 18-29" class="gt_row gt_right">13</td> <td headers="Female 30-44" class="gt_row gt_right">22</td> <td headers="Female 45-60" class="gt_row gt_right">26</td> <td headers="Female > 60" class="gt_row gt_right">28</td></tr> <tr><td headers="Female recline_frequency" class="gt_row gt_left">Always</td> <td headers="Female 18-29" class="gt_row gt_right">10</td> <td headers="Female 30-44" class="gt_row gt_right">21</td> <td headers="Female 45-60" class="gt_row gt_right">29</td> <td headers="Female > 60" class="gt_row gt_right">12</td></tr> <tr class="gt_group_heading_row"> <th colspan="5" class="gt_group_heading" scope="colgroup" id="Male">Male</th> </tr> <tr class="gt_row_group_first"><td headers="Male recline_frequency" class="gt_row gt_left">Never</td> <td headers="Male 18-29" class="gt_row gt_right">24</td> <td headers="Male 30-44" class="gt_row gt_right">17</td> <td headers="Male 45-60" class="gt_row gt_right">20</td> <td headers="Male > 60" class="gt_row gt_right">18</td></tr> <tr><td headers="Male recline_frequency" class="gt_row gt_left">Once in a while</td> <td headers="Male 18-29" class="gt_row gt_right">19</td> <td headers="Male 30-44" class="gt_row gt_right">39</td> <td headers="Male 45-60" class="gt_row gt_right">40</td> <td headers="Male > 60" class="gt_row gt_right">29</td></tr> <tr><td headers="Male recline_frequency" class="gt_row gt_left">About half the time</td> <td headers="Male 18-29" class="gt_row gt_right">11</td> <td headers="Male 30-44" class="gt_row gt_right">11</td> <td headers="Male 45-60" class="gt_row gt_right">16</td> <td headers="Male > 60" class="gt_row gt_right">11</td></tr> <tr><td headers="Male recline_frequency" class="gt_row gt_left">Usually</td> <td headers="Male 18-29" class="gt_row gt_right">14</td> <td headers="Male 30-44" class="gt_row gt_right">30</td> <td headers="Male 45-60" class="gt_row gt_right">15</td> <td headers="Male > 60" class="gt_row gt_right">27</td></tr> <tr><td headers="Male recline_frequency" class="gt_row gt_left">Always</td> <td headers="Male 18-29" class="gt_row gt_right">11</td> <td headers="Male 30-44" class="gt_row gt_right">14</td> <td headers="Male 45-60" class="gt_row gt_right">21</td> <td headers="Male > 60" class="gt_row gt_right">14</td></tr> </tbody> </table> </div> --- # Format columns ``` r smry %>% * mutate(across(c(`18-29`, `30-44`, `45-60`, `> 60`), * ~.x / 100)) %>% group_by(gender) %>% gt() %>% tab_spanner( label = "Age Range", columns = c(`18-29`, `30-44`, `45-60`, `> 60`) ) %>% * fmt_percent( * columns = c(`18-29`, `30-44`, `45-60`, `> 60`), * decimals = 0 * ) %>% cols_label(recline_frequency = "Recline") %>% cols_align(align = "left", columns = recline_frequency) %>% tab_header( title = "Airline Passengers", subtitle = "Leg space is limited, what do you do?" ) ``` --- class: middle <div id="gkgfdcznzx" style="padding-left:0px;padding-right:0px;padding-top:10px;padding-bottom:10px;overflow-x:auto;overflow-y:auto;width:auto;height:auto;"> <style>#gkgfdcznzx table { font-family: system-ui, 'Segoe UI', Roboto, Helvetica, Arial, sans-serif, 'Apple Color Emoji', 'Segoe UI Emoji', 'Segoe UI Symbol', 'Noto Color Emoji'; -webkit-font-smoothing: antialiased; -moz-osx-font-smoothing: grayscale; } #gkgfdcznzx thead, #gkgfdcznzx tbody, #gkgfdcznzx tfoot, #gkgfdcznzx tr, #gkgfdcznzx td, #gkgfdcznzx th { border-style: none; } #gkgfdcznzx p { margin: 0; padding: 0; } #gkgfdcznzx .gt_table { display: table; border-collapse: collapse; line-height: normal; margin-left: auto; margin-right: auto; color: #333333; font-size: 16px; font-weight: normal; font-style: normal; background-color: #FFFFFF; width: auto; border-top-style: solid; border-top-width: 2px; border-top-color: #A8A8A8; border-right-style: none; border-right-width: 2px; border-right-color: #D3D3D3; border-bottom-style: solid; border-bottom-width: 2px; border-bottom-color: #A8A8A8; border-left-style: none; border-left-width: 2px; border-left-color: #D3D3D3; } #gkgfdcznzx .gt_caption { padding-top: 4px; padding-bottom: 4px; } #gkgfdcznzx .gt_title { color: #333333; font-size: 125%; font-weight: initial; padding-top: 4px; padding-bottom: 4px; padding-left: 5px; padding-right: 5px; border-bottom-color: #FFFFFF; border-bottom-width: 0; } #gkgfdcznzx .gt_subtitle { color: #333333; font-size: 85%; font-weight: initial; padding-top: 3px; padding-bottom: 5px; padding-left: 5px; padding-right: 5px; border-top-color: #FFFFFF; border-top-width: 0; } #gkgfdcznzx .gt_heading { background-color: #FFFFFF; text-align: center; border-bottom-color: #FFFFFF; border-left-style: none; border-left-width: 1px; border-left-color: #D3D3D3; border-right-style: none; border-right-width: 1px; border-right-color: #D3D3D3; } #gkgfdcznzx .gt_bottom_border { border-bottom-style: solid; border-bottom-width: 2px; border-bottom-color: #D3D3D3; } #gkgfdcznzx .gt_col_headings { border-top-style: solid; border-top-width: 2px; border-top-color: #D3D3D3; border-bottom-style: solid; border-bottom-width: 2px; border-bottom-color: #D3D3D3; border-left-style: none; border-left-width: 1px; border-left-color: #D3D3D3; border-right-style: none; border-right-width: 1px; border-right-color: #D3D3D3; } #gkgfdcznzx .gt_col_heading { color: #333333; background-color: #FFFFFF; font-size: 100%; font-weight: normal; text-transform: inherit; border-left-style: none; border-left-width: 1px; border-left-color: #D3D3D3; border-right-style: none; border-right-width: 1px; border-right-color: #D3D3D3; vertical-align: bottom; padding-top: 5px; padding-bottom: 6px; padding-left: 5px; padding-right: 5px; overflow-x: hidden; } #gkgfdcznzx .gt_column_spanner_outer { color: #333333; background-color: #FFFFFF; font-size: 100%; font-weight: normal; text-transform: inherit; padding-top: 0; padding-bottom: 0; padding-left: 4px; padding-right: 4px; } #gkgfdcznzx .gt_column_spanner_outer:first-child { padding-left: 0; } #gkgfdcznzx .gt_column_spanner_outer:last-child { padding-right: 0; } #gkgfdcznzx .gt_column_spanner { border-bottom-style: solid; border-bottom-width: 2px; border-bottom-color: #D3D3D3; vertical-align: bottom; padding-top: 5px; padding-bottom: 5px; overflow-x: hidden; display: inline-block; width: 100%; } #gkgfdcznzx .gt_spanner_row { border-bottom-style: hidden; } #gkgfdcznzx .gt_group_heading { padding-top: 8px; padding-bottom: 8px; padding-left: 5px; padding-right: 5px; color: #333333; background-color: #FFFFFF; font-size: 100%; font-weight: initial; text-transform: inherit; border-top-style: solid; border-top-width: 2px; border-top-color: #D3D3D3; border-bottom-style: solid; border-bottom-width: 2px; border-bottom-color: #D3D3D3; border-left-style: none; border-left-width: 1px; border-left-color: #D3D3D3; border-right-style: none; border-right-width: 1px; border-right-color: #D3D3D3; vertical-align: middle; text-align: left; } #gkgfdcznzx .gt_empty_group_heading { padding: 0.5px; color: #333333; background-color: #FFFFFF; font-size: 100%; font-weight: initial; border-top-style: solid; border-top-width: 2px; border-top-color: #D3D3D3; border-bottom-style: solid; border-bottom-width: 2px; border-bottom-color: #D3D3D3; vertical-align: middle; } #gkgfdcznzx .gt_from_md > :first-child { margin-top: 0; } #gkgfdcznzx .gt_from_md > :last-child { margin-bottom: 0; } #gkgfdcznzx .gt_row { padding-top: 8px; padding-bottom: 8px; padding-left: 5px; padding-right: 5px; margin: 10px; border-top-style: solid; border-top-width: 1px; border-top-color: #D3D3D3; border-left-style: none; border-left-width: 1px; border-left-color: #D3D3D3; border-right-style: none; border-right-width: 1px; border-right-color: #D3D3D3; vertical-align: middle; overflow-x: hidden; } #gkgfdcznzx .gt_stub { color: #333333; background-color: #FFFFFF; font-size: 100%; font-weight: initial; text-transform: inherit; border-right-style: solid; border-right-width: 2px; border-right-color: #D3D3D3; padding-left: 5px; padding-right: 5px; } #gkgfdcznzx .gt_stub_row_group { color: #333333; background-color: #FFFFFF; font-size: 100%; font-weight: initial; text-transform: inherit; border-right-style: solid; border-right-width: 2px; border-right-color: #D3D3D3; padding-left: 5px; padding-right: 5px; vertical-align: top; } #gkgfdcznzx .gt_row_group_first td { border-top-width: 2px; } #gkgfdcznzx .gt_row_group_first th { border-top-width: 2px; } #gkgfdcznzx .gt_summary_row { color: #333333; background-color: #FFFFFF; text-transform: inherit; padding-top: 8px; padding-bottom: 8px; padding-left: 5px; padding-right: 5px; } #gkgfdcznzx .gt_first_summary_row { border-top-style: solid; border-top-color: #D3D3D3; } #gkgfdcznzx .gt_first_summary_row.thick { border-top-width: 2px; } #gkgfdcznzx .gt_last_summary_row { padding-top: 8px; padding-bottom: 8px; padding-left: 5px; padding-right: 5px; border-bottom-style: solid; border-bottom-width: 2px; border-bottom-color: #D3D3D3; } #gkgfdcznzx .gt_grand_summary_row { color: #333333; background-color: #FFFFFF; text-transform: inherit; padding-top: 8px; padding-bottom: 8px; padding-left: 5px; padding-right: 5px; } #gkgfdcznzx .gt_first_grand_summary_row { padding-top: 8px; padding-bottom: 8px; padding-left: 5px; padding-right: 5px; border-top-style: double; border-top-width: 6px; border-top-color: #D3D3D3; } #gkgfdcznzx .gt_last_grand_summary_row_top { padding-top: 8px; padding-bottom: 8px; padding-left: 5px; padding-right: 5px; border-bottom-style: double; border-bottom-width: 6px; border-bottom-color: #D3D3D3; } #gkgfdcznzx .gt_striped { background-color: rgba(128, 128, 128, 0.05); } #gkgfdcznzx .gt_table_body { border-top-style: solid; border-top-width: 2px; border-top-color: #D3D3D3; border-bottom-style: solid; border-bottom-width: 2px; border-bottom-color: #D3D3D3; } #gkgfdcznzx .gt_footnotes { color: #333333; background-color: #FFFFFF; border-bottom-style: none; border-bottom-width: 2px; border-bottom-color: #D3D3D3; border-left-style: none; border-left-width: 2px; border-left-color: #D3D3D3; border-right-style: none; border-right-width: 2px; border-right-color: #D3D3D3; } #gkgfdcznzx .gt_footnote { margin: 0px; font-size: 90%; padding-top: 4px; padding-bottom: 4px; padding-left: 5px; padding-right: 5px; } #gkgfdcznzx .gt_sourcenotes { color: #333333; background-color: #FFFFFF; border-bottom-style: none; border-bottom-width: 2px; border-bottom-color: #D3D3D3; border-left-style: none; border-left-width: 2px; border-left-color: #D3D3D3; border-right-style: none; border-right-width: 2px; border-right-color: #D3D3D3; } #gkgfdcznzx .gt_sourcenote { font-size: 90%; padding-top: 4px; padding-bottom: 4px; padding-left: 5px; padding-right: 5px; } #gkgfdcznzx .gt_left { text-align: left; } #gkgfdcznzx .gt_center { text-align: center; } #gkgfdcznzx .gt_right { text-align: right; font-variant-numeric: tabular-nums; } #gkgfdcznzx .gt_font_normal { font-weight: normal; } #gkgfdcznzx .gt_font_bold { font-weight: bold; } #gkgfdcznzx .gt_font_italic { font-style: italic; } #gkgfdcznzx .gt_super { font-size: 65%; } #gkgfdcznzx .gt_footnote_marks { font-size: 75%; vertical-align: 0.4em; position: initial; } #gkgfdcznzx .gt_asterisk { font-size: 100%; vertical-align: 0; } #gkgfdcznzx .gt_indent_1 { text-indent: 5px; } #gkgfdcznzx .gt_indent_2 { text-indent: 10px; } #gkgfdcznzx .gt_indent_3 { text-indent: 15px; } #gkgfdcznzx .gt_indent_4 { text-indent: 20px; } #gkgfdcznzx .gt_indent_5 { text-indent: 25px; } #gkgfdcznzx .katex-display { display: inline-flex !important; margin-bottom: 0.75em !important; } #gkgfdcznzx div.Reactable > div.rt-table > div.rt-thead > div.rt-tr.rt-tr-group-header > div.rt-th-group:after { height: 0px !important; } </style> <table class="gt_table" data-quarto-disable-processing="false" data-quarto-bootstrap="false"> <thead> <tr class="gt_heading"> <td colspan="5" class="gt_heading gt_title gt_font_normal" style>Airline Passengers</td> </tr> <tr class="gt_heading"> <td colspan="5" class="gt_heading gt_subtitle gt_font_normal gt_bottom_border" style>Leg space is limited, what do you do?</td> </tr> <tr class="gt_col_headings gt_spanner_row"> <th class="gt_col_heading gt_columns_bottom_border gt_left" rowspan="2" colspan="1" scope="col" id="recline_frequency">Recline</th> <th class="gt_center gt_columns_top_border gt_column_spanner_outer" rowspan="1" colspan="4" scope="colgroup" id="Age Range"> <div class="gt_column_spanner">Age Range</div> </th> </tr> <tr class="gt_col_headings"> <th class="gt_col_heading gt_columns_bottom_border gt_right" rowspan="1" colspan="1" scope="col" id="a18-29">18-29</th> <th class="gt_col_heading gt_columns_bottom_border gt_right" rowspan="1" colspan="1" scope="col" id="a30-44">30-44</th> <th class="gt_col_heading gt_columns_bottom_border gt_right" rowspan="1" colspan="1" scope="col" id="a45-60">45-60</th> <th class="gt_col_heading gt_columns_bottom_border gt_right" rowspan="1" colspan="1" scope="col" id="a>-60">> 60</th> </tr> </thead> <tbody class="gt_table_body"> <tr class="gt_group_heading_row"> <th colspan="5" class="gt_group_heading" scope="colgroup" id="Female">Female</th> </tr> <tr class="gt_row_group_first"><td headers="Female recline_frequency" class="gt_row gt_left">Never</td> <td headers="Female 18-29" class="gt_row gt_right">24%</td> <td headers="Female 30-44" class="gt_row gt_right">21%</td> <td headers="Female 45-60" class="gt_row gt_right">19%</td> <td headers="Female > 60" class="gt_row gt_right">23%</td></tr> <tr><td headers="Female recline_frequency" class="gt_row gt_left">Once in a while</td> <td headers="Female 18-29" class="gt_row gt_right">36%</td> <td headers="Female 30-44" class="gt_row gt_right">25%</td> <td headers="Female 45-60" class="gt_row gt_right">30%</td> <td headers="Female > 60" class="gt_row gt_right">36%</td></tr> <tr><td headers="Female recline_frequency" class="gt_row gt_left">About half the time</td> <td headers="Female 18-29" class="gt_row gt_right">10%</td> <td headers="Female 30-44" class="gt_row gt_right">22%</td> <td headers="Female 45-60" class="gt_row gt_right">18%</td> <td headers="Female > 60" class="gt_row gt_right">17%</td></tr> <tr><td headers="Female recline_frequency" class="gt_row gt_left">Usually</td> <td headers="Female 18-29" class="gt_row gt_right">13%</td> <td headers="Female 30-44" class="gt_row gt_right">22%</td> <td headers="Female 45-60" class="gt_row gt_right">26%</td> <td headers="Female > 60" class="gt_row gt_right">28%</td></tr> <tr><td headers="Female recline_frequency" class="gt_row gt_left">Always</td> <td headers="Female 18-29" class="gt_row gt_right">10%</td> <td headers="Female 30-44" class="gt_row gt_right">21%</td> <td headers="Female 45-60" class="gt_row gt_right">29%</td> <td headers="Female > 60" class="gt_row gt_right">12%</td></tr> <tr class="gt_group_heading_row"> <th colspan="5" class="gt_group_heading" scope="colgroup" id="Male">Male</th> </tr> <tr class="gt_row_group_first"><td headers="Male recline_frequency" class="gt_row gt_left">Never</td> <td headers="Male 18-29" class="gt_row gt_right">24%</td> <td headers="Male 30-44" class="gt_row gt_right">17%</td> <td headers="Male 45-60" class="gt_row gt_right">20%</td> <td headers="Male > 60" class="gt_row gt_right">18%</td></tr> <tr><td headers="Male recline_frequency" class="gt_row gt_left">Once in a while</td> <td headers="Male 18-29" class="gt_row gt_right">19%</td> <td headers="Male 30-44" class="gt_row gt_right">39%</td> <td headers="Male 45-60" class="gt_row gt_right">40%</td> <td headers="Male > 60" class="gt_row gt_right">29%</td></tr> <tr><td headers="Male recline_frequency" class="gt_row gt_left">About half the time</td> <td headers="Male 18-29" class="gt_row gt_right">11%</td> <td headers="Male 30-44" class="gt_row gt_right">11%</td> <td headers="Male 45-60" class="gt_row gt_right">16%</td> <td headers="Male > 60" class="gt_row gt_right">11%</td></tr> <tr><td headers="Male recline_frequency" class="gt_row gt_left">Usually</td> <td headers="Male 18-29" class="gt_row gt_right">14%</td> <td headers="Male 30-44" class="gt_row gt_right">30%</td> <td headers="Male 45-60" class="gt_row gt_right">15%</td> <td headers="Male > 60" class="gt_row gt_right">27%</td></tr> <tr><td headers="Male recline_frequency" class="gt_row gt_left">Always</td> <td headers="Male 18-29" class="gt_row gt_right">11%</td> <td headers="Male 30-44" class="gt_row gt_right">14%</td> <td headers="Male 45-60" class="gt_row gt_right">21%</td> <td headers="Male > 60" class="gt_row gt_right">14%</td></tr> </tbody> </table> </div> --- # Add a source note ``` r ... %>% * tab_source_note( * source_note = md("Data from [fivethirtyeight](https://fivethirtyeight.com/features/airplane-etiquette-recline-seat/)") * ) ``` --- class: middle <div id="ltokhwwmhp" style="padding-left:0px;padding-right:0px;padding-top:10px;padding-bottom:10px;overflow-x:auto;overflow-y:auto;width:auto;height:auto;"> <style>#ltokhwwmhp table { font-family: system-ui, 'Segoe UI', Roboto, Helvetica, Arial, sans-serif, 'Apple Color Emoji', 'Segoe UI Emoji', 'Segoe UI Symbol', 'Noto Color Emoji'; -webkit-font-smoothing: antialiased; -moz-osx-font-smoothing: grayscale; } #ltokhwwmhp thead, #ltokhwwmhp tbody, #ltokhwwmhp tfoot, #ltokhwwmhp tr, #ltokhwwmhp td, #ltokhwwmhp th { border-style: none; } #ltokhwwmhp p { margin: 0; padding: 0; } #ltokhwwmhp .gt_table { display: table; border-collapse: collapse; line-height: normal; margin-left: auto; margin-right: auto; color: #333333; font-size: 16px; font-weight: normal; font-style: normal; background-color: #FFFFFF; width: auto; border-top-style: solid; border-top-width: 2px; border-top-color: #A8A8A8; border-right-style: none; border-right-width: 2px; border-right-color: #D3D3D3; border-bottom-style: solid; border-bottom-width: 2px; border-bottom-color: #A8A8A8; border-left-style: none; border-left-width: 2px; border-left-color: #D3D3D3; } #ltokhwwmhp .gt_caption { padding-top: 4px; padding-bottom: 4px; } #ltokhwwmhp .gt_title { color: #333333; font-size: 125%; font-weight: initial; padding-top: 4px; padding-bottom: 4px; padding-left: 5px; padding-right: 5px; border-bottom-color: #FFFFFF; border-bottom-width: 0; } #ltokhwwmhp .gt_subtitle { color: #333333; font-size: 85%; font-weight: initial; padding-top: 3px; padding-bottom: 5px; padding-left: 5px; padding-right: 5px; border-top-color: #FFFFFF; border-top-width: 0; } #ltokhwwmhp .gt_heading { background-color: #FFFFFF; text-align: center; border-bottom-color: #FFFFFF; border-left-style: none; border-left-width: 1px; border-left-color: #D3D3D3; border-right-style: none; border-right-width: 1px; border-right-color: #D3D3D3; } #ltokhwwmhp .gt_bottom_border { border-bottom-style: solid; border-bottom-width: 2px; border-bottom-color: #D3D3D3; } #ltokhwwmhp .gt_col_headings { border-top-style: solid; border-top-width: 2px; border-top-color: #D3D3D3; border-bottom-style: solid; border-bottom-width: 2px; border-bottom-color: #D3D3D3; border-left-style: none; border-left-width: 1px; border-left-color: #D3D3D3; border-right-style: none; border-right-width: 1px; border-right-color: #D3D3D3; } #ltokhwwmhp .gt_col_heading { color: #333333; background-color: #FFFFFF; font-size: 100%; font-weight: normal; text-transform: inherit; border-left-style: none; border-left-width: 1px; border-left-color: #D3D3D3; border-right-style: none; border-right-width: 1px; border-right-color: #D3D3D3; vertical-align: bottom; padding-top: 5px; padding-bottom: 6px; padding-left: 5px; padding-right: 5px; overflow-x: hidden; } #ltokhwwmhp .gt_column_spanner_outer { color: #333333; background-color: #FFFFFF; font-size: 100%; font-weight: normal; text-transform: inherit; padding-top: 0; padding-bottom: 0; padding-left: 4px; padding-right: 4px; } #ltokhwwmhp .gt_column_spanner_outer:first-child { padding-left: 0; } #ltokhwwmhp .gt_column_spanner_outer:last-child { padding-right: 0; } #ltokhwwmhp .gt_column_spanner { border-bottom-style: solid; border-bottom-width: 2px; border-bottom-color: #D3D3D3; vertical-align: bottom; padding-top: 5px; padding-bottom: 5px; overflow-x: hidden; display: inline-block; width: 100%; } #ltokhwwmhp .gt_spanner_row { border-bottom-style: hidden; } #ltokhwwmhp .gt_group_heading { padding-top: 8px; padding-bottom: 8px; padding-left: 5px; padding-right: 5px; color: #333333; background-color: #FFFFFF; font-size: 100%; font-weight: initial; text-transform: inherit; border-top-style: solid; border-top-width: 2px; border-top-color: #D3D3D3; border-bottom-style: solid; border-bottom-width: 2px; border-bottom-color: #D3D3D3; border-left-style: none; border-left-width: 1px; border-left-color: #D3D3D3; border-right-style: none; border-right-width: 1px; border-right-color: #D3D3D3; vertical-align: middle; text-align: left; } #ltokhwwmhp .gt_empty_group_heading { padding: 0.5px; color: #333333; background-color: #FFFFFF; font-size: 100%; font-weight: initial; border-top-style: solid; border-top-width: 2px; border-top-color: #D3D3D3; border-bottom-style: solid; border-bottom-width: 2px; border-bottom-color: #D3D3D3; vertical-align: middle; } #ltokhwwmhp .gt_from_md > :first-child { margin-top: 0; } #ltokhwwmhp .gt_from_md > :last-child { margin-bottom: 0; } #ltokhwwmhp .gt_row { padding-top: 8px; padding-bottom: 8px; padding-left: 5px; padding-right: 5px; margin: 10px; border-top-style: solid; border-top-width: 1px; border-top-color: #D3D3D3; border-left-style: none; border-left-width: 1px; border-left-color: #D3D3D3; border-right-style: none; border-right-width: 1px; border-right-color: #D3D3D3; vertical-align: middle; overflow-x: hidden; } #ltokhwwmhp .gt_stub { color: #333333; background-color: #FFFFFF; font-size: 100%; font-weight: initial; text-transform: inherit; border-right-style: solid; border-right-width: 2px; border-right-color: #D3D3D3; padding-left: 5px; padding-right: 5px; } #ltokhwwmhp .gt_stub_row_group { color: #333333; background-color: #FFFFFF; font-size: 100%; font-weight: initial; text-transform: inherit; border-right-style: solid; border-right-width: 2px; border-right-color: #D3D3D3; padding-left: 5px; padding-right: 5px; vertical-align: top; } #ltokhwwmhp .gt_row_group_first td { border-top-width: 2px; } #ltokhwwmhp .gt_row_group_first th { border-top-width: 2px; } #ltokhwwmhp .gt_summary_row { color: #333333; background-color: #FFFFFF; text-transform: inherit; padding-top: 8px; padding-bottom: 8px; padding-left: 5px; padding-right: 5px; } #ltokhwwmhp .gt_first_summary_row { border-top-style: solid; border-top-color: #D3D3D3; } #ltokhwwmhp .gt_first_summary_row.thick { border-top-width: 2px; } #ltokhwwmhp .gt_last_summary_row { padding-top: 8px; padding-bottom: 8px; padding-left: 5px; padding-right: 5px; border-bottom-style: solid; border-bottom-width: 2px; border-bottom-color: #D3D3D3; } #ltokhwwmhp .gt_grand_summary_row { color: #333333; background-color: #FFFFFF; text-transform: inherit; padding-top: 8px; padding-bottom: 8px; padding-left: 5px; padding-right: 5px; } #ltokhwwmhp .gt_first_grand_summary_row { padding-top: 8px; padding-bottom: 8px; padding-left: 5px; padding-right: 5px; border-top-style: double; border-top-width: 6px; border-top-color: #D3D3D3; } #ltokhwwmhp .gt_last_grand_summary_row_top { padding-top: 8px; padding-bottom: 8px; padding-left: 5px; padding-right: 5px; border-bottom-style: double; border-bottom-width: 6px; border-bottom-color: #D3D3D3; } #ltokhwwmhp .gt_striped { background-color: rgba(128, 128, 128, 0.05); } #ltokhwwmhp .gt_table_body { border-top-style: solid; border-top-width: 2px; border-top-color: #D3D3D3; border-bottom-style: solid; border-bottom-width: 2px; border-bottom-color: #D3D3D3; } #ltokhwwmhp .gt_footnotes { color: #333333; background-color: #FFFFFF; border-bottom-style: none; border-bottom-width: 2px; border-bottom-color: #D3D3D3; border-left-style: none; border-left-width: 2px; border-left-color: #D3D3D3; border-right-style: none; border-right-width: 2px; border-right-color: #D3D3D3; } #ltokhwwmhp .gt_footnote { margin: 0px; font-size: 90%; padding-top: 4px; padding-bottom: 4px; padding-left: 5px; padding-right: 5px; } #ltokhwwmhp .gt_sourcenotes { color: #333333; background-color: #FFFFFF; border-bottom-style: none; border-bottom-width: 2px; border-bottom-color: #D3D3D3; border-left-style: none; border-left-width: 2px; border-left-color: #D3D3D3; border-right-style: none; border-right-width: 2px; border-right-color: #D3D3D3; } #ltokhwwmhp .gt_sourcenote { font-size: 90%; padding-top: 4px; padding-bottom: 4px; padding-left: 5px; padding-right: 5px; } #ltokhwwmhp .gt_left { text-align: left; } #ltokhwwmhp .gt_center { text-align: center; } #ltokhwwmhp .gt_right { text-align: right; font-variant-numeric: tabular-nums; } #ltokhwwmhp .gt_font_normal { font-weight: normal; } #ltokhwwmhp .gt_font_bold { font-weight: bold; } #ltokhwwmhp .gt_font_italic { font-style: italic; } #ltokhwwmhp .gt_super { font-size: 65%; } #ltokhwwmhp .gt_footnote_marks { font-size: 75%; vertical-align: 0.4em; position: initial; } #ltokhwwmhp .gt_asterisk { font-size: 100%; vertical-align: 0; } #ltokhwwmhp .gt_indent_1 { text-indent: 5px; } #ltokhwwmhp .gt_indent_2 { text-indent: 10px; } #ltokhwwmhp .gt_indent_3 { text-indent: 15px; } #ltokhwwmhp .gt_indent_4 { text-indent: 20px; } #ltokhwwmhp .gt_indent_5 { text-indent: 25px; } #ltokhwwmhp .katex-display { display: inline-flex !important; margin-bottom: 0.75em !important; } #ltokhwwmhp div.Reactable > div.rt-table > div.rt-thead > div.rt-tr.rt-tr-group-header > div.rt-th-group:after { height: 0px !important; } </style> <table class="gt_table" data-quarto-disable-processing="false" data-quarto-bootstrap="false"> <thead> <tr class="gt_heading"> <td colspan="5" class="gt_heading gt_title gt_font_normal" style>Airline Passengers</td> </tr> <tr class="gt_heading"> <td colspan="5" class="gt_heading gt_subtitle gt_font_normal gt_bottom_border" style>Leg space is limited, what do you do?</td> </tr> <tr class="gt_col_headings gt_spanner_row"> <th class="gt_col_heading gt_columns_bottom_border gt_left" rowspan="2" colspan="1" scope="col" id="recline_frequency">Recline</th> <th class="gt_center gt_columns_top_border gt_column_spanner_outer" rowspan="1" colspan="4" scope="colgroup" id="Age Range"> <div class="gt_column_spanner">Age Range</div> </th> </tr> <tr class="gt_col_headings"> <th class="gt_col_heading gt_columns_bottom_border gt_right" rowspan="1" colspan="1" scope="col" id="a18-29">18-29</th> <th class="gt_col_heading gt_columns_bottom_border gt_right" rowspan="1" colspan="1" scope="col" id="a30-44">30-44</th> <th class="gt_col_heading gt_columns_bottom_border gt_right" rowspan="1" colspan="1" scope="col" id="a45-60">45-60</th> <th class="gt_col_heading gt_columns_bottom_border gt_right" rowspan="1" colspan="1" scope="col" id="a>-60">> 60</th> </tr> </thead> <tbody class="gt_table_body"> <tr class="gt_group_heading_row"> <th colspan="5" class="gt_group_heading" scope="colgroup" id="Female">Female</th> </tr> <tr class="gt_row_group_first"><td headers="Female recline_frequency" class="gt_row gt_left">Never</td> <td headers="Female 18-29" class="gt_row gt_right">24%</td> <td headers="Female 30-44" class="gt_row gt_right">21%</td> <td headers="Female 45-60" class="gt_row gt_right">19%</td> <td headers="Female > 60" class="gt_row gt_right">23%</td></tr> <tr><td headers="Female recline_frequency" class="gt_row gt_left">Once in a while</td> <td headers="Female 18-29" class="gt_row gt_right">36%</td> <td headers="Female 30-44" class="gt_row gt_right">25%</td> <td headers="Female 45-60" class="gt_row gt_right">30%</td> <td headers="Female > 60" class="gt_row gt_right">36%</td></tr> <tr><td headers="Female recline_frequency" class="gt_row gt_left">About half the time</td> <td headers="Female 18-29" class="gt_row gt_right">10%</td> <td headers="Female 30-44" class="gt_row gt_right">22%</td> <td headers="Female 45-60" class="gt_row gt_right">18%</td> <td headers="Female > 60" class="gt_row gt_right">17%</td></tr> <tr><td headers="Female recline_frequency" class="gt_row gt_left">Usually</td> <td headers="Female 18-29" class="gt_row gt_right">13%</td> <td headers="Female 30-44" class="gt_row gt_right">22%</td> <td headers="Female 45-60" class="gt_row gt_right">26%</td> <td headers="Female > 60" class="gt_row gt_right">28%</td></tr> <tr><td headers="Female recline_frequency" class="gt_row gt_left">Always</td> <td headers="Female 18-29" class="gt_row gt_right">10%</td> <td headers="Female 30-44" class="gt_row gt_right">21%</td> <td headers="Female 45-60" class="gt_row gt_right">29%</td> <td headers="Female > 60" class="gt_row gt_right">12%</td></tr> <tr class="gt_group_heading_row"> <th colspan="5" class="gt_group_heading" scope="colgroup" id="Male">Male</th> </tr> <tr class="gt_row_group_first"><td headers="Male recline_frequency" class="gt_row gt_left">Never</td> <td headers="Male 18-29" class="gt_row gt_right">24%</td> <td headers="Male 30-44" class="gt_row gt_right">17%</td> <td headers="Male 45-60" class="gt_row gt_right">20%</td> <td headers="Male > 60" class="gt_row gt_right">18%</td></tr> <tr><td headers="Male recline_frequency" class="gt_row gt_left">Once in a while</td> <td headers="Male 18-29" class="gt_row gt_right">19%</td> <td headers="Male 30-44" class="gt_row gt_right">39%</td> <td headers="Male 45-60" class="gt_row gt_right">40%</td> <td headers="Male > 60" class="gt_row gt_right">29%</td></tr> <tr><td headers="Male recline_frequency" class="gt_row gt_left">About half the time</td> <td headers="Male 18-29" class="gt_row gt_right">11%</td> <td headers="Male 30-44" class="gt_row gt_right">11%</td> <td headers="Male 45-60" class="gt_row gt_right">16%</td> <td headers="Male > 60" class="gt_row gt_right">11%</td></tr> <tr><td headers="Male recline_frequency" class="gt_row gt_left">Usually</td> <td headers="Male 18-29" class="gt_row gt_right">14%</td> <td headers="Male 30-44" class="gt_row gt_right">30%</td> <td headers="Male 45-60" class="gt_row gt_right">15%</td> <td headers="Male > 60" class="gt_row gt_right">27%</td></tr> <tr><td headers="Male recline_frequency" class="gt_row gt_left">Always</td> <td headers="Male 18-29" class="gt_row gt_right">11%</td> <td headers="Male 30-44" class="gt_row gt_right">14%</td> <td headers="Male 45-60" class="gt_row gt_right">21%</td> <td headers="Male > 60" class="gt_row gt_right">14%</td></tr> </tbody> <tfoot> <tr class="gt_sourcenotes"> <td class="gt_sourcenote" colspan="5"><span class='gt_from_md'>Data from <a href="https://fivethirtyeight.com/features/airplane-etiquette-recline-seat/">fivethirtyeight</a></span></td> </tr> </tfoot> </table> </div> --- # Color cells ``` r ... %>% * data_color( * columns = c(`18-29`, `30-44`, `45-60`, `> 60`), * fn = scales::col_numeric( * palette = c("#FFFFFF", "#FF0000"), * domain = NULL * ) * ) %>% ... ``` --- class: middle <div id="dldweasxrx" style="padding-left:0px;padding-right:0px;padding-top:10px;padding-bottom:10px;overflow-x:auto;overflow-y:auto;width:auto;height:auto;"> <style>#dldweasxrx table { font-family: system-ui, 'Segoe UI', Roboto, Helvetica, Arial, sans-serif, 'Apple Color Emoji', 'Segoe UI Emoji', 'Segoe UI Symbol', 'Noto Color Emoji'; -webkit-font-smoothing: antialiased; -moz-osx-font-smoothing: grayscale; } #dldweasxrx thead, #dldweasxrx tbody, #dldweasxrx tfoot, #dldweasxrx tr, #dldweasxrx td, #dldweasxrx th { border-style: none; } #dldweasxrx p { margin: 0; padding: 0; } #dldweasxrx .gt_table { display: table; border-collapse: collapse; line-height: normal; margin-left: auto; margin-right: auto; color: #333333; font-size: 16px; font-weight: normal; font-style: normal; background-color: #FFFFFF; width: auto; border-top-style: solid; border-top-width: 2px; border-top-color: #A8A8A8; border-right-style: none; border-right-width: 2px; border-right-color: #D3D3D3; border-bottom-style: solid; border-bottom-width: 2px; border-bottom-color: #A8A8A8; border-left-style: none; border-left-width: 2px; border-left-color: #D3D3D3; } #dldweasxrx .gt_caption { padding-top: 4px; padding-bottom: 4px; } #dldweasxrx .gt_title { color: #333333; font-size: 125%; font-weight: initial; padding-top: 4px; padding-bottom: 4px; padding-left: 5px; padding-right: 5px; border-bottom-color: #FFFFFF; border-bottom-width: 0; } #dldweasxrx .gt_subtitle { color: #333333; font-size: 85%; font-weight: initial; padding-top: 3px; padding-bottom: 5px; padding-left: 5px; padding-right: 5px; border-top-color: #FFFFFF; border-top-width: 0; } #dldweasxrx .gt_heading { background-color: #FFFFFF; text-align: center; border-bottom-color: #FFFFFF; border-left-style: none; border-left-width: 1px; border-left-color: #D3D3D3; border-right-style: none; border-right-width: 1px; border-right-color: #D3D3D3; } #dldweasxrx .gt_bottom_border { border-bottom-style: solid; border-bottom-width: 2px; border-bottom-color: #D3D3D3; } #dldweasxrx .gt_col_headings { border-top-style: solid; border-top-width: 2px; border-top-color: #D3D3D3; border-bottom-style: solid; border-bottom-width: 2px; border-bottom-color: #D3D3D3; border-left-style: none; border-left-width: 1px; border-left-color: #D3D3D3; border-right-style: none; border-right-width: 1px; border-right-color: #D3D3D3; } #dldweasxrx .gt_col_heading { color: #333333; background-color: #FFFFFF; font-size: 100%; font-weight: normal; text-transform: inherit; border-left-style: none; border-left-width: 1px; border-left-color: #D3D3D3; border-right-style: none; border-right-width: 1px; border-right-color: #D3D3D3; vertical-align: bottom; padding-top: 5px; padding-bottom: 6px; padding-left: 5px; padding-right: 5px; overflow-x: hidden; } #dldweasxrx .gt_column_spanner_outer { color: #333333; background-color: #FFFFFF; font-size: 100%; font-weight: normal; text-transform: inherit; padding-top: 0; padding-bottom: 0; padding-left: 4px; padding-right: 4px; } #dldweasxrx .gt_column_spanner_outer:first-child { padding-left: 0; } #dldweasxrx .gt_column_spanner_outer:last-child { padding-right: 0; } #dldweasxrx .gt_column_spanner { border-bottom-style: solid; border-bottom-width: 2px; border-bottom-color: #D3D3D3; vertical-align: bottom; padding-top: 5px; padding-bottom: 5px; overflow-x: hidden; display: inline-block; width: 100%; } #dldweasxrx .gt_spanner_row { border-bottom-style: hidden; } #dldweasxrx .gt_group_heading { padding-top: 8px; padding-bottom: 8px; padding-left: 5px; padding-right: 5px; color: #333333; background-color: #FFFFFF; font-size: 100%; font-weight: initial; text-transform: inherit; border-top-style: solid; border-top-width: 2px; border-top-color: #D3D3D3; border-bottom-style: solid; border-bottom-width: 2px; border-bottom-color: #D3D3D3; border-left-style: none; border-left-width: 1px; border-left-color: #D3D3D3; border-right-style: none; border-right-width: 1px; border-right-color: #D3D3D3; vertical-align: middle; text-align: left; } #dldweasxrx .gt_empty_group_heading { padding: 0.5px; color: #333333; background-color: #FFFFFF; font-size: 100%; font-weight: initial; border-top-style: solid; border-top-width: 2px; border-top-color: #D3D3D3; border-bottom-style: solid; border-bottom-width: 2px; border-bottom-color: #D3D3D3; vertical-align: middle; } #dldweasxrx .gt_from_md > :first-child { margin-top: 0; } #dldweasxrx .gt_from_md > :last-child { margin-bottom: 0; } #dldweasxrx .gt_row { padding-top: 8px; padding-bottom: 8px; padding-left: 5px; padding-right: 5px; margin: 10px; border-top-style: solid; border-top-width: 1px; border-top-color: #D3D3D3; border-left-style: none; border-left-width: 1px; border-left-color: #D3D3D3; border-right-style: none; border-right-width: 1px; border-right-color: #D3D3D3; vertical-align: middle; overflow-x: hidden; } #dldweasxrx .gt_stub { color: #333333; background-color: #FFFFFF; font-size: 100%; font-weight: initial; text-transform: inherit; border-right-style: solid; border-right-width: 2px; border-right-color: #D3D3D3; padding-left: 5px; padding-right: 5px; } #dldweasxrx .gt_stub_row_group { color: #333333; background-color: #FFFFFF; font-size: 100%; font-weight: initial; text-transform: inherit; border-right-style: solid; border-right-width: 2px; border-right-color: #D3D3D3; padding-left: 5px; padding-right: 5px; vertical-align: top; } #dldweasxrx .gt_row_group_first td { border-top-width: 2px; } #dldweasxrx .gt_row_group_first th { border-top-width: 2px; } #dldweasxrx .gt_summary_row { color: #333333; background-color: #FFFFFF; text-transform: inherit; padding-top: 8px; padding-bottom: 8px; padding-left: 5px; padding-right: 5px; } #dldweasxrx .gt_first_summary_row { border-top-style: solid; border-top-color: #D3D3D3; } #dldweasxrx .gt_first_summary_row.thick { border-top-width: 2px; } #dldweasxrx .gt_last_summary_row { padding-top: 8px; padding-bottom: 8px; padding-left: 5px; padding-right: 5px; border-bottom-style: solid; border-bottom-width: 2px; border-bottom-color: #D3D3D3; } #dldweasxrx .gt_grand_summary_row { color: #333333; background-color: #FFFFFF; text-transform: inherit; padding-top: 8px; padding-bottom: 8px; padding-left: 5px; padding-right: 5px; } #dldweasxrx .gt_first_grand_summary_row { padding-top: 8px; padding-bottom: 8px; padding-left: 5px; padding-right: 5px; border-top-style: double; border-top-width: 6px; border-top-color: #D3D3D3; } #dldweasxrx .gt_last_grand_summary_row_top { padding-top: 8px; padding-bottom: 8px; padding-left: 5px; padding-right: 5px; border-bottom-style: double; border-bottom-width: 6px; border-bottom-color: #D3D3D3; } #dldweasxrx .gt_striped { background-color: rgba(128, 128, 128, 0.05); } #dldweasxrx .gt_table_body { border-top-style: solid; border-top-width: 2px; border-top-color: #D3D3D3; border-bottom-style: solid; border-bottom-width: 2px; border-bottom-color: #D3D3D3; } #dldweasxrx .gt_footnotes { color: #333333; background-color: #FFFFFF; border-bottom-style: none; border-bottom-width: 2px; border-bottom-color: #D3D3D3; border-left-style: none; border-left-width: 2px; border-left-color: #D3D3D3; border-right-style: none; border-right-width: 2px; border-right-color: #D3D3D3; } #dldweasxrx .gt_footnote { margin: 0px; font-size: 90%; padding-top: 4px; padding-bottom: 4px; padding-left: 5px; padding-right: 5px; } #dldweasxrx .gt_sourcenotes { color: #333333; background-color: #FFFFFF; border-bottom-style: none; border-bottom-width: 2px; border-bottom-color: #D3D3D3; border-left-style: none; border-left-width: 2px; border-left-color: #D3D3D3; border-right-style: none; border-right-width: 2px; border-right-color: #D3D3D3; } #dldweasxrx .gt_sourcenote { font-size: 90%; padding-top: 4px; padding-bottom: 4px; padding-left: 5px; padding-right: 5px; } #dldweasxrx .gt_left { text-align: left; } #dldweasxrx .gt_center { text-align: center; } #dldweasxrx .gt_right { text-align: right; font-variant-numeric: tabular-nums; } #dldweasxrx .gt_font_normal { font-weight: normal; } #dldweasxrx .gt_font_bold { font-weight: bold; } #dldweasxrx .gt_font_italic { font-style: italic; } #dldweasxrx .gt_super { font-size: 65%; } #dldweasxrx .gt_footnote_marks { font-size: 75%; vertical-align: 0.4em; position: initial; } #dldweasxrx .gt_asterisk { font-size: 100%; vertical-align: 0; } #dldweasxrx .gt_indent_1 { text-indent: 5px; } #dldweasxrx .gt_indent_2 { text-indent: 10px; } #dldweasxrx .gt_indent_3 { text-indent: 15px; } #dldweasxrx .gt_indent_4 { text-indent: 20px; } #dldweasxrx .gt_indent_5 { text-indent: 25px; } #dldweasxrx .katex-display { display: inline-flex !important; margin-bottom: 0.75em !important; } #dldweasxrx div.Reactable > div.rt-table > div.rt-thead > div.rt-tr.rt-tr-group-header > div.rt-th-group:after { height: 0px !important; } </style> <table class="gt_table" data-quarto-disable-processing="false" data-quarto-bootstrap="false"> <thead> <tr class="gt_heading"> <td colspan="5" class="gt_heading gt_title gt_font_normal" style>Airline Passengers</td> </tr> <tr class="gt_heading"> <td colspan="5" class="gt_heading gt_subtitle gt_font_normal gt_bottom_border" style>Leg space is limited, what do you do?</td> </tr> <tr class="gt_col_headings gt_spanner_row"> <th class="gt_col_heading gt_columns_bottom_border gt_left" rowspan="2" colspan="1" scope="col" id="recline_frequency">Recline</th> <th class="gt_center gt_columns_top_border gt_column_spanner_outer" rowspan="1" colspan="4" scope="colgroup" id="Age Range"> <div class="gt_column_spanner">Age Range</div> </th> </tr> <tr class="gt_col_headings"> <th class="gt_col_heading gt_columns_bottom_border gt_right" rowspan="1" colspan="1" scope="col" id="a18-29">18-29</th> <th class="gt_col_heading gt_columns_bottom_border gt_right" rowspan="1" colspan="1" scope="col" id="a30-44">30-44</th> <th class="gt_col_heading gt_columns_bottom_border gt_right" rowspan="1" colspan="1" scope="col" id="a45-60">45-60</th> <th class="gt_col_heading gt_columns_bottom_border gt_right" rowspan="1" colspan="1" scope="col" id="a>-60">> 60</th> </tr> </thead> <tbody class="gt_table_body"> <tr class="gt_group_heading_row"> <th colspan="5" class="gt_group_heading" scope="colgroup" id="Female">Female</th> </tr> <tr class="gt_row_group_first"><td headers="Female recline_frequency" class="gt_row gt_left">Never</td> <td headers="Female 18-29" class="gt_row gt_right" style="background-color: #FF9678; color: #000000;">24%</td> <td headers="Female 30-44" class="gt_row gt_right" style="background-color: #FFBAA4; color: #000000;">21%</td> <td headers="Female 45-60" class="gt_row gt_right" style="background-color: #FFE0D6; color: #000000;">19%</td> <td headers="Female > 60" class="gt_row gt_right" style="background-color: #FFA286; color: #000000;">23%</td></tr> <tr><td headers="Female recline_frequency" class="gt_row gt_left">Once in a while</td> <td headers="Female 18-29" class="gt_row gt_right" style="background-color: #FF0000; color: #FFFFFF;">36%</td> <td headers="Female 30-44" class="gt_row gt_right" style="background-color: #FF9E81; color: #000000;">25%</td> <td headers="Female 45-60" class="gt_row gt_right" style="background-color: #FF8969; color: #000000;">30%</td> <td headers="Female > 60" class="gt_row gt_right" style="background-color: #FF0000; color: #FFFFFF;">36%</td></tr> <tr><td headers="Female recline_frequency" class="gt_row gt_left">About half the time</td> <td headers="Female 18-29" class="gt_row gt_right" style="background-color: #FFFFFF; color: #000000;">10%</td> <td headers="Female 30-44" class="gt_row gt_right" style="background-color: #FFB39B; color: #000000;">22%</td> <td headers="Female 45-60" class="gt_row gt_right" style="background-color: #FFE8E0; color: #000000;">18%</td> <td headers="Female > 60" class="gt_row gt_right" style="background-color: #FFD1C1; color: #000000;">17%</td></tr> <tr><td headers="Female recline_frequency" class="gt_row gt_left">Usually</td> <td headers="Female 18-29" class="gt_row gt_right" style="background-color: #FFE9E1; color: #000000;">13%</td> <td headers="Female 30-44" class="gt_row gt_right" style="background-color: #FFB39B; color: #000000;">22%</td> <td headers="Female 45-60" class="gt_row gt_right" style="background-color: #FFAA90; color: #000000;">26%</td> <td headers="Female > 60" class="gt_row gt_right" style="background-color: #FF7857; color: #FFFFFF;">28%</td></tr> <tr><td headers="Female recline_frequency" class="gt_row gt_left">Always</td> <td headers="Female 18-29" class="gt_row gt_right" style="background-color: #FFFFFF; color: #000000;">10%</td> <td headers="Female 30-44" class="gt_row gt_right" style="background-color: #FFBAA4; color: #000000;">21%</td> <td headers="Female 45-60" class="gt_row gt_right" style="background-color: #FF9273; color: #000000;">29%</td> <td headers="Female > 60" class="gt_row gt_right" style="background-color: #FFF7F5; color: #000000;">12%</td></tr> <tr class="gt_group_heading_row"> <th colspan="5" class="gt_group_heading" scope="colgroup" id="Male">Male</th> </tr> <tr class="gt_row_group_first"><td headers="Male recline_frequency" class="gt_row gt_left">Never</td> <td headers="Male 18-29" class="gt_row gt_right" style="background-color: #FF9678; color: #000000;">24%</td> <td headers="Male 30-44" class="gt_row gt_right" style="background-color: #FFD6C8; color: #000000;">17%</td> <td headers="Male 45-60" class="gt_row gt_right" style="background-color: #FFD9CB; color: #000000;">20%</td> <td headers="Male > 60" class="gt_row gt_right" style="background-color: #FFC9B7; color: #000000;">18%</td></tr> <tr><td headers="Male recline_frequency" class="gt_row gt_left">Once in a while</td> <td headers="Male 18-29" class="gt_row gt_right" style="background-color: #FFBDA7; color: #000000;">19%</td> <td headers="Male 30-44" class="gt_row gt_right" style="background-color: #FF0000; color: #FFFFFF;">39%</td> <td headers="Male 45-60" class="gt_row gt_right" style="background-color: #FF0000; color: #FFFFFF;">40%</td> <td headers="Male > 60" class="gt_row gt_right" style="background-color: #FF6F4D; color: #FFFFFF;">29%</td></tr> <tr><td headers="Male recline_frequency" class="gt_row gt_left">About half the time</td> <td headers="Male 18-29" class="gt_row gt_right" style="background-color: #FFF8F5; color: #000000;">11%</td> <td headers="Male 30-44" class="gt_row gt_right" style="background-color: #FFFFFF; color: #000000;">11%</td> <td headers="Male 45-60" class="gt_row gt_right" style="background-color: #FFF7F5; color: #000000;">16%</td> <td headers="Male > 60" class="gt_row gt_right" style="background-color: #FFFFFF; color: #000000;">11%</td></tr> <tr><td headers="Male recline_frequency" class="gt_row gt_left">Usually</td> <td headers="Male 18-29" class="gt_row gt_right" style="background-color: #FFE2D7; color: #000000;">14%</td> <td headers="Male 30-44" class="gt_row gt_right" style="background-color: #FF7857; color: #FFFFFF;">30%</td> <td headers="Male 45-60" class="gt_row gt_right" style="background-color: #FFFFFF; color: #000000;">15%</td> <td headers="Male > 60" class="gt_row gt_right" style="background-color: #FF8160; color: #000000;">27%</td></tr> <tr><td headers="Male recline_frequency" class="gt_row gt_left">Always</td> <td headers="Male 18-29" class="gt_row gt_right" style="background-color: #FFF8F5; color: #000000;">11%</td> <td headers="Male 30-44" class="gt_row gt_right" style="background-color: #FFEBE3; color: #000000;">14%</td> <td headers="Male 45-60" class="gt_row gt_right" style="background-color: #FFD1C1; color: #000000;">21%</td> <td headers="Male > 60" class="gt_row gt_right" style="background-color: #FFE8E0; color: #000000;">14%</td></tr> </tbody> <tfoot> <tr class="gt_sourcenotes"> <td class="gt_sourcenote" colspan="5"><span class='gt_from_md'>Data from <a href="https://fivethirtyeight.com/features/airplane-etiquette-recline-seat/">fivethirtyeight</a></span></td> </tr> </tfoot> </table> </div> --- # What else? * Lots more it can do — see the [website](https://gt.rstudio.com) -- [Thomas Mock](https://twitter.com/thomas_mock) does great work with tables and often shares tutorials (e.g., [embedding custom features](https://themockup.blog/posts/2020-10-31-embedding-custom-features-in-gt-tables/), [functions and themes](https://themockup.blog/posts/2020-09-26-functions-and-themes-for-gt-tables/), [10 table rules](https://themockup.blog/posts/2020-09-04-10-table-rules-in-r/)). --- class: inverse-red center middle # A few other table options --- # kableExtra ### A few quick examples Make sure to specify `results = "asis"` in your chunk options. .pull-left[ ``` r library(knitr) library(kableExtra) dt <- mtcars[1:5, 1:6] kable(dt) %>% kable_styling("striped") %>% column_spec(5:7, bold = TRUE) ``` ] .pull-right[ <table class="table table-striped" style="margin-left: auto; margin-right: auto;"> <thead> <tr> <th style="text-align:left;"> </th> <th style="text-align:right;"> mpg </th> <th style="text-align:right;"> cyl </th> <th style="text-align:right;"> disp </th> <th style="text-align:right;"> hp </th> <th style="text-align:right;"> drat </th> <th style="text-align:right;"> wt </th> </tr> </thead> <tbody> <tr> <td style="text-align:left;"> Mazda RX4 </td> <td style="text-align:right;"> 21.0 </td> <td style="text-align:right;"> 6 </td> <td style="text-align:right;"> 160 </td> <td style="text-align:right;font-weight: bold;"> 110 </td> <td style="text-align:right;font-weight: bold;"> 3.90 </td> <td style="text-align:right;font-weight: bold;"> 2.620 </td> </tr> <tr> <td style="text-align:left;"> Mazda RX4 Wag </td> <td style="text-align:right;"> 21.0 </td> <td style="text-align:right;"> 6 </td> <td style="text-align:right;"> 160 </td> <td style="text-align:right;font-weight: bold;"> 110 </td> <td style="text-align:right;font-weight: bold;"> 3.90 </td> <td style="text-align:right;font-weight: bold;"> 2.875 </td> </tr> <tr> <td style="text-align:left;"> Datsun 710 </td> <td style="text-align:right;"> 22.8 </td> <td style="text-align:right;"> 4 </td> <td style="text-align:right;"> 108 </td> <td style="text-align:right;font-weight: bold;"> 93 </td> <td style="text-align:right;font-weight: bold;"> 3.85 </td> <td style="text-align:right;font-weight: bold;"> 2.320 </td> </tr> <tr> <td style="text-align:left;"> Hornet 4 Drive </td> <td style="text-align:right;"> 21.4 </td> <td style="text-align:right;"> 6 </td> <td style="text-align:right;"> 258 </td> <td style="text-align:right;font-weight: bold;"> 110 </td> <td style="text-align:right;font-weight: bold;"> 3.08 </td> <td style="text-align:right;font-weight: bold;"> 3.215 </td> </tr> <tr> <td style="text-align:left;"> Hornet Sportabout </td> <td style="text-align:right;"> 18.7 </td> <td style="text-align:right;"> 8 </td> <td style="text-align:right;"> 360 </td> <td style="text-align:right;font-weight: bold;"> 175 </td> <td style="text-align:right;font-weight: bold;"> 3.15 </td> <td style="text-align:right;font-weight: bold;"> 3.440 </td> </tr> </tbody> </table> ] --- ``` r kable(dt) %>% kable_styling("striped") %>% column_spec(5:7, bold = TRUE) %>% row_spec(c(2, 4), bold = TRUE, color = "#EFF3F7", background = "#71B0DE") ``` <table class="table table-striped" style="margin-left: auto; margin-right: auto;"> <thead> <tr> <th style="text-align:left;"> </th> <th style="text-align:right;"> mpg </th> <th style="text-align:right;"> cyl </th> <th style="text-align:right;"> disp </th> <th style="text-align:right;"> hp </th> <th style="text-align:right;"> drat </th> <th style="text-align:right;"> wt </th> </tr> </thead> <tbody> <tr> <td style="text-align:left;"> Mazda RX4 </td> <td style="text-align:right;"> 21.0 </td> <td style="text-align:right;"> 6 </td> <td style="text-align:right;"> 160 </td> <td style="text-align:right;font-weight: bold;"> 110 </td> <td style="text-align:right;font-weight: bold;"> 3.90 </td> <td style="text-align:right;font-weight: bold;"> 2.620 </td> </tr> <tr> <td style="text-align:left;font-weight: bold;color: rgba(239, 243, 247, 255) !important;background-color: rgba(113, 176, 222, 255) !important;"> Mazda RX4 Wag </td> <td style="text-align:right;font-weight: bold;color: rgba(239, 243, 247, 255) !important;background-color: rgba(113, 176, 222, 255) !important;"> 21.0 </td> <td style="text-align:right;font-weight: bold;color: rgba(239, 243, 247, 255) !important;background-color: rgba(113, 176, 222, 255) !important;"> 6 </td> <td style="text-align:right;font-weight: bold;color: rgba(239, 243, 247, 255) !important;background-color: rgba(113, 176, 222, 255) !important;"> 160 </td> <td style="text-align:right;font-weight: bold;font-weight: bold;color: rgba(239, 243, 247, 255) !important;background-color: rgba(113, 176, 222, 255) !important;"> 110 </td> <td style="text-align:right;font-weight: bold;font-weight: bold;color: rgba(239, 243, 247, 255) !important;background-color: rgba(113, 176, 222, 255) !important;"> 3.90 </td> <td style="text-align:right;font-weight: bold;font-weight: bold;color: rgba(239, 243, 247, 255) !important;background-color: rgba(113, 176, 222, 255) !important;"> 2.875 </td> </tr> <tr> <td style="text-align:left;"> Datsun 710 </td> <td style="text-align:right;"> 22.8 </td> <td style="text-align:right;"> 4 </td> <td style="text-align:right;"> 108 </td> <td style="text-align:right;font-weight: bold;"> 93 </td> <td style="text-align:right;font-weight: bold;"> 3.85 </td> <td style="text-align:right;font-weight: bold;"> 2.320 </td> </tr> <tr> <td style="text-align:left;font-weight: bold;color: rgba(239, 243, 247, 255) !important;background-color: rgba(113, 176, 222, 255) !important;"> Hornet 4 Drive </td> <td style="text-align:right;font-weight: bold;color: rgba(239, 243, 247, 255) !important;background-color: rgba(113, 176, 222, 255) !important;"> 21.4 </td> <td style="text-align:right;font-weight: bold;color: rgba(239, 243, 247, 255) !important;background-color: rgba(113, 176, 222, 255) !important;"> 6 </td> <td style="text-align:right;font-weight: bold;color: rgba(239, 243, 247, 255) !important;background-color: rgba(113, 176, 222, 255) !important;"> 258 </td> <td style="text-align:right;font-weight: bold;font-weight: bold;color: rgba(239, 243, 247, 255) !important;background-color: rgba(113, 176, 222, 255) !important;"> 110 </td> <td style="text-align:right;font-weight: bold;font-weight: bold;color: rgba(239, 243, 247, 255) !important;background-color: rgba(113, 176, 222, 255) !important;"> 3.08 </td> <td style="text-align:right;font-weight: bold;font-weight: bold;color: rgba(239, 243, 247, 255) !important;background-color: rgba(113, 176, 222, 255) !important;"> 3.215 </td> </tr> <tr> <td style="text-align:left;"> Hornet Sportabout </td> <td style="text-align:right;"> 18.7 </td> <td style="text-align:right;"> 8 </td> <td style="text-align:right;"> 360 </td> <td style="text-align:right;font-weight: bold;"> 175 </td> <td style="text-align:right;font-weight: bold;"> 3.15 </td> <td style="text-align:right;font-weight: bold;"> 3.440 </td> </tr> </tbody> </table> --- ``` r kable(dt) %>% kable_styling("striped", full_width = FALSE) %>% pack_rows( "Group 1", 1, 3, label_row_css = "background-color: #666; color: #fff;" ) %>% pack_rows( "Group 2", 4, 5, label_row_css = "background-color: #666; color: #fff;" ) ``` <table class="table table-striped" style="width: auto !important; margin-left: auto; margin-right: auto;"> <thead> <tr> <th style="text-align:left;"> </th> <th style="text-align:right;"> mpg </th> <th style="text-align:right;"> cyl </th> <th style="text-align:right;"> disp </th> <th style="text-align:right;"> hp </th> <th style="text-align:right;"> drat </th> <th style="text-align:right;"> wt </th> </tr> </thead> <tbody> <tr grouplength="3"><td colspan="7" style="background-color: #666; color: #fff;"><strong>Group 1</strong></td></tr> <tr> <td style="text-align:left;padding-left: 2em;" indentlevel="1"> Mazda RX4 </td> <td style="text-align:right;"> 21.0 </td> <td style="text-align:right;"> 6 </td> <td style="text-align:right;"> 160 </td> <td style="text-align:right;"> 110 </td> <td style="text-align:right;"> 3.90 </td> <td style="text-align:right;"> 2.620 </td> </tr> <tr> <td style="text-align:left;padding-left: 2em;" indentlevel="1"> Mazda RX4 Wag </td> <td style="text-align:right;"> 21.0 </td> <td style="text-align:right;"> 6 </td> <td style="text-align:right;"> 160 </td> <td style="text-align:right;"> 110 </td> <td style="text-align:right;"> 3.90 </td> <td style="text-align:right;"> 2.875 </td> </tr> <tr> <td style="text-align:left;padding-left: 2em;" indentlevel="1"> Datsun 710 </td> <td style="text-align:right;"> 22.8 </td> <td style="text-align:right;"> 4 </td> <td style="text-align:right;"> 108 </td> <td style="text-align:right;"> 93 </td> <td style="text-align:right;"> 3.85 </td> <td style="text-align:right;"> 2.320 </td> </tr> <tr grouplength="2"><td colspan="7" style="background-color: #666; color: #fff;"><strong>Group 2</strong></td></tr> <tr> <td style="text-align:left;padding-left: 2em;" indentlevel="1"> Hornet 4 Drive </td> <td style="text-align:right;"> 21.4 </td> <td style="text-align:right;"> 6 </td> <td style="text-align:right;"> 258 </td> <td style="text-align:right;"> 110 </td> <td style="text-align:right;"> 3.08 </td> <td style="text-align:right;"> 3.215 </td> </tr> <tr> <td style="text-align:left;padding-left: 2em;" indentlevel="1"> Hornet Sportabout </td> <td style="text-align:right;"> 18.7 </td> <td style="text-align:right;"> 8 </td> <td style="text-align:right;"> 360 </td> <td style="text-align:right;"> 175 </td> <td style="text-align:right;"> 3.15 </td> <td style="text-align:right;"> 3.440 </td> </tr> </tbody> </table> --- # kableExtra wrapup Many other options — see the documentation. Works well for both PDF and HTML. -- What about Microsoft Word? Use [{flextable}](https://davidgohel.github.io/flextable/index.html) — it's specifically designed for Word output. --- # Many others * [huxtable](https://hughjonesd.github.io/huxtable/) * [formattable](https://renkun-ken.github.io/formattable/) * [DT](https://rstudio.github.io/DT/) * [rhandsontable](https://jrowen.github.io/rhandsontable/) -- ### Particularly helpful for modeling output * [modelsummary](https://github.com/vincentarelbundock/modelsummary) * [stargazer](https://www.jakeruss.com/cheatsheets/stargazer/) * [pixiedust](https://github.com/nutterb/pixiedust) -- ### For descriptives * [gtsummary](https://github.com/ddsjoberg/gtsummary) --- class: inverse-red middle # reactable My favorite for interactive tables --- [](https://glin.github.io/reactable/index.html) Works great with [**shiny**](https://shiny.rstudio.com) too --- # Penguins data ``` r library(palmerpenguins) library(reactable) reactable(penguins) ``` --- class: middle <iframe src="widgets/rt_basic.html" width="100%" height="450px" frameborder="0"></iframe> --- # Rename columns ``` r penguins %>% reactable( columns = list( bill_length_mm = colDef(name = "Bill Length (mm)"), bill_depth_mm = colDef(name = "Bill Depth (mm)") ) ) ``` --- class: middle <iframe src="widgets/rt_rename.html" width="100%" height="450px" frameborder="0"></iframe> --- # Or use a function ``` r penguins %>% reactable( defaultColDef = colDef( header = function(x) str_to_title(gsub("_", " ", x)) ) ) ``` --- class: middle <iframe src="widgets/rt_function.html" width="100%" height="450px" frameborder="0"></iframe> --- # Add filter, search, pagination ``` r reactable(penguins, filterable = TRUE) reactable(penguins, searchable = TRUE) reactable(penguins, defaultPageSize = 3) reactable(penguins, defaultPageSize = 3, paginationType = "jump") ``` --- class: middle <iframe src="widgets/rt_filter.html" width="100%" height="450px" frameborder="0"></iframe> --- # Grouping and aggregation ``` r penguins %>% reactable( groupBy = c("species", "island"), columns = list( bill_length_mm = colDef(aggregate = "mean", format = colFormat(digits = 2)) ) ) ``` --- class: middle <iframe src="widgets/rt_grouping.html" width="100%" height="450px" frameborder="0"></iframe> --- # Sparklines ``` r library(sparkline) table_data <- penguins %>% group_by(species) %>% summarize(bill_length = list(bill_length_mm)) %>% mutate(boxplot = NA, sparkline = NA) table_data %>% reactable( columns = list( bill_length = colDef(cell = function(value) { sparkline(value, type = "bar") }), boxplot = colDef(cell = function(value, index) { sparkline(table_data$bill_length[[index]], type = "box") }), sparkline = colDef(cell = function(value, index) { sparkline(table_data$bill_length[[index]]) }) ) ) ``` --- class: middle <iframe src="widgets/rt_sparkline.html" width="100%" height="450px" frameborder="0"></iframe> --- # Lots more! The goal today isn't to teach you everything — it's to show you what's possible. Check out the [documentation](https://glin.github.io/reactable/index.html) for more. -- Also check out [{reactablefmtr}](https://kcuilla.github.io/reactablefmtr/index.html) for easier use and amazing visual extensions! --- class: inverse-blue middle # Handling Data for Deployment ## Flexdashboards and Quarto Blogs --- # The Core Question When you embed a widget or dashboard in a Quarto blog — where does the **data** live? Four options, each with tradeoffs: * Self-contained HTML * Committed data folder * Inline base64 encoding * Remote data source The right choice depends on **data size** and **sensitivity** --- # Option 1: Self-Contained HTML Add one line to your flexdashboard YAML: ````yaml output: flexdashboard::flex_dashboard: self_contained: true ```` * Bundles data, widgets, and CSS into a **single HTML file** * Just commit and push that one file — no broken paths * ✅ Best for: small datasets, maximum simplicity * ❌ Avoid if: file size gets large (>10MB) --- # Option 2: Commit a Data Folder Keep data alongside your built site: ```` docs/ ├── my-dashboard.html └── data/ └── my_data.csv ```` Read with a relative path in your Rmd: ````r df <- read_csv("data/my_data.csv") ```` * Commit everything including `data/` and push to GitHub * ✅ Best for: medium datasets you want to reuse across posts * ❌ Avoid if: data is sensitive or changes frequently --- # Option 3: Remote Data Source Pull live from an API, Google Sheets, or database at render time: ````r library(googlesheets4) df <- read_sheet("your-sheet-id") # or from tidycensus, an API, etc. df <- get_acs(geography = "tract", ...) ```` * Nothing sensitive ever touches GitHub * Data stays up to date without re-rendering * ✅ Best for: sensitive, large, or frequently updated data * Add `data/` to `.gitignore` if caching locally --- # Embedding Widgets: Quarto Blog In a Quarto blog post, widgets work **natively** — no extra steps: ````r <div class="reactable html-widget html-fill-item" id="htmlwidget-14f8f7ac45a07b2016f0" style="width:auto;height:auto;"></div> <script type="application/json" data-for="htmlwidget-14f8f7ac45a07b2016f0">{"x":{"tag":{"name":"Reactable","attribs":{"data":{"species":["Adelie","Adelie","Adelie","Adelie","Adelie","Adelie","Adelie","Adelie","Adelie","Adelie","Adelie","Adelie","Adelie","Adelie","Adelie","Adelie","Adelie","Adelie","Adelie","Adelie","Adelie","Adelie","Adelie","Adelie","Adelie","Adelie","Adelie","Adelie","Adelie","Adelie","Adelie","Adelie","Adelie","Adelie","Adelie","Adelie","Adelie","Adelie","Adelie","Adelie","Adelie","Adelie","Adelie","Adelie","Adelie","Adelie","Adelie","Adelie","Adelie","Adelie","Adelie","Adelie","Adelie","Adelie","Adelie","Adelie","Adelie","Adelie","Adelie","Adelie","Adelie","Adelie","Adelie","Adelie","Adelie","Adelie","Adelie","Adelie","Adelie","Adelie","Adelie","Adelie","Adelie","Adelie","Adelie","Adelie","Adelie","Adelie","Adelie","Adelie","Adelie","Adelie","Adelie","Adelie","Adelie","Adelie","Adelie","Adelie","Adelie","Adelie","Adelie","Adelie","Adelie","Adelie","Adelie","Adelie","Adelie","Adelie","Adelie","Adelie","Adelie","Adelie","Adelie","Adelie","Adelie","Adelie","Adelie","Adelie","Adelie","Adelie","Adelie","Adelie","Adelie","Adelie","Adelie","Adelie","Adelie","Adelie","Adelie","Adelie","Adelie","Adelie","Adelie","Adelie","Adelie","Adelie","Adelie","Adelie","Adelie","Adelie","Adelie","Adelie","Adelie","Adelie","Adelie","Adelie","Adelie","Adelie","Adelie","Adelie","Adelie","Adelie","Adelie","Adelie","Adelie","Adelie","Adelie","Adelie","Adelie","Adelie","Adelie","Adelie","Gentoo","Gentoo","Gentoo","Gentoo","Gentoo","Gentoo","Gentoo","Gentoo","Gentoo","Gentoo","Gentoo","Gentoo","Gentoo","Gentoo","Gentoo","Gentoo","Gentoo","Gentoo","Gentoo","Gentoo","Gentoo","Gentoo","Gentoo","Gentoo","Gentoo","Gentoo","Gentoo","Gentoo","Gentoo","Gentoo","Gentoo","Gentoo","Gentoo","Gentoo","Gentoo","Gentoo","Gentoo","Gentoo","Gentoo","Gentoo","Gentoo","Gentoo","Gentoo","Gentoo","Gentoo","Gentoo","Gentoo","Gentoo","Gentoo","Gentoo","Gentoo","Gentoo","Gentoo","Gentoo","Gentoo","Gentoo","Gentoo","Gentoo","Gentoo","Gentoo","Gentoo","Gentoo","Gentoo","Gentoo","Gentoo","Gentoo","Gentoo","Gentoo","Gentoo","Gentoo","Gentoo","Gentoo","Gentoo","Gentoo","Gentoo","Gentoo","Gentoo","Gentoo","Gentoo","Gentoo","Gentoo","Gentoo","Gentoo","Gentoo","Gentoo","Gentoo","Gentoo","Gentoo","Gentoo","Gentoo","Gentoo","Gentoo","Gentoo","Gentoo","Gentoo","Gentoo","Gentoo","Gentoo","Gentoo","Gentoo","Gentoo","Gentoo","Gentoo","Gentoo","Gentoo","Gentoo","Gentoo","Gentoo","Gentoo","Gentoo","Gentoo","Gentoo","Gentoo","Gentoo","Gentoo","Gentoo","Gentoo","Gentoo","Gentoo","Gentoo","Gentoo","Gentoo","Gentoo","Gentoo","Chinstrap","Chinstrap","Chinstrap","Chinstrap","Chinstrap","Chinstrap","Chinstrap","Chinstrap","Chinstrap","Chinstrap","Chinstrap","Chinstrap","Chinstrap","Chinstrap","Chinstrap","Chinstrap","Chinstrap","Chinstrap","Chinstrap","Chinstrap","Chinstrap","Chinstrap","Chinstrap","Chinstrap","Chinstrap","Chinstrap","Chinstrap","Chinstrap","Chinstrap","Chinstrap","Chinstrap","Chinstrap","Chinstrap","Chinstrap","Chinstrap","Chinstrap","Chinstrap","Chinstrap","Chinstrap","Chinstrap","Chinstrap","Chinstrap","Chinstrap","Chinstrap","Chinstrap","Chinstrap","Chinstrap","Chinstrap","Chinstrap","Chinstrap","Chinstrap","Chinstrap","Chinstrap","Chinstrap","Chinstrap","Chinstrap","Chinstrap","Chinstrap","Chinstrap","Chinstrap","Chinstrap","Chinstrap","Chinstrap","Chinstrap","Chinstrap","Chinstrap","Chinstrap","Chinstrap"],"island":["Torgersen","Torgersen","Torgersen","Torgersen","Torgersen","Torgersen","Torgersen","Torgersen","Torgersen","Torgersen","Torgersen","Torgersen","Torgersen","Torgersen","Torgersen","Torgersen","Torgersen","Torgersen","Torgersen","Torgersen","Biscoe","Biscoe","Biscoe","Biscoe","Biscoe","Biscoe","Biscoe","Biscoe","Biscoe","Biscoe","Dream","Dream","Dream","Dream","Dream","Dream","Dream","Dream","Dream","Dream","Dream","Dream","Dream","Dream","Dream","Dream","Dream","Dream","Dream","Dream","Biscoe","Biscoe","Biscoe","Biscoe","Biscoe","Biscoe","Biscoe","Biscoe","Biscoe","Biscoe","Biscoe","Biscoe","Biscoe","Biscoe","Biscoe","Biscoe","Biscoe","Biscoe","Torgersen","Torgersen","Torgersen","Torgersen","Torgersen","Torgersen","Torgersen","Torgersen","Torgersen","Torgersen","Torgersen","Torgersen","Torgersen","Torgersen","Torgersen","Torgersen","Dream","Dream","Dream","Dream","Dream","Dream","Dream","Dream","Dream","Dream","Dream","Dream","Dream","Dream","Dream","Dream","Biscoe","Biscoe","Biscoe","Biscoe","Biscoe","Biscoe","Biscoe","Biscoe","Biscoe","Biscoe","Biscoe","Biscoe","Biscoe","Biscoe","Biscoe","Biscoe","Torgersen","Torgersen","Torgersen","Torgersen","Torgersen","Torgersen","Torgersen","Torgersen","Torgersen","Torgersen","Torgersen","Torgersen","Torgersen","Torgersen","Torgersen","Torgersen","Dream","Dream","Dream","Dream","Dream","Dream","Dream","Dream","Dream","Dream","Dream","Dream","Dream","Dream","Dream","Dream","Dream","Dream","Dream","Dream","Biscoe","Biscoe","Biscoe","Biscoe","Biscoe","Biscoe","Biscoe","Biscoe","Biscoe","Biscoe","Biscoe","Biscoe","Biscoe","Biscoe","Biscoe","Biscoe","Biscoe","Biscoe","Biscoe","Biscoe","Biscoe","Biscoe","Biscoe","Biscoe","Biscoe","Biscoe","Biscoe","Biscoe","Biscoe","Biscoe","Biscoe","Biscoe","Biscoe","Biscoe","Biscoe","Biscoe","Biscoe","Biscoe","Biscoe","Biscoe","Biscoe","Biscoe","Biscoe","Biscoe","Biscoe","Biscoe","Biscoe","Biscoe","Biscoe","Biscoe","Biscoe","Biscoe","Biscoe","Biscoe","Biscoe","Biscoe","Biscoe","Biscoe","Biscoe","Biscoe","Biscoe","Biscoe","Biscoe","Biscoe","Biscoe","Biscoe","Biscoe","Biscoe","Biscoe","Biscoe","Biscoe","Biscoe","Biscoe","Biscoe","Biscoe","Biscoe","Biscoe","Biscoe","Biscoe","Biscoe","Biscoe","Biscoe","Biscoe","Biscoe","Biscoe","Biscoe","Biscoe","Biscoe","Biscoe","Biscoe","Biscoe","Biscoe","Biscoe","Biscoe","Biscoe","Biscoe","Biscoe","Biscoe","Biscoe","Biscoe","Biscoe","Biscoe","Biscoe","Biscoe","Biscoe","Biscoe","Biscoe","Biscoe","Biscoe","Biscoe","Biscoe","Biscoe","Biscoe","Biscoe","Biscoe","Biscoe","Biscoe","Biscoe","Biscoe","Biscoe","Biscoe","Biscoe","Biscoe","Biscoe","Dream","Dream","Dream","Dream","Dream","Dream","Dream","Dream","Dream","Dream","Dream","Dream","Dream","Dream","Dream","Dream","Dream","Dream","Dream","Dream","Dream","Dream","Dream","Dream","Dream","Dream","Dream","Dream","Dream","Dream","Dream","Dream","Dream","Dream","Dream","Dream","Dream","Dream","Dream","Dream","Dream","Dream","Dream","Dream","Dream","Dream","Dream","Dream","Dream","Dream","Dream","Dream","Dream","Dream","Dream","Dream","Dream","Dream","Dream","Dream","Dream","Dream","Dream","Dream","Dream","Dream","Dream","Dream"],"bill_length_mm":[39.1,39.5,40.3,"NA",36.7,39.3,38.9,39.2,34.1,42,37.8,37.8,41.1,38.6,34.6,36.6,38.7,42.5,34.4,46,37.8,37.7,35.9,38.2,38.8,35.3,40.6,40.5,37.9,40.5,39.5,37.2,39.5,40.9,36.4,39.2,38.8,42.2,37.6,39.8,36.5,40.8,36,44.1,37,39.6,41.1,37.5,36,42.3,39.6,40.1,35,42,34.5,41.4,39,40.6,36.5,37.6,35.7,41.3,37.6,41.1,36.4,41.6,35.5,41.1,35.9,41.8,33.5,39.7,39.6,45.8,35.5,42.8,40.9,37.2,36.2,42.1,34.6,42.9,36.7,35.1,37.3,41.3,36.3,36.9,38.3,38.9,35.7,41.1,34,39.6,36.2,40.8,38.1,40.3,33.1,43.2,35,41,37.7,37.8,37.9,39.7,38.6,38.2,38.1,43.2,38.1,45.6,39.7,42.2,39.6,42.7,38.6,37.3,35.7,41.1,36.2,37.7,40.2,41.4,35.2,40.6,38.8,41.5,39,44.1,38.5,43.1,36.8,37.5,38.1,41.1,35.6,40.2,37,39.7,40.2,40.6,32.1,40.7,37.3,39,39.2,36.6,36,37.8,36,41.5,46.1,50,48.7,50,47.6,46.5,45.4,46.7,43.3,46.8,40.9,49,45.5,48.4,45.8,49.3,42,49.2,46.2,48.7,50.2,45.1,46.5,46.3,42.9,46.1,44.5,47.8,48.2,50,47.3,42.8,45.1,59.6,49.1,48.4,42.6,44.4,44,48.7,42.7,49.6,45.3,49.6,50.5,43.6,45.5,50.5,44.9,45.2,46.6,48.5,45.1,50.1,46.5,45,43.8,45.5,43.2,50.4,45.3,46.2,45.7,54.3,45.8,49.8,46.2,49.5,43.5,50.7,47.7,46.4,48.2,46.5,46.4,48.6,47.5,51.1,45.2,45.2,49.1,52.5,47.4,50,44.9,50.8,43.4,51.3,47.5,52.1,47.5,52.2,45.5,49.5,44.5,50.8,49.4,46.9,48.4,51.1,48.5,55.9,47.2,49.1,47.3,46.8,41.7,53.4,43.3,48.1,50.5,49.8,43.5,51.5,46.2,55.1,44.5,48.8,47.2,"NA",46.8,50.4,45.2,49.9,46.5,50,51.3,45.4,52.7,45.2,46.1,51.3,46,51.3,46.6,51.7,47,52,45.9,50.5,50.3,58,46.4,49.2,42.4,48.5,43.2,50.6,46.7,52,50.5,49.5,46.4,52.8,40.9,54.2,42.5,51,49.7,47.5,47.6,52,46.9,53.5,49,46.2,50.9,45.5,50.9,50.8,50.1,49,51.5,49.8,48.1,51.4,45.7,50.7,42.5,52.2,45.2,49.3,50.2,45.6,51.9,46.8,45.7,55.8,43.5,49.6,50.8,50.2],"bill_depth_mm":[18.7,17.4,18,"NA",19.3,20.6,17.8,19.6,18.1,20.2,17.1,17.3,17.6,21.2,21.1,17.8,19,20.7,18.4,21.5,18.3,18.7,19.2,18.1,17.2,18.9,18.6,17.9,18.6,18.9,16.7,18.1,17.8,18.9,17,21.1,20,18.5,19.3,19.1,18,18.4,18.5,19.7,16.9,18.8,19,18.9,17.9,21.2,17.7,18.9,17.9,19.5,18.1,18.6,17.5,18.8,16.6,19.1,16.9,21.1,17,18.2,17.1,18,16.2,19.1,16.6,19.4,19,18.4,17.2,18.9,17.5,18.5,16.8,19.4,16.1,19.1,17.2,17.6,18.8,19.4,17.8,20.3,19.5,18.6,19.2,18.8,18,18.1,17.1,18.1,17.3,18.9,18.6,18.5,16.1,18.5,17.9,20,16,20,18.6,18.9,17.2,20,17,19,16.5,20.3,17.7,19.5,20.7,18.3,17,20.5,17,18.6,17.2,19.8,17,18.5,15.9,19,17.6,18.3,17.1,18,17.9,19.2,18.5,18.5,17.6,17.5,17.5,20.1,16.5,17.9,17.1,17.2,15.5,17,16.8,18.7,18.6,18.4,17.8,18.1,17.1,18.5,13.2,16.3,14.1,15.2,14.5,13.5,14.6,15.3,13.4,15.4,13.7,16.1,13.7,14.6,14.6,15.7,13.5,15.2,14.5,15.1,14.3,14.5,14.5,15.8,13.1,15.1,14.3,15,14.3,15.3,15.3,14.2,14.5,17,14.8,16.3,13.7,17.3,13.6,15.7,13.7,16,13.7,15,15.9,13.9,13.9,15.9,13.3,15.8,14.2,14.1,14.4,15,14.4,15.4,13.9,15,14.5,15.3,13.8,14.9,13.9,15.7,14.2,16.8,14.4,16.2,14.2,15,15,15.6,15.6,14.8,15,16,14.2,16.3,13.8,16.4,14.5,15.6,14.6,15.9,13.8,17.3,14.4,14.2,14,17,15,17.1,14.5,16.1,14.7,15.7,15.8,14.6,14.4,16.5,15,17,15.5,15,13.8,16.1,14.7,15.8,14,15.1,15.2,15.9,15.2,16.3,14.1,16,15.7,16.2,13.7,"NA",14.3,15.7,14.8,16.1,17.9,19.5,19.2,18.7,19.8,17.8,18.2,18.2,18.9,19.9,17.8,20.3,17.3,18.1,17.1,19.6,20,17.8,18.6,18.2,17.3,17.5,16.6,19.4,17.9,19,18.4,19,17.8,20,16.6,20.8,16.7,18.8,18.6,16.8,18.3,20.7,16.6,19.9,19.5,17.5,19.1,17,17.9,18.5,17.9,19.6,18.7,17.3,16.4,19,17.3,19.7,17.3,18.8,16.6,19.9,18.8,19.4,19.5,16.5,17,19.8,18.1,18.2,19,18.7],"flipper_length_mm":[181,186,195,"NA",193,190,181,195,193,190,186,180,182,191,198,185,195,197,184,194,174,180,189,185,180,187,183,187,172,180,178,178,188,184,195,196,190,180,181,184,182,195,186,196,185,190,182,179,190,191,186,188,190,200,187,191,186,193,181,194,185,195,185,192,184,192,195,188,190,198,190,190,196,197,190,195,191,184,187,195,189,196,187,193,191,194,190,189,189,190,202,205,185,186,187,208,190,196,178,192,192,203,183,190,193,184,199,190,181,197,198,191,193,197,191,196,188,199,189,189,187,198,176,202,186,199,191,195,191,210,190,197,193,199,187,190,191,200,185,193,193,187,188,190,192,185,190,184,195,193,187,201,211,230,210,218,215,210,211,219,209,215,214,216,214,213,210,217,210,221,209,222,218,215,213,215,215,215,216,215,210,220,222,209,207,230,220,220,213,219,208,208,208,225,210,216,222,217,210,225,213,215,210,220,210,225,217,220,208,220,208,224,208,221,214,231,219,230,214,229,220,223,216,221,221,217,216,230,209,220,215,223,212,221,212,224,212,228,218,218,212,230,218,228,212,224,214,226,216,222,203,225,219,228,215,228,216,215,210,219,208,209,216,229,213,230,217,230,217,222,214,"NA",215,222,212,213,192,196,193,188,197,198,178,197,195,198,193,194,185,201,190,201,197,181,190,195,181,191,187,193,195,197,200,200,191,205,187,201,187,203,195,199,195,210,192,205,210,187,196,196,196,201,190,212,187,198,199,201,193,203,187,197,191,203,202,194,206,189,195,207,202,193,210,198],"body_mass_g":[3750,3800,3250,"NA",3450,3650,3625,4675,3475,4250,3300,3700,3200,3800,4400,3700,3450,4500,3325,4200,3400,3600,3800,3950,3800,3800,3550,3200,3150,3950,3250,3900,3300,3900,3325,4150,3950,3550,3300,4650,3150,3900,3100,4400,3000,4600,3425,2975,3450,4150,3500,4300,3450,4050,2900,3700,3550,3800,2850,3750,3150,4400,3600,4050,2850,3950,3350,4100,3050,4450,3600,3900,3550,4150,3700,4250,3700,3900,3550,4000,3200,4700,3800,4200,3350,3550,3800,3500,3950,3600,3550,4300,3400,4450,3300,4300,3700,4350,2900,4100,3725,4725,3075,4250,2925,3550,3750,3900,3175,4775,3825,4600,3200,4275,3900,4075,2900,3775,3350,3325,3150,3500,3450,3875,3050,4000,3275,4300,3050,4000,3325,3500,3500,4475,3425,3900,3175,3975,3400,4250,3400,3475,3050,3725,3000,3650,4250,3475,3450,3750,3700,4000,4500,5700,4450,5700,5400,4550,4800,5200,4400,5150,4650,5550,4650,5850,4200,5850,4150,6300,4800,5350,5700,5000,4400,5050,5000,5100,4100,5650,4600,5550,5250,4700,5050,6050,5150,5400,4950,5250,4350,5350,3950,5700,4300,4750,5550,4900,4200,5400,5100,5300,4850,5300,4400,5000,4900,5050,4300,5000,4450,5550,4200,5300,4400,5650,4700,5700,4650,5800,4700,5550,4750,5000,5100,5200,4700,5800,4600,6000,4750,5950,4625,5450,4725,5350,4750,5600,4600,5300,4875,5550,4950,5400,4750,5650,4850,5200,4925,4875,4625,5250,4850,5600,4975,5500,4725,5500,4700,5500,4575,5500,5000,5950,4650,5500,4375,5850,4875,6000,4925,"NA",4850,5750,5200,5400,3500,3900,3650,3525,3725,3950,3250,3750,4150,3700,3800,3775,3700,4050,3575,4050,3300,3700,3450,4400,3600,3400,2900,3800,3300,4150,3400,3800,3700,4550,3200,4300,3350,4100,3600,3900,3850,4800,2700,4500,3950,3650,3550,3500,3675,4450,3400,4300,3250,3675,3325,3950,3600,4050,3350,3450,3250,4050,3800,3525,3950,3650,3650,4000,3400,3775,4100,3775],"sex":["male","female","female",null,"female","male","female","male",null,null,null,null,"female","male","male","female","female","male","female","male","female","male","female","male","male","female","male","female","female","male","female","male","female","male","female","male","male","female","female","male","female","male","female","male","female","male","male",null,"female","male","female","male","female","male","female","male","female","male","female","male","female","male","female","male","female","male","female","male","female","male","female","male","female","male","female","male","female","male","female","male","female","male","female","male","female","male","male","female","male","female","female","male","female","male","female","male","female","male","female","male","female","male","female","male","female","male","female","male","female","male","female","male","female","male","female","male","female","male","female","male","female","male","female","male","female","male","female","male","female","male","female","male","female","male","female","male","female","male","female","male","female","male","female","male","female","male","male","female","female","male","female","male","female","male","female","male","male","female","female","male","female","male","female","male","female","male","female","male","female","male","female","male","male","female","female","male","female","male",null,"male","female","male","male","female","female","male","female","male","female","male","female","male","female","male","female","male","male","female","female","male","female","male","female","male","female","male","female","male","female","male","female","male","female","male","female","male","female","male",null,"male","female","male","female","male","male","female","female","male","female","male","female","male","female","male","female","male","female","male","female","male","female","male","female","male","female","male","female","male","male","female","female","male","female","male","female","male",null,"male","female","male","female","male","female","male","female","male","female","male",null,"male","female",null,"female","male","female","male","female","male","male","female","male","female","female","male","female","male","female","male","female","male","female","male","male","female","female","male","female","male","female","male","female","male","female","male","female","male","female","male","female","male","male","female","female","male","female","male","male","female","male","female","female","male","female","male","male","female","female","male","female","male","female","male","female","male","male","female","male","female","female","male","female","male","male","female"],"year":[2007,2007,2007,2007,2007,2007,2007,2007,2007,2007,2007,2007,2007,2007,2007,2007,2007,2007,2007,2007,2007,2007,2007,2007,2007,2007,2007,2007,2007,2007,2007,2007,2007,2007,2007,2007,2007,2007,2007,2007,2007,2007,2007,2007,2007,2007,2007,2007,2007,2007,2008,2008,2008,2008,2008,2008,2008,2008,2008,2008,2008,2008,2008,2008,2008,2008,2008,2008,2008,2008,2008,2008,2008,2008,2008,2008,2008,2008,2008,2008,2008,2008,2008,2008,2008,2008,2008,2008,2008,2008,2008,2008,2008,2008,2008,2008,2008,2008,2008,2008,2009,2009,2009,2009,2009,2009,2009,2009,2009,2009,2009,2009,2009,2009,2009,2009,2009,2009,2009,2009,2009,2009,2009,2009,2009,2009,2009,2009,2009,2009,2009,2009,2009,2009,2009,2009,2009,2009,2009,2009,2009,2009,2009,2009,2009,2009,2009,2009,2009,2009,2009,2009,2007,2007,2007,2007,2007,2007,2007,2007,2007,2007,2007,2007,2007,2007,2007,2007,2007,2007,2007,2007,2007,2007,2007,2007,2007,2007,2007,2007,2007,2007,2007,2007,2007,2007,2008,2008,2008,2008,2008,2008,2008,2008,2008,2008,2008,2008,2008,2008,2008,2008,2008,2008,2008,2008,2008,2008,2008,2008,2008,2008,2008,2008,2008,2008,2008,2008,2008,2008,2008,2008,2008,2008,2008,2008,2008,2008,2008,2008,2008,2008,2009,2009,2009,2009,2009,2009,2009,2009,2009,2009,2009,2009,2009,2009,2009,2009,2009,2009,2009,2009,2009,2009,2009,2009,2009,2009,2009,2009,2009,2009,2009,2009,2009,2009,2009,2009,2009,2009,2009,2009,2009,2009,2009,2009,2007,2007,2007,2007,2007,2007,2007,2007,2007,2007,2007,2007,2007,2007,2007,2007,2007,2007,2007,2007,2007,2007,2007,2007,2007,2007,2008,2008,2008,2008,2008,2008,2008,2008,2008,2008,2008,2008,2008,2008,2008,2008,2008,2008,2009,2009,2009,2009,2009,2009,2009,2009,2009,2009,2009,2009,2009,2009,2009,2009,2009,2009,2009,2009,2009,2009,2009,2009]},"columns":[{"id":"species","name":"species","type":"factor"},{"id":"island","name":"island","type":"factor"},{"id":"bill_length_mm","name":"bill_length_mm","type":"numeric"},{"id":"bill_depth_mm","name":"bill_depth_mm","type":"numeric"},{"id":"flipper_length_mm","name":"flipper_length_mm","type":"numeric"},{"id":"body_mass_g","name":"body_mass_g","type":"numeric"},{"id":"sex","name":"sex","type":"factor"},{"id":"year","name":"year","type":"numeric"}],"searchable":true,"dataKey":"11790aed9ef42782f25c128b3443ce46"},"children":[]},"class":"reactR_markup"},"evals":[],"jsHooks":[]}</script> ```` * `quarto render` automatically bundles widget dependencies into `docs/` * Works for: `reactable`, `plotly`, `leaflet`, `mapview`, `DT`, and more * Self-contained per post — just push `docs/` as usual ```` docs/ ├── index.html └── posts/ └── my-post/ └── index.html ← widget dependencies bundled in here ```` --- # Embedding Widgets: Flexdashboard In a flexdashboard, widgets also embed **inline by default** when knitting: ````r ### My Interactive Table ``` r library(reactable) reactable(penguins, searchable = TRUE, filterable = TRUE) ``` ```` * No `saveWidget()` needed — knitting produces one self-contained HTML * Works for all htmlwidgets: `plotly`, `leaflet`, `reactable`, `DT`, etc. * For Shiny-powered widgets, add `runtime: shiny` to YAML and deploy to shinyapps.io instead --- # The Exception: Xaringan Slides Xaringan does **not** support HTML widgets natively — widgets render blank: ````r # This will NOT show in xaringan slides reactable(penguins) ```` The fix — save each widget and embed via `<iframe>`: ````r # Save widget to file saveWidget(reactable(penguins), "widgets/rt_basic.html", selfcontained = TRUE) ```` Then in the slide: ````html <iframe src="widgets/rt_basic.html" width="100%" height="450px" frameborder="0"></iframe> ```` Commit the `widgets/` folder alongside your slides HTML — they must travel together. --- # Which Option Should You Use? | Situation | Approach | |---|---| | Quarto blog post | Use widget directly — Quarto handles it | | Flexdashboard | Use widget directly — embeds on knit | | Xaringan slides | `saveWidget()` + `<iframe>` + commit `widgets/` | | Small data, want simplicity | `self_contained: true` in YAML | | Medium data, reused across posts | Commit `data/` folder | | Sensitive or large data | Remote source + `.gitignore` | --- class: inverse-blue # Data Viz in the wild Cheyna and Ramtin * Kyla and Isha on deck for next week --- class: inverse-blue center middle # Geographic data --- # First — a disclaimer * We're *only* talking about **visualizing** geographic data, not analyzing it -- * There's SO MUCH we won't get to -- * Today is an intro — hopefully you'll feel comfortable with the basics --- # Learning objectives * Know the difference between vector and raster data * Be able to produce basic maps using a variety of tools * Be able to obtain different types of geographic data from a few different places * Be able to produce basic interactive maps * Understand the basics of the R geospatial ecosystem -- ### Today is partially about content and partially about exposure --- # Where to learn more ### [Geocomputation with R](https://geocompr.robinlovelace.net) .center[ <img src="https://geocompr.robinlovelace.net/images/cover.png" width = "260px"> ] --- class: inverse-orange center middle  # Vector versus raster data .footnote[Image from Zev Ross] --- # Vector data * Points, lines, and polygons * Can easily include non-spatial attributes (e.g., population within a polygon) -- * Come in the form of shapefiles (`.shp`), GeoJSON, or frequently in R packages -- ### This is what we'll focus on today Tends to be most relevant for social science research questions --- # Raster data .pull-left[ * Divides space into a grid * Each square (pixel) gets a value ] .pull-right[  ] -- Common formats include images, satellite data, and remote sensing data. -- Can be useful in social science to show things like population density or temperature grids. --- # Example  .footnote[[source](https://www.nytimes.com/interactive/2021/02/16/us/winter-storm-texas-power-outage-map.html)] --- # The #rspatial ecosystem * [{sf}](https://r-spatial.github.io/sf/index.html) — simple features, the standard for vector data * [{terra}](https://rspatial.org/terra/) — modern replacement for {raster} * [{ggplot2}](https://ggplot2.tidyverse.org) — `geom_sf()` for plotting sf objects * [{tmap}](https://github.com/mtennekes/tmap) — thematic map package * [{mapview}](https://r-spatial.github.io/mapview/index.html) — quick interactive maps -- ### Goal today Take you through a basic tour of each of these. --- # Some specific challenges with geospatial data * Coordinate reference systems and projections * List columns (specifically when working with {sf} objects) * Different geometry types (lines, points, polygons) * Vector versus raster --- # Working with spatial data Two main options: * `spatialDataFrame` (from the [{sp}](https://cran.r-project.org/web/packages/sp/sp.pdf) package) — older, less common now * **sf data frame** (simple features) — the modern standard, works natively with tidyverse Use `sf::st_as_sf()` to convert `{sp}` to `{sf}` if needed. --- # {tigris} ``` r library(tigris) library(sf) *options(tigris_class = "sf") roads_laneco <- roads("OR", "Lane") roads_laneco ``` ``` ## Simple feature collection with 20433 features and 4 fields ## Geometry type: LINESTRING ## Dimension: XY ## Bounding box: xmin: -124.1536 ymin: 43.4376 xmax: -121.8078 ymax: 44.29001 ## Geodetic CRS: NAD83 ## # A tibble: 20,433 × 5 ## LINEARID FULLNAME RTTYP MTFCC geometry ## <chr> <chr> <chr> <chr> <LINESTRING [°]> ## 1 1102152610459 W Lone Oak Lp M S1640 (-123.1256 44.10108, -123.1262 44.10109, -123.1263 44.1011, -123.1263 44.10112, -123.1... ## 2 1102217699747 Sheldon Village Lp M S1640 (-123.0742 44.07891, -123.073 44.07891, -123.0729 44.0789, -123.0729 44.0788, -123.072... ## 3 110458663505 Cottage Hts Lp M S1400 (-123.0522 43.7893, -123.0522 43.7894, -123.0521 43.78949, -123.0521 43.7895, -123.052... ## 4 1102152615811 Village Plz Lp M S1640 (-123.1051 44.08716, -123.1058 44.08736, -123.1063 44.08755, -123.1068 44.08778) ## 5 110458661289 River Pointe Lp M S1400 (-123.0864 44.10306, -123.0852 44.10305, -123.0851 44.10305, -123.085 44.10303, -123.0... ## 6 1102217699746 Sheldon Village Lp M S1640 (-123.0723 44.07875, -123.0723 44.07904, -123.0723 44.07937, -123.0723 44.07941, -123.... ## 7 110458664549 Village Plz Lp M S1400 (-123.1053 44.08658, -123.1052 44.08687, -123.1052 44.08698, -123.1051 44.08716, -123.... ## 8 1102223141058 Carpenter Byp M S1400 (-123.3368 43.78013, -123.3367 43.78008) ## 9 1106092829172 State Hwy 126 Bus S S1200 (-123.0502 44.04391, -123.0502 44.04396, -123.0515 44.0439, -123.0521 44.04388, -123.0... ## 10 1104493105112 State Hwy 126 Bus S S1200 (-122.996 44.04587, -122.9959 44.04586, -122.9957 44.04586, -122.9957 44.04586, -122.9... ## # ℹ 20,423 more rows ``` --- # I/O Write to disk: ``` r write_sf(roads_laneco, here::here("data", "roads_lane.shp")) ``` -- Read back in: ``` r roads_laneco <- read_sf(here::here("data", "roads_lane.shp")) ``` --- # {sf} works with ggplot Use `ggplot2::geom_sf()` ``` r ggplot(roads_laneco) + geom_sf(color = "gray60") ``` <!-- --> --- # Add water features ``` r lakes <- area_water("OR", "Lane") streams <- linear_water("OR", "Lane") ggplot() + geom_sf(data = lakes, fill = "#518FB5") + geom_sf(data = streams, color = "#518FB5") + geom_sf(data = roads_laneco, color = "gray60") ``` Note — these functions are all from [{tigris}](https://github.com/walkerke/tigris). --- <!-- --> --- # Quick aside: `osmdata` * Specifically for street-level data from OpenStreetMap ``` r bb <- osmdata::getbb("Eugene") bb ``` ``` ## min max ## x -123.20876 -123.03059 ## y 43.98753 44.13232 ``` --- ``` r ggplot() + geom_sf(data = lakes, fill = "#518FB5") + geom_sf(data = streams, color = "#518FB5", linewidth = 1.2) + geom_sf(data = roads_laneco, color = "gray60") + coord_sf(xlim = bb[1, ], ylim = bb[2, ]) ``` --- class: center middle <!-- --> --- # Fully with osmdata ``` r library(osmdata) library(colorspace) bb <- getbb("Eugene") roads <- bb %>% opq() %>% add_osm_feature("highway") %>% osmdata_sf() water <- bb %>% opq() %>% add_osm_feature("water") %>% osmdata_sf() ``` --- # Plot with osmdata ``` r ggplot() + geom_sf(data = water$osm_multipolygons, fill = "#518FB5", color = darken("#518FB5")) + geom_sf(data = water$osm_polygons, fill = "#518FB5", color = darken("#518FB5")) + geom_sf(data = water$osm_lines, color = darken("#518FB5")) + geom_sf(data = roads$osm_lines, color = "gray40", linewidth = 0.2) + coord_sf(xlim = bb[1, ], ylim = bb[2, ], expand = FALSE) + labs(caption = "Eugene, OR") ``` --- class: center <!-- --> --- # Getting census data with {tidycensus} ### Note You need a Census API key — register at [api.census.gov/data/key_signup.html](https://api.census.gov/data/key_signup.html) Then set it with: ``` r library(tidycensus) census_api_key("YOUR API KEY", install = TRUE) ``` Or add `CENSUS_API_KEY = "YOUR KEY"` to `.Renviron` via `usethis::edit_r_environ()` --- # Getting the data ``` r library(tidycensus) # Find variable code: # v <- load_variables(2022, "acs5"); View(v) census_vals <- get_acs( geography = "tract", state = "OR", variables = c(med_income = "B06011_001", ed_attain = "B15003_001"), year = 2022, geometry = TRUE ) ``` ``` ## | | | 0% | |=== | 2% | |===== | 3% | |======= | 5% | |=========== | 7% | |============= | 9% | |============== | 9% | |================ | 11% | |================== | 12% | |==================== | 13% | |====================== | 15% | |======================= | 15% | |========================= | 17% | |=========================== | 18% | |============================= | 19% | |=============================== | 20% | |================================= | 22% | |=================================== | 23% | |===================================== | 25% | |======================================== | 26% | |========================================== | 27% | |============================================ | 29% | |============================================== | 30% | |================================================ | 32% | |================================================== | 33% | |===================================================== | 35% | |======================================================= | 36% | |========================================================= | 37% | |=========================================================== | 39% | |============================================================= | 40% | |=============================================================== | 42% | |================================================================= | 43% | |==================================================================== | 45% | |====================================================================== | 46% | |======================================================================== | 47% | |========================================================================== | 49% | |============================================================================ | 50% | |============================================================================== | 52% | |================================================================================= | 53% | |=================================================================================== | 54% | |===================================================================================== | 56% | |======================================================================================= | 57% | |========================================================================================= | 59% | |=========================================================================================== | 60% | |============================================================================================== | 62% | |================================================================================================ | 63% | |================================================================================================== | 64% | |==================================================================================================== | 66% | |====================================================================================================== | 67% | |======================================================================================================== | 69% | |=========================================================================================================== | 70% | |============================================================================================================= | 72% | |=============================================================================================================== | 73% | |================================================================================================================= | 74% | |=================================================================================================================== | 76% | |===================================================================================================================== | 77% | |======================================================================================================================== | 79% | |========================================================================================================================== | 80% | |============================================================================================================================ | 81% | |============================================================================================================================== | 83% | |================================================================================================================================ | 84% | |================================================================================================================================== | 86% | |==================================================================================================================================== | 87% | |======================================================================================================================================= | 89% | |========================================================================================================================================= | 90% | |=========================================================================================================================================== | 91% | |============================================================================================================================================= | 93% | |=============================================================================================================================================== | 94% | |================================================================================================================================================= | 96% | |==================================================================================================================================================== | 97% | |====================================================================================================================================================== | 99% | |========================================================================================================================================================| 100% ``` --- # Look at the data ``` r census_vals ``` ``` ## Simple feature collection with 2002 features and 5 fields (with 14 geometries empty) ## Geometry type: MULTIPOLYGON ## Dimension: XY ## Bounding box: xmin: -124.5662 ymin: 41.99179 xmax: -116.4635 ymax: 46.29083 ## Geodetic CRS: NAD83 ## First 10 features: ## GEOID NAME variable estimate moe geometry ## 1 41001950100 Census Tract 9501; Baker County; Oregon med_income 30087 7312 MULTIPOLYGON (((-118.5194 4... ## 2 41001950100 Census Tract 9501; Baker County; Oregon ed_attain 2138 199 MULTIPOLYGON (((-118.5194 4... ## 3 41067031912 Census Tract 319.12; Washington County; Oregon med_income 66173 10025 MULTIPOLYGON (((-122.8003 4... ## 4 41067031912 Census Tract 319.12; Washington County; Oregon ed_attain 3031 448 MULTIPOLYGON (((-122.8003 4... ## 5 41067031100 Census Tract 311; Washington County; Oregon med_income 33125 4389 MULTIPOLYGON (((-122.8058 4... ## 6 41067031100 Census Tract 311; Washington County; Oregon ed_attain 2239 312 MULTIPOLYGON (((-122.8058 4... ## 7 41003010300 Census Tract 103; Benton County; Oregon med_income 39126 2752 MULTIPOLYGON (((-123.8167 4... ## 8 41003010300 Census Tract 103; Benton County; Oregon ed_attain 2690 343 MULTIPOLYGON (((-123.8167 4... ## 9 41029002600 Census Tract 26; Jackson County; Oregon med_income 30905 4519 MULTIPOLYGON (((-122.7616 4... ## 10 41029002600 Census Tract 26; Jackson County; Oregon ed_attain 2047 206 MULTIPOLYGON (((-122.7616 4... ``` --- # Remove missing geometry rows ``` r census_vals <- census_vals[!st_is_empty(census_vals$geometry), , drop = FALSE] ``` --- # Plot it ``` r library(colorspace) ggplot(census_vals) + geom_sf(aes(fill = estimate, color = estimate)) + facet_wrap(~variable) + guides(color = "none") + scale_fill_continuous_diverging("Blue-Red 3", rev = TRUE) + scale_color_continuous_diverging("Blue-Red 3", rev = TRUE) ``` --- # Hmm... <!-- --> --- # Try again — set midpoint ``` r income <- filter(census_vals, variable == "med_income") income_plot <- ggplot(income) + geom_sf(aes(fill = estimate, color = estimate)) + facet_wrap(~variable) + guides(color = "none") + scale_fill_continuous_diverging( "Blue-Red 3", rev = TRUE, * mid = mean(income$estimate, na.rm = TRUE) ) + scale_color_continuous_diverging( "Blue-Red 3", rev = TRUE, * mid = mean(income$estimate, na.rm = TRUE) ) + theme(legend.position = "bottom", legend.key.width = unit(2, "cm")) ``` --- ``` r income_plot ``` <!-- --> --- # Same thing for education ``` r ed <- filter(census_vals, variable == "ed_attain") ed_plot <- ggplot(ed) + geom_sf(aes(fill = estimate, color = estimate)) + facet_wrap(~variable) + guides(color = "none") + scale_fill_continuous_diverging( "Blue-Red 3", rev = TRUE, mid = mean(ed$estimate, na.rm = TRUE) ) + scale_color_continuous_diverging( "Blue-Red 3", rev = TRUE, mid = mean(ed$estimate, na.rm = TRUE) ) + theme(legend.position = "bottom", legend.key.width = unit(2, "cm")) ``` --- ``` r ed_plot ``` <!-- --> --- # Put them together ``` r gridExtra::grid.arrange(income_plot, ed_plot, ncol = 2) ``` <!-- --> --- class: inverse-blue middle # Bivariate color scales --- background-image: url(https://timogrossenbacher.ch/wp-content/uploads/2019/04/bm-thematic-bivariate-map-with-legend-1-2.png) background-size: cover --- # How? * Break continuous variables into categorical (quartile) bins * Assign each combination of bins a color * Make sure the color combinations are perceptually meaningful --  .footnote[gif from [Joshua Stevens](https://www.joshuastevens.net/cartography/make-a-bivariate-choropleth-map/)] --- # Move to wide format ``` r wider <- get_acs( geography = "tract", state = "OR", variables = c(med_income = "B06011_001", ed_attain = "B15003_001"), year = 2022, geometry = TRUE, * output = "wide" ) wider <- wider[!st_is_empty(wider$geometry), , drop = FALSE] ``` --- # Find quartiles ``` r ed_quartiles <- quantile( wider$ed_attainE, probs = seq(0, 1, length.out = 4), na.rm = TRUE ) inc_quartiles <- quantile( wider$med_incomeE, probs = seq(0, 1, length.out = 4), na.rm = TRUE ) ``` --- # Create cut variable ``` r wider <- wider %>% mutate(cat_ed = cut(ed_attainE, ed_quartiles), cat_inc = cut(med_incomeE, inc_quartiles)) wider %>% select(starts_with("cat")) ``` ``` ## Simple feature collection with 994 features and 2 fields ## Geometry type: MULTIPOLYGON ## Dimension: XY ## Bounding box: xmin: -124.5662 ymin: 41.99179 xmax: -116.4635 ymax: 46.29083 ## Geodetic CRS: NAD83 ## First 10 features: ## cat_ed cat_inc geometry ## 1 (0,2.45e+03] (6.53e+03,3.34e+04] MULTIPOLYGON (((-118.5194 4... ## 2 (2.45e+03,3.42e+03] (4.26e+04,1.07e+05] MULTIPOLYGON (((-122.8003 4... ## 3 (0,2.45e+03] (6.53e+03,3.34e+04] MULTIPOLYGON (((-122.8058 4... ## 4 (2.45e+03,3.42e+03] (3.34e+04,4.26e+04] MULTIPOLYGON (((-123.8167 4... ## 5 (0,2.45e+03] (6.53e+03,3.34e+04] MULTIPOLYGON (((-122.7616 4... ## 6 (0,2.45e+03] (6.53e+03,3.34e+04] MULTIPOLYGON (((-122.8811 4... ## 7 (2.45e+03,3.42e+03] (3.34e+04,4.26e+04] MULTIPOLYGON (((-122.8458 4... ## 8 (2.45e+03,3.42e+03] (6.53e+03,3.34e+04] MULTIPOLYGON (((-117.0657 4... ## 9 (3.42e+03,6.64e+03] (3.34e+04,4.26e+04] MULTIPOLYGON (((-123.0464 4... ## 10 (3.42e+03,6.64e+03] (3.34e+04,4.26e+04] MULTIPOLYGON (((-122.906 44... ``` --- # Set palette ``` r pal <- st_drop_geometry(wider) %>% count(cat_ed, cat_inc) %>% arrange(cat_ed, cat_inc) %>% drop_na(cat_ed, cat_inc) %>% mutate(pal = c("#F3F3F3", "#C3F1D5", "#8BE3AF", "#EBC5DD", "#C3C5D5", "#8BC5AF", "#E7A3D1", "#C3A3D1", "#8BA3AE")) pal ``` ``` ## cat_ed cat_inc n pal ## 1 (0,2.45e+03] (6.53e+03,3.34e+04] 141 #F3F3F3 ## 2 (0,2.45e+03] (3.34e+04,4.26e+04] 87 #C3F1D5 ## 3 (0,2.45e+03] (4.26e+04,1.07e+05] 100 #8BE3AF ## 4 (2.45e+03,3.42e+03] (6.53e+03,3.34e+04] 114 #EBC5DD ## 5 (2.45e+03,3.42e+03] (3.34e+04,4.26e+04] 110 #C3C5D5 ## 6 (2.45e+03,3.42e+03] (4.26e+04,1.07e+05] 107 #8BC5AF ## 7 (3.42e+03,6.64e+03] (6.53e+03,3.34e+04] 75 #E7A3D1 ## 8 (3.42e+03,6.64e+03] (3.34e+04,4.26e+04] 133 #C3A3D1 ## 9 (3.42e+03,6.64e+03] (4.26e+04,1.07e+05] 123 #8BA3AE ``` --- # Join and plot ``` r bivar_map <- left_join(wider, pal) %>% ggplot() + geom_sf(aes(fill = pal, color = pal)) + guides(fill = "none", color = "none") + scale_fill_identity() + scale_color_identity() ``` --- class: center middle <!-- --> --- # Add a legend ``` r leg <- ggplot(pal, aes(cat_ed, cat_inc)) + geom_tile(aes(fill = pal)) + scale_fill_identity() + coord_fixed() + labs(x = expression("Higher education" %->% ""), y = expression("Higher income" %->% "")) + theme(axis.text = element_blank(), axis.title = element_text(size = 12)) leg ``` <!-- --> --- # Put together ``` r library(cowplot) ggdraw() + draw_plot(bivar_map + theme_void(), 0.1, 0.1, 1, 1) + draw_plot(leg, -0.05, 0, 0.3, 0.3) ``` Coordinates are mostly guess/check depending on aspect ratio. --- 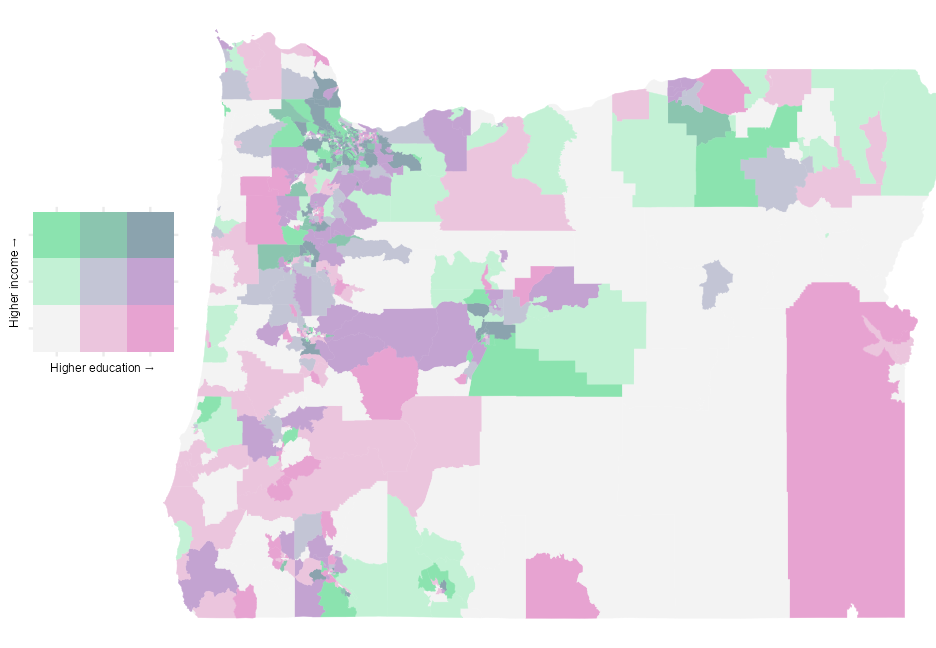<!-- --> --- class: inverse-orange middle # {tmap} ### Back to just one variable I mostly use `ggplot()`, but {tmap} is really powerful and has a clean syntax. --- # Education map with [{tmap}](https://cran.r-project.org/web/packages/tmap/vignettes/tmap-getstarted.html) ``` r library(tmap) tm_shape(wider) + tm_polygons("ed_attainE") + tm_layout(legend.outside = TRUE) ``` 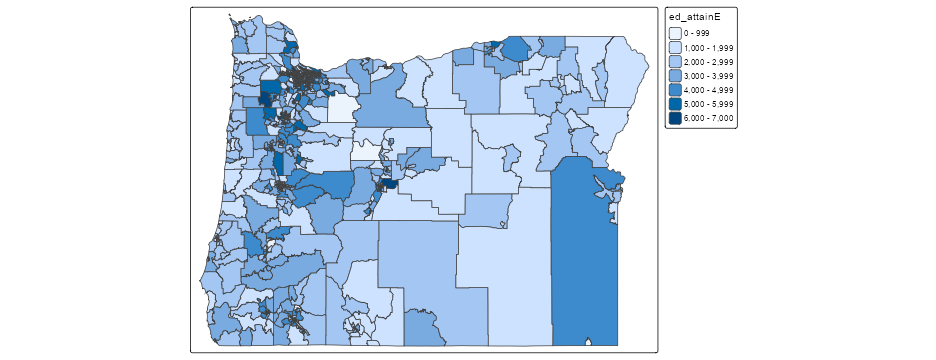<!-- --> --- # Facet ``` r tm_shape(census_vals) + tm_polygons("estimate") + tm_facets("variable") + tm_layout(legend.outside = TRUE) ``` 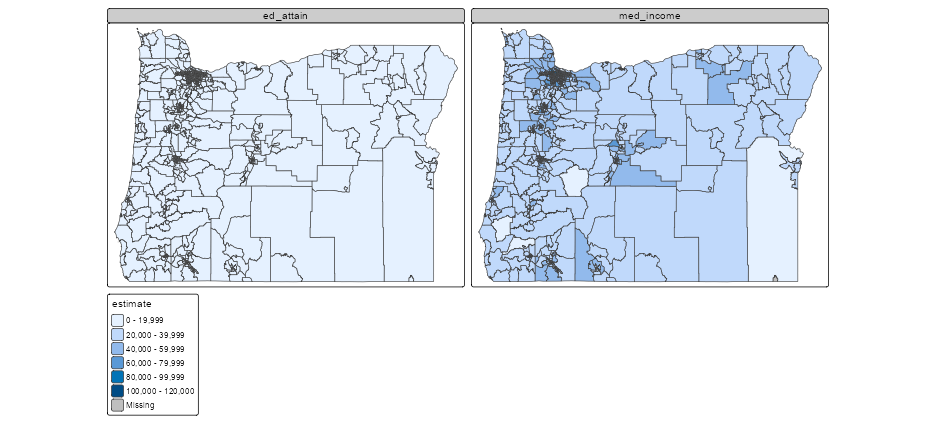<!-- --> --- # Change colors ``` r tm_shape(wider) + tm_polygons("ed_attainE", * palette = "magma", * border.col = "gray90", * lwd = 0.1) + tm_layout(legend.outside = TRUE) ``` 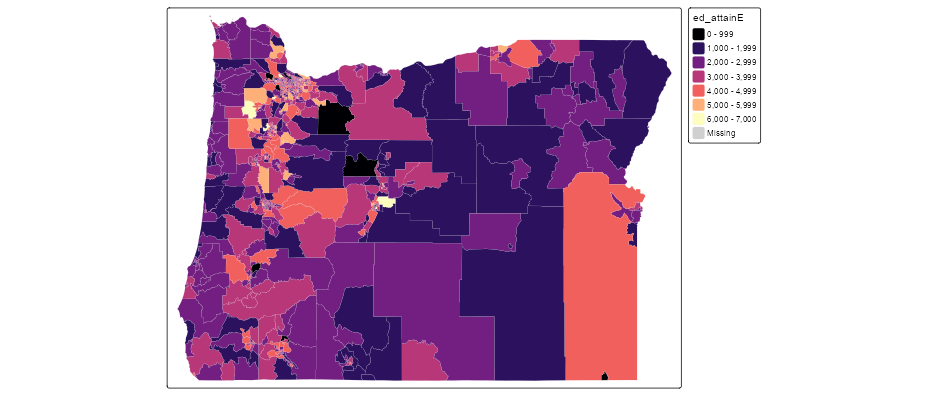<!-- --> --- # Continuous legend ``` r tm_shape(wider) + tm_polygons("ed_attainE", style = "cont") + tm_layout(legend.outside = TRUE) ``` 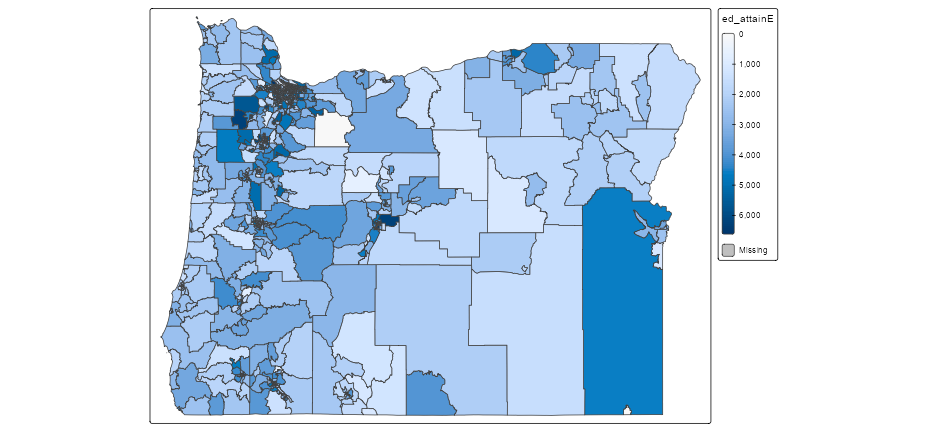<!-- --> --- # Add text labels ``` r cnty <- get_acs( geography = "county", state = "OR", variables = c(ed_attain = "B15003_001"), year = 2022, geometry = TRUE ) ``` ``` ## | | | 0% | |= | 0% | |= | 1% | |== | 1% | |== | 2% | |=== | 2% | |==== | 2% | |==== | 3% | |===== | 3% | |===== | 4% | |====== | 4% | |======= | 4% | |======= | 5% | |======== | 5% | |========= | 6% | |========== | 6% | |========== | 7% | |=========== | 7% | |============ | 8% | |============= | 8% | |============= | 9% | |============== | 9% | |=============== | 10% | |================ | 10% | |================ | 11% | |================= | 11% | |================= | 12% | |================== | 12% | |=================== | 12% | |=================== | 13% | |==================== | 13% | |===================== | 14% | |====================== | 14% | |====================== | 15% | |======================= | 15% | |======================== | 16% | |========================= | 16% | |========================= | 17% | |========================== | 17% | |=========================== | 18% | |============================ | 18% | |============================ | 19% | |============================= | 19% | |============================== | 20% | |=============================== | 20% | |=============================== | 21% | |================================ | 21% | |================================= | 21% | |================================= | 22% | |================================== | 22% | |================================== | 23% | |=================================== | 23% | |==================================== | 23% | |==================================== | 24% | |===================================== | 24% | |===================================== | 25% | |====================================== | 25% | |======================================= | 25% | |======================================= | 26% | |======================================== | 26% | |======================================== | 27% | |========================================= | 27% | |========================================== | 27% | |========================================== | 28% | |=========================================== | 28% | |============================================ | 29% | |============================================= | 29% | |============================================= | 30% | |============================================== | 30% | |=============================================== | 31% | |================================================ | 31% | |================================================ | 32% | |================================================= | 32% | |================================================== | 33% | |=================================================== | 33% | |=================================================== | 34% | |==================================================== | 34% | |==================================================== | 35% | |===================================================== | 35% | |====================================================== | 35% | |====================================================== | 36% | |======================================================= | 36% | |======================================================== | 37% | |========================================================= | 37% | |========================================================= | 38% | |========================================================== | 38% | |=========================================================== | 39% | |============================================================ | 39% | |============================================================ | 40% | |============================================================= | 40% | |============================================================== | 41% | |=============================================================== | 41% | |=============================================================== | 42% | |================================================================ | 42% | |================================================================= | 43% | |================================================================== | 43% | |================================================================== | 44% | |=================================================================== | 44% | |==================================================================== | 45% | |===================================================================== | 45% | |===================================================================== | 46% | |====================================================================== | 46% | |======================================================================= | 46% | |======================================================================= | 47% | |======================================================================== | 47% | |======================================================================== | 48% | |========================================================================= | 48% | |========================================================================== | 48% | |========================================================================== | 49% | |=========================================================================== | 49% | |=========================================================================== | 50% | |============================================================================ | 50% | |============================================================================= | 50% | |============================================================================= | 51% | |============================================================================== | 51% | |============================================================================== | 52% | |=============================================================================== | 52% | |================================================================================ | 52% | |================================================================================ | 53% | |================================================================================= | 53% | |================================================================================== | 54% | |=================================================================================== | 54% | |=================================================================================== | 55% | |==================================================================================== | 55% | |==================================================================================== | 56% | |===================================================================================== | 56% | |====================================================================================== | 56% | |====================================================================================== | 57% | |======================================================================================= | 57% | |======================================================================================= | 58% | |======================================================================================== | 58% | |========================================================================================= | 58% | |========================================================================================= | 59% | |========================================================================================== | 59% | |========================================================================================== | 60% | |=========================================================================================== | 60% | |============================================================================================ | 60% | |============================================================================================ | 61% | |============================================================================================= | 61% | |============================================================================================== | 62% | |=============================================================================================== | 62% | |=============================================================================================== | 63% | |================================================================================================ | 63% | |================================================================================================= | 64% | |================================================================================================== | 64% | |================================================================================================== | 65% | |=================================================================================================== | 65% | |==================================================================================================== | 66% | |===================================================================================================== | 66% | |===================================================================================================== | 67% | |====================================================================================================== | 67% | |======================================================================================================= | 68% | |======================================================================================================== | 68% | |======================================================================================================== | 69% | |========================================================================================================= | 69% | |========================================================================================================== | 69% | |========================================================================================================== | 70% | |=========================================================================================================== | 70% | |=========================================================================================================== | 71% | |============================================================================================================ | 71% | |============================================================================================================= | 71% | |============================================================================================================= | 72% | |============================================================================================================== | 72% | |============================================================================================================== | 73% | |=============================================================================================================== | 73% | |================================================================================================================ | 73% | |================================================================================================================ | 74% | |================================================================================================================= | 74% | |================================================================================================================= | 75% | |================================================================================================================== | 75% | |=================================================================================================================== | 75% | |=================================================================================================================== | 76% | |==================================================================================================================== | 76% | |==================================================================================================================== | 77% | |===================================================================================================================== | 77% | |====================================================================================================================== | 77% | |====================================================================================================================== | 78% | |======================================================================================================================= | 78% | |======================================================================================================================= | 79% | |======================================================================================================================== | 79% | |========================================================================================================================= | 79% | |========================================================================================================================= | 80% | |========================================================================================================================== | 80% | |========================================================================================================================== | 81% | |=========================================================================================================================== | 81% | |============================================================================================================================ | 81% | |============================================================================================================================ | 82% | |============================================================================================================================= | 82% | |============================================================================================================================= | 83% | |============================================================================================================================== | 83% | |=============================================================================================================================== | 83% | |=============================================================================================================================== | 84% | |================================================================================================================================ | 84% | |================================================================================================================================ | 85% | |================================================================================================================================= | 85% | |================================================================================================================================== | 85% | |================================================================================================================================== | 86% | |=================================================================================================================================== | 86% | |==================================================================================================================================== | 87% | |===================================================================================================================================== | 87% | |===================================================================================================================================== | 88% | |====================================================================================================================================== | 88% | |======================================================================================================================================= | 89% | |======================================================================================================================================== | 89% | |======================================================================================================================================== | 90% | |========================================================================================================================================= | 90% | |========================================================================================================================================== | 91% | |=========================================================================================================================================== | 91% | |=========================================================================================================================================== | 92% | |============================================================================================================================================ | 92% | |============================================================================================================================================= | 93% | |============================================================================================================================================== | 93% | |============================================================================================================================================== | 94% | |=============================================================================================================================================== | 94% | |================================================================================================================================================ | 94% | |================================================================================================================================================ | 95% | |================================================================================================================================================= | 95% | |================================================================================================================================================= | 96% | |================================================================================================================================================== | 96% | |=================================================================================================================================================== | 96% | |=================================================================================================================================================== | 97% | |==================================================================================================================================================== | 97% | |==================================================================================================================================================== | 98% | |===================================================================================================================================================== | 98% | |====================================================================================================================================================== | 98% | |====================================================================================================================================================== | 99% | |======================================================================================================================================================= | 99% | |======================================================================================================================================================= | 100% | |========================================================================================================================================================| 100% ``` --- # Estimate polygon centroid ``` r centroids <- st_centroid(cnty) ``` -- ``` r centroids <- centroids %>% mutate(county = str_replace_all(NAME, " County, Oregon", "")) ``` --- # Plot with labels ``` r tm_shape(cnty) + tm_polygons("estimate", style = "cont") + tm_shape(centroids) + tm_text("county", size = 0.5) + tm_layout(legend.outside = TRUE) ``` 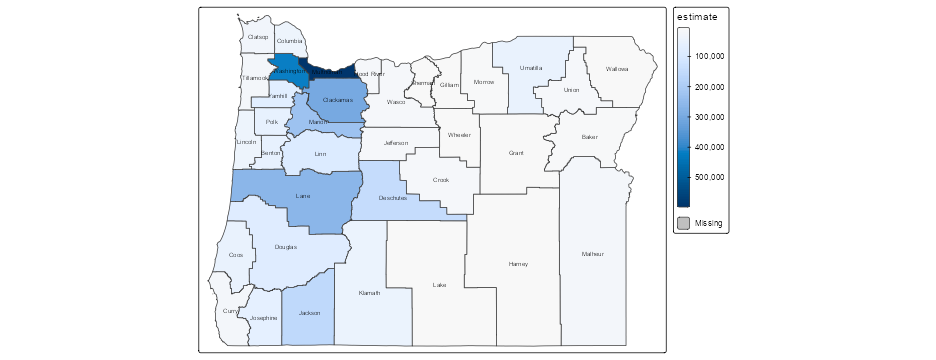<!-- --> --- # Create interactive maps Just run `tmap_mode("view")` then reuse the same code: ``` r tmap_mode("view") tm_shape(cnty) + tm_polygons("estimate") + tm_shape(centroids) + tm_text("county", size = 0.5) ``` --- <style>#legend01 { background: #FFFFFF; opacity: 1}</style> <div class="leaflet html-widget html-fill-item" id="htmlwidget-3f03eae3f7292ab5c518" style="width:936px;height:504px;"></div> <script type="application/json" data-for="htmlwidget-3f03eae3f7292ab5c518">{"x":{"options":{"crs":{"crsClass":"L.CRS.EPSG3857","code":null,"proj4def":null,"projectedBounds":null,"options":{}},"attributionControl":true},"calls":[{"method":"createMapPane","args":["tmap401",401]},{"method":"createMapPane","args":["tmap402",402]},{"method":"addLayersControl","args":[["Esri.WorldGrayCanvas","OpenStreetMap","Esri.WorldTopoMap"],["cnty","centroids"],{"collapsed":true,"autoZIndex":true,"position":"topleft"}]},{"method":"addProviderTiles","args":["Esri.WorldGrayCanvas",null,"Esri.WorldGrayCanvas",{"minZoom":0,"maxZoom":18,"maxNativeZoom":17,"tileSize":256,"subdomains":"abc","errorTileUrl":"","tms":false,"noWrap":false,"zoomOffset":0,"zoomReverse":false,"opacity":1,"zIndex":1,"detectRetina":false,"pane":"tilePane"}]},{"method":"addProviderTiles","args":["OpenStreetMap",null,"OpenStreetMap",{"minZoom":0,"maxZoom":18,"maxNativeZoom":17,"tileSize":256,"subdomains":"abc","errorTileUrl":"","tms":false,"noWrap":false,"zoomOffset":0,"zoomReverse":false,"opacity":1,"zIndex":1,"detectRetina":false,"pane":"tilePane"}]},{"method":"addProviderTiles","args":["Esri.WorldTopoMap",null,"Esri.WorldTopoMap",{"minZoom":0,"maxZoom":18,"maxNativeZoom":17,"tileSize":256,"subdomains":"abc","errorTileUrl":"","tms":false,"noWrap":false,"zoomOffset":0,"zoomReverse":false,"opacity":1,"zIndex":1,"detectRetina":false,"pane":"tilePane"}]},{"method":"addPolygons","args":[[[[{"lng":[-124.041983,-124.038842,-124.036998,-124.037333,-124.036177,-124.037047,-124.035796,-124.036828,-124.035718,-124.032309,-124.030212,-124.028557,-124.026168,-124.02306,-124.021521,-124.02036,-124.017488,-124.016251,-124.013345,-124.013057,-124.011666,-124.009651,-124.00863,-124.008668,-124.009216,-124.010968,-124.012825,-124.009457,-124.009174,-124.009677,-124.011005,-124.011699,-124.013664,-124.014611,-124.014517,-124.013606,-124.012236,-124.010703,-124.008608,-124.002891,-124.002003,-124.001625,-124.001851,-124.003591,-124.004475,-124.003935,-124.003052,-124.001535,-124.001159,-124.001334,-124.005436,-124.005753,-124.005121,-124.002827,-124.002402,-124.001225,-124.001127,-124.002893,-124.002819,-124.001629,-124.00144,-124.002248,-124.003139,-124.004173,-124.005541,-124.006863,-124.009244,-124.011544,-124.010456,-124.008695,-124.005475,-124.001195,-123.99878,-123.997493,-123.995531,-123.993419,-123.990256,-123.988482,-123.986415,-123.981442,-123.978035,-123.972758,-123.969199,-123.967916,-123.964007,-123.961176,-123.958133,-123.952541,-123.949711,-123.947539,-123.945943,-123.941841,-123.938921,-123.93669,-123.934826,-123.932984,-123.929368,-123.928109,-123.92617,-123.923228,-123.919321,-123.917355,-123.915768,-123.913158,-123.910798,-123.908023,-123.904993,-123.902759,-123.900611,-123.897998,-123.89549,-123.894213,-123.890657,-123.888662,-123.885746,-123.886257,-123.884898,-123.885552,-123.884731,-123.879821,-123.880309,-123.875256,-123.876929,-123.876055,-123.878426,-123.879224,-123.878488,-123.875677,-123.875902,-123.874554,-123.875128,-123.87338,-123.872161,-123.870714,-123.871196,-123.868406,-123.865843,-123.865356,-123.863521,-123.861708,-123.854798,-123.855219,-123.856672,-123.859311,-123.860844,-123.859671,-123.860305,-123.858754,-123.857235,-123.855639,-123.853474,-123.853456,-123.850036,-123.850134,-123.849517,-123.850178,-123.849663,-123.846549,-123.841223,-123.840861,-123.835668,-123.830315,-123.830469,-123.82926,-123.829275,-123.828393,-123.828618,-123.827067,-123.824234,-123.821583,-123.82086,-123.819403,-123.818972,-123.81985,-123.821526,-123.824264,-123.828568,-123.831689,-123.831264,-123.779962,-123.774581,-123.773716,-123.773833,-123.772341,-123.770488,-123.768483,-123.769127,-123.766875,-123.765268,-123.764535,-123.762886,-123.761074,-123.760665,-123.759135,-123.758186,-123.757263,-123.754795,-123.756231,-123.75543,-123.7545,-123.749533,-123.747579,-123.744373,-123.741852,-123.739398,-123.737502,-123.737944,-123.736506,-123.735183,-123.735421,-123.734322,-123.733021,-123.730022,-123.729321,-123.727794,-123.725276,-123.72218,-123.720119,-123.72034,-123.718719,-123.716492,-123.716505,-123.701384,-123.696843,-123.697,-123.687089,-123.687082,-123.677206,-123.677275,-123.581699,-123.581862,-123.571814,-123.571728,-123.566777,-123.567036,-123.562086,-123.562168,-123.542433,-123.542539,-123.523444,-123.494414,-123.494304,-123.484693,-123.465261,-123.465271,-123.455304,-123.455213,-123.445456,-123.444922,-123.431052,-123.425687,-123.425721,-123.406299,-123.406341,-123.4014,-123.401297,-123.400242,-123.371999,-123.371581,-123.36665,-123.366666,-123.347048,-123.328588,-123.328626,-123.309162,-123.309197,-123.274283,-123.27426,-123.249328,-123.249209,-123.229619,-123.229581,-123.229526,-123.229676,-123.229545,-123.229271,-123.229284,-123.229402,-123.229761,-123.229901,-123.2299,-123.229851,-123.229167,-123.231093,-123.230951,-123.230969,-123.231001,-123.23111258448,-123.245561,-123.344311064432,-123.346955,-123.44467,-123.474991,-123.517910995163,-123.518734,-123.530013873107,-123.569305,-123.624022,-123.631514798612,-123.657212,-123.728169,-123.787501,-123.811708,-123.822037891998,-123.820663,-123.818981,-123.818161,-123.821615,-123.824441,-123.826343,-123.828843,-123.829295,-123.827502,-123.827325,-123.830213,-123.832066,-123.833287,-123.834613,-123.83615,-123.83774,-123.838592,-123.838849,-123.839529,-123.839963,-123.840068,-123.840103,-123.837541,-123.83653,-123.837496,-123.837574,-123.836151,-123.841723,-123.844471,-123.845386,-123.845611,-123.847758,-123.848952,-123.84909,-123.848497,-123.846851,-123.843151,-123.840693,-123.840683,-123.840118,-123.838574,-123.838755,-123.840893,-123.841559,-123.840227,-123.834601,-123.834302,-123.834173,-123.830968,-123.829397,-123.827264,-123.828112,-123.826921,-123.8271,-123.825624,-123.824877,-123.82251,-123.821973,-123.82572,-123.829528,-123.829967,-123.830979,-123.831124,-123.832155,-123.835422,-123.836688,-123.838249,-123.840156,-123.840149,-123.83883,-123.839241,-123.842828,-123.846258,-123.850176,-123.854857,-123.856075,-123.858549,-123.857192,-123.85591,-123.855572,-123.853382,-123.85081,-123.849528,-123.844724,-123.842871,-123.840232,-123.836854,-123.827684,-123.826311,-123.823911,-123.822386,-123.821199,-123.820841,-123.817915,-123.815726,-123.812603,-123.814793,-123.814536,-123.815092,-123.813199,-123.813505,-123.816316,-123.81719,-123.821288,-123.820857,-123.821531,-123.820407,-123.820471,-123.818915,-123.816794,-123.813891,-123.812417,-123.811361,-123.808307,-123.805991,-123.802202,-123.799931,-123.797063,-123.796702,-123.793144,-123.790462,-123.791154,-123.792834,-123.793288,-123.793075,-123.794003,-123.79252,-123.7922,-123.796383,-123.798159,-123.79962,-123.803515,-123.805938,-123.809421,-123.812203,-123.810017,-123.811604,-123.811992,-123.813816,-123.815251,-123.814997,-123.817359,-123.820847,-123.822177,-123.823743,-123.82382,-123.826159,-123.825742,-123.825321,-123.828031,-123.829732,-123.830947,-123.832684,-123.832956,-123.835287,-123.838419,-123.836606,-123.837879,-123.83972,-123.843007,-123.843557,-123.847315,-123.847595,-123.847483,-123.845404,-123.844167,-123.841454,-123.839496,-123.8417,-123.845982,-123.84557,-123.849054,-123.851287,-123.853846,-123.856118,-123.857646,-123.859863,-123.863558,-123.864168,-123.866394,-123.869582,-123.871462,-123.871837,-123.87318,-123.875264,-123.87675,-123.876337,-123.878927,-123.878522,-123.877858,-123.877852,-123.878816,-123.884467,-123.884354,-123.888026,-123.891321,-123.892651,-123.895094,-123.897208,-123.900219,-123.903527,-123.907007,-123.910437,-123.915017,-123.916606,-123.920408,-123.923302,-123.924437,-123.925893,-123.928303,-123.930195,-123.933213,-123.93467,-123.935313,-123.936538,-123.940407,-123.944632,-123.94959,-123.953011,-123.956029,-123.962628,-123.966661,-123.970015,-123.972898,-123.978917,-123.984686,-123.986317,-123.990456,-123.992913,-123.995141,-123.998549,-124.008637,-124.010986,-124.017452,-124.01908,-124.021961,-124.026947,-124.028712,-124.030141,-124.032262,-124.033565,-124.036265,-124.036171,-124.035001,-124.035489,-124.037266,-124.03726,-124.038584,-124.039586,-124.041579,-124.041983],"lat":[42.387656,42.388837,42.392623,42.393818,42.394949,42.395766,42.396407,42.398726,42.401762,42.403283,42.402883,42.403308,42.407409,42.407621,42.408194,42.410041,42.410959,42.412176,42.412677,42.413114,42.416175,42.418034,42.419622,42.420822,42.421399,42.421801,42.423994,42.426465,42.427216,42.427851,42.428504,42.429269,42.430707,42.432342,42.434189,42.435068,42.437069,42.439908,42.441928,42.443527,42.444308,42.445291,42.44602,42.447785,42.451153,42.451543,42.451972,42.453402,42.453976,42.455054,42.458572,42.461239,42.462041,42.462667,42.46302,42.464829,42.467382,42.47166,42.473912,42.477902,42.480858,42.48466,42.485828,42.486682,42.487376,42.488828,42.489421,42.489628,42.494019,42.496147,42.496918,42.496875,42.499962,42.500694,42.500832,42.499599,42.501621,42.501979,42.498353,42.497167,42.49761,42.49535,42.496028,42.497228,42.49732,42.498816,42.498238,42.499311,42.500487,42.500474,42.501334,42.500867,42.50113,42.500293,42.497079,42.496023,42.496048,42.494563,42.494335,42.495021,42.494737,42.495798,42.495396,42.496146,42.497435,42.496903,42.499165,42.499584,42.498416,42.499058,42.498997,42.499925,42.500538,42.502978,42.504233,42.505436,42.506279,42.507625,42.508401,42.509885,42.511588,42.51372,42.516203,42.516799,42.519959,42.522047,42.524647,42.526195,42.527805,42.528675,42.530067,42.531188,42.533372,42.534203,42.535158,42.536341,42.539031,42.541989,42.542232,42.544375,42.549736,42.551791,42.553775,42.556281,42.559989,42.562393,42.563091,42.564143,42.566509,42.567228,42.569663,42.570941,42.574579,42.57809,42.579542,42.581966,42.583353,42.586258,42.587864,42.588961,42.591633,42.595067,42.598106,42.599452,42.601793,42.604497,42.606107,42.607046,42.607575,42.60913,42.611139,42.612446,42.614786,42.615779,42.619743,42.622398,42.625339,42.625798,42.632313,42.694025,42.700429,42.700834,42.702858,42.704493,42.704685,42.705989,42.708063,42.709109,42.711145,42.713543,42.715028,42.715876,42.717138,42.717906,42.720093,42.720584,42.72596,42.728067,42.731791,42.732339,42.742038,42.742576,42.746335,42.747987,42.751499,42.753118,42.757294,42.760655,42.762842,42.764575,42.765701,42.768945,42.771115,42.773041,42.773809,42.774115,42.775435,42.77747,42.780911,42.782694,42.784061,42.739658,42.739703,42.739593,42.753907,42.753789,42.750274,42.750145,42.739682,42.73992,42.732149,42.732098,42.735716,42.735693,42.72483,42.724796,42.717574,42.717122,42.709832,42.709186,42.70918,42.702248,42.702168,42.702942,42.699297,42.699406,42.702982,42.703025,42.711122,42.710928,42.711039,42.714483,42.713966,42.710288,42.710297,42.724958,42.724951,42.724955,42.739484,42.739471,42.732194,42.732226,42.73175,42.728247,42.728412,42.732055,42.73203,42.724712,42.724404,42.702421,42.70261,42.668065,42.626212,42.551766,42.495623,42.429362,42.420299,42.355665,42.312847,42.290816,42.287434,42.280466,42.128331,42.128069,42.098876,42.082066,42.004931,42.0039324384249,42.003364,41.9993825981084,41.999276,42.000608,42.000661,42.0007581373596,42.00076,42.0007301112694,42.000626,41.99977,41.998714371006,41.995094,41.997056,41.995834,41.995194,41.9956172960188,41.996727,41.998563,41.998791,41.999935,42.000564,42.00188,42.002504,42.004951,42.006535,42.008438,42.011552,42.011666,42.012042,42.012811,42.013911,42.01489,42.015304,42.016469,42.01704,42.017586,42.018098,42.018736,42.020306,42.024006,42.025558,42.02734,42.029292,42.031385,42.03336,42.036426,42.03699,42.040136,42.043009,42.045069,42.046646,42.047798,42.048965,42.051934,42.05248,42.055504,42.057618,42.057965,42.058515,42.059225,42.060507,42.063187,42.063791,42.066002,42.068955,42.069596,42.072475,42.073675,42.074796,42.077493,42.080498,42.084441,42.085321,42.086567,42.093188,42.097285,42.100377,42.101345,42.103609,42.107914,42.10885,42.109619,42.113334,42.116779,42.119291,42.122593,42.124671,42.125599,42.125204,42.126945,42.130628,42.133224,42.135116,42.137426,42.138323,42.141392,42.143597,42.144503,42.145819,42.146369,42.149668,42.152913,42.154378,42.155855,42.157509,42.157656,42.159333,42.161167,42.163027,42.16438,42.166047,42.169651,42.170464,42.172501,42.174122,42.178235,42.183987,42.185435,42.188225,42.189849,42.190924,42.193959,42.195498,42.198974,42.2036,42.203769,42.20573,42.212667,42.214644,42.217284,42.216849,42.215738,42.216388,42.218962,42.219878,42.22111,42.220457,42.222173,42.224314,42.22781,42.230098,42.231155,42.233619,42.237623,42.237497,42.238232,42.240204,42.239436,42.241176,42.241494,42.24399,42.24779,42.251246,42.253495,42.254797,42.259439,42.262603,42.264096,42.264665,42.264365,42.266983,42.268693,42.270973,42.271824,42.276123,42.279255,42.279859,42.281652,42.282991,42.285622,42.286277,42.288537,42.290556,42.294693,42.296282,42.297656,42.298507,42.299219,42.301983,42.303538,42.305638,42.307854,42.310752,42.312202,42.313281,42.316923,42.318327,42.319125,42.320577,42.320742,42.319933,42.318688,42.31854,42.32046,42.321478,42.322362,42.322796,42.324799,42.327455,42.327633,42.330071,42.330669,42.333167,42.335279,42.341049,42.342428,42.344851,42.345667,42.346072,42.347602,42.351454,42.353095,42.353293,42.351422,42.350937,42.349234,42.349314,42.347644,42.347884,42.346709,42.346592,42.346469,42.348835,42.351045,42.352008,42.352612,42.353759,42.354338,42.355761,42.35983,42.361625,42.360604,42.358058,42.356544,42.356991,42.357866,42.356714,42.35774,42.357324,42.357979,42.358505,42.358449,42.359409,42.357941,42.357659,42.358487,42.358488,42.359016,42.358541,42.35977,42.361384,42.36166,42.359199,42.361049,42.363636,42.365481,42.367455,42.3702,42.374389,42.375876,42.377858,42.380525,42.382673,42.383094,42.384751,42.385912,42.387656]}]],[[{"lng":[-118.232214,-118.193345,-118.193405,-118.152945,-118.152456,-118.132141,-118.132347,-118.112092,-118.112068,-118.092122,-118.092087,-118.087036,-118.087016,-118.071877,-118.071916,-118.051902,-118.051956,-118.031808,-118.031671,-118.011485,-118.011402,-117.971947,-117.971787,-117.87228,-117.851163,-117.749535,-117.631491,-117.608707,-117.590849,-117.590858,-117.56962,-117.569664,-117.52936,-117.529408,-117.509202,-117.509214,-117.486744,-117.487014,-117.405264,-117.30419,-117.220060553639,-117.220069,-117.222451,-117.222647,-117.216974,-117.198559149539,-117.198147,-117.193129,-117.170342,-117.15706,-117.143394,-117.138523,-117.133984,-117.133104,-117.13253,-117.130904,-117.121037,-117.118018,-117.111617,-117.107673,-117.104208,-117.102242,-117.098531,-117.09457,-117.093578,-117.090933,-117.089503,-117.07835,-117.074191882813,-117.067284,-117.059352,-117.05651,-117.05303,-117.050057,-117.047399154136,-117.047062,-117.045513,-117.042283,-117.03585,-117.031862,-117.027558,-117.025277,-117.020231,-117.016921,-117.015868756715,-117.008000996386,-117.003682330068,-117.001,-116.98687,-116.983658939347,-116.981825336926,-116.981589778363,-116.978570032446,-116.975905,-116.973542,-116.972828624351,-116.971958,-116.972110100178,-116.972537,-116.973991,-116.973945,-116.970365,-116.970219,-116.9726,-116.973701,-116.971675,-116.967259,-116.965498,-116.949516444006,-116.947591,-116.945256,-116.940534,-116.939296726739,-116.935443,-116.925392,-116.924028,-116.915738,-116.902752,-116.900103,-116.895757,-116.895028421445,-116.894083,-116.894309,-116.895931,-116.897846346997,-116.900834,-116.901737,-116.901922,-116.903327,-116.911218,-116.913239,-116.91376,-116.914236,-116.916410383599,-116.918991,-116.925642,-116.929069,-116.929442,-116.927688,-116.928306,-116.933704,-116.937750474425,-116.937835,-116.940005494001,-116.940274509534,-116.943132,-116.957009,-116.967203,-116.974253,-116.977351,-116.976979427494,-116.9745725227,-116.974016,-116.973185,-116.972504,-116.972045557891,-116.956246,-116.955741432932,-116.955694238564,-116.950573662942,-116.943361,-116.937342,-116.937261403083,-116.935696297006,-116.935592015008,-116.934719940664,-116.934485,-116.935911,-116.941458,-116.941734972941,-116.943742,-116.94321505163,-116.94242,-116.935847,-116.935584,-116.938195,-116.942757,-116.959871,-116.968743,-116.973435,-116.97618,-116.975525,-116.973807,-116.971556,-116.97088,-116.968634,-116.966314,-116.961683,-116.959206,-116.959808,-116.97049,-116.972331,-116.971574,-116.964915,-116.961264,-116.960415,-116.96177,-116.962251,-116.964292,-116.968214,-116.969028,-116.968955773782,-116.968931,-116.967641,-116.961806,-116.959993,-116.959363,-116.958752,-116.962615,-116.972362,-116.97958,-116.981919,-116.980250760831,-116.979961,-116.978564231043,-116.977332,-116.976429,-116.976694,-116.9765,-116.976114,-116.97617647824,-116.98384,-116.98371442608,-116.983199584669,-116.982214,-116.982347,-116.98294,-116.984152,-116.991415,-116.999061,-117.008691316809,-117.01077,-117.020035,-117.021604961574,-117.021721,-117.019853,-117.014828,-117.010701,-117.010383,-117.012831,-117.016826,-117.021461,-117.025156,-117.031887,-117.032881,-117.027931,-117.023577,-117.02155,-117.022110809539,-117.023049,-117.024020777413,-117.026634,-117.026651,-117.026841,-117.026725,-117.026825,-117.026696659314,-117.026586,-117.026624495654,-117.026717,-117.026661,-117.026705,-117.026905,-117.027001,-117.026937,-117.026789,-117.02676,-117.026824,-117.026889,-117.026922,-117.026774,-117.026746,-117.026745350468,-117.026743821013,-117.02674059016,-117.026719331236,-117.026701376309,-117.026652,-117.026683,-117.026253,-117.026303,-117.026331,-117.026665,-117.026631374451,-117.026575021601,-117.026551,-117.026129,-117.026195,-117.02659,-117.026098,-117.026197,-117.040906,-117.04891,-117.055402,-117.068613,-117.197798,-117.217551,-117.403613,-117.443062,-117.506681810353,-117.530197396566,-117.613207836252,-117.6171880341,-117.623731,-117.625973,-117.705780984811,-117.737792142868,-117.873467,-118.123944939374,-118.197189,-118.197369215928,-118.196857,-118.195281,-118.214698,-118.216384,-118.216832,-118.228793,-118.228673,-118.228683,-118.228618,-118.228069,-118.232011,-118.232178,-118.232171,-118.232392,-118.231731,-118.230291,-118.228107,-118.227645,-118.228541,-118.228843,-118.233908,-118.232214],"lat":[44.256129,44.2562,44.270708,44.270684,44.299509,44.299483,44.31431,44.314271,44.328754,44.328734,44.343208,44.343184,44.357646,44.357562,44.372009,44.372004,44.390032,44.389953,44.415192,44.415169,44.429615,44.429296,44.443849,44.443511,44.444045,44.444136,44.444427,44.444661,44.444573,44.43013,44.430062,44.415678,44.415722,44.401329,44.401461,44.387143,44.387246,44.300317,44.301044,44.301462,44.3014040000001,44.301382,44.298963,44.297578,44.288357,44.2741460602673,44.273828,44.270963,44.25889,44.25749,44.258262,44.25937,44.262972,44.264236,44.267045,44.269453,44.277585,44.278945,44.280667,44.280763,44.27994,44.278799,44.275533,44.270978,44.269383,44.260311,44.258234,44.249885,44.2476774328148,44.24401,44.237244,44.230874,44.229076,44.22883,44.2296393340327,44.229742,44.232005,44.242775,44.246805,44.248635,44.248881,44.248505,44.246063,44.245391,44.2453906695423,44.2453881986673,44.2453868423874,44.245386,44.245477,44.2447059354583,44.2442656367649,44.244209072634,44.2434839480557,44.242844,44.23998,44.2380420862255,44.235677,44.2349306846191,44.232836,44.229821,44.225932,44.221221,44.217493,44.2132,44.208017,44.197256,44.194581,44.194126,44.191571735564,44.191264,44.191677,44.19371,44.1937712439328,44.193962,44.191544,44.18844,44.183152,44.179467,44.176851,44.171267,44.1664463691315,44.160191,44.158114,44.154295,44.1526558411174,44.150099,44.14862,44.145931,44.144422,44.139992,44.132929,44.128381,44.127304,44.125462976158,44.123278,44.118929,44.113972,44.112621,44.109438,44.107326,44.100039,44.0970063481431,44.096943,44.0957616644886,44.0956152473123,44.09406,44.091743,44.090936,44.088295,44.085364,44.081832,44.0589530528064,44.053663,44.049425,44.048771,44.0486051115188,44.042888,44.0426043694783,44.0425778402732,44.0396994290017,44.035645,44.029376,44.0291467346366,44.0246946460507,44.0243980062902,44.0219173103878,44.021249,44.012652,44.007431,44.0069165870337,44.003189,44.0016934551559,43.999437,43.990875,43.986874,43.98459,43.984043,43.982925,43.977477,43.977085,43.974719,43.973091,43.972187,43.970112,43.968302,43.968412,43.968884,43.968168,43.96636,43.963815,43.959764,43.958357,43.956964,43.956301,43.956,43.954564,43.952149,43.948097,43.944286,43.941881,43.939921,43.9377512350526,43.937007,43.934792,43.932797,43.93065,43.927739,43.923246,43.91748,43.916453,43.915253,43.912478,43.9094192775191,43.908888,43.9072537431298,43.905812,43.901293,43.900361,43.897128,43.894759,43.8946464890304,43.880846,43.8801032140428,43.8770578606079,43.871228,43.86884,43.86771,43.866794,43.863864,43.864637,43.8626893878893,43.862269,43.858956,43.8563729196878,43.856182,43.853833,43.852172,43.849754,43.844803,43.840001,43.839962,43.841694,43.841334,43.834156,43.830025,43.826286,43.823811,43.819402,43.8173218792265,43.813842,43.8122882404094,43.80811,43.733935,43.732905,43.714815,43.706193,43.6937391205206,43.683001,43.6808035152354,43.675523,43.664385,43.631659,43.62488,43.621032,43.617614,43.610669,43.601912,43.600357,43.596033,43.593632,43.578674,43.577526,43.5737089790098,43.5647210211312,43.5457346710279,43.420805024449,43.3152915591549,43.025128,43.024876,42.807447,42.80717,42.807015,42.624878,42.5522229216117,42.4304607260049,42.378557,42.357193,42.166404,42.133258,42.117647,41.99989,41.99989,41.998983,41.99989,42.000035,42.00038,41.999887,41.99929,41.999659,41.9992392555284,41.9990841067272,41.9985364286855,41.9985101685311,41.998467,41.998102,41.9981771341869,41.9982072706744,41.998335,41.9972981831054,41.996995,41.9969940811635,42.135279,42.275813,42.275891,42.805902,42.914703,42.914625,43.042817,43.086086,43.096791,43.348964,43.348959,43.43565,43.436775,43.612266,43.779216,43.779207,43.779195,44.039862,44.183239,44.21255,44.212548,44.256129]}]],[[{"lng":[-118.51944,-118.518181,-118.516539,-118.513679,-118.509705,-118.507765,-118.505765,-118.501794,-118.499774,-118.498457,-118.498373,-118.498161,-118.497865,-118.497422,-118.496787,-118.496583,-118.496169,-118.495729,-118.495257,-118.492404,-118.491292,-118.488174,-118.483704,-118.480904,-118.476922,-118.473427,-118.470581,-118.468284,-118.464244,-118.461528,-118.460802,-118.461866,-118.460487,-118.459157,-118.45227,-118.445862,-118.443456,-118.440003,-118.437712,-118.435673,-118.433707,-118.432064,-118.43182,-118.425086,-118.422747,-118.419381,-118.419907,-118.418247,-118.418867,-118.417419,-118.413647,-118.403611,-118.40025,-118.395839,-118.393659,-118.394052,-118.391656,-118.391704,-118.387177,-118.387277,-118.385176,-118.383321,-118.383411,-118.381491,-118.379786,-118.376666,-118.372775,-118.367621,-118.365587,-118.361673,-118.358121,-118.35243,-118.350798,-118.346502,-118.343374,-118.339207,-118.336355,-118.332304,-118.329785,-118.325783,-118.321741,-118.319306,-118.316347,-118.311639,-118.306628,-118.305462,-118.302565,-118.300094,-118.29877,-118.296443,-118.294194,-118.292079,-118.289862,-118.285439,-118.286743,-118.286281,-118.286739,-118.288299,-118.289351,-118.28984,-118.287422,-118.286294,-118.28311,-118.283385,-118.284994,-118.290151,-118.292122,-118.294094,-118.294019,-118.293393,-118.294383,-118.299459,-118.298355,-118.296578,-118.2978,-118.298077,-118.296548,-118.294827,-118.295068,-118.296269,-118.300975,-118.303366,-118.304572,-118.307522,-118.307233,-118.308837,-118.311173,-118.310056,-118.30847,-118.308421,-118.313907,-118.317934,-118.3187,-118.314454,-118.312281,-118.309246,-118.306817,-118.306764,-118.302862,-118.29906,-118.293566,-118.294909,-118.294716,-118.296234,-118.295659,-118.289794,-118.2872,-118.283489,-118.279179,-118.2759,-118.267786,-118.264012,-118.261829,-118.258237,-118.253802,-118.246533,-118.242499,-118.24055,-118.236861,-118.23518,-118.228076,-118.227459,-118.22816,-118.228056,-118.224904,-118.226627,-118.229972,-118.230979,-118.232402,-118.231462,-118.235329,-118.236369,-118.235589,-118.235656,-118.234808,-118.236831,-118.237399,-118.235115,-118.232795,-118.229421,-118.227791,-118.231634,-118.232128,-118.231337,-118.22828,-118.226561,-118.226727,-118.225709,-118.223449,-118.226449,-118.227547,-118.229663,-118.233636,-118.23623,-118.237322,-118.24161,-118.244382,-118.245043,-118.24364,-118.244533,-118.243553,-118.244662,-118.245136,-118.232197,-118.232165,-118.232658,-118.231806,-118.229691,-118.228047,-118.227421,-118.225462,-118.223739,-118.223192,-118.220371,-118.220763,-118.219197,-118.217081,-118.213869,-118.213634,-118.214731,-118.212772,-118.213478,-118.213556,-118.212459,-118.21246,-118.214497,-118.214184,-118.211519,-118.209168,-118.206973,-118.203838,-118.201486,-118.200232,-118.197174,-118.194901,-118.192549,-118.184709,-118.178908,-118.17687,-118.175223,-118.172167,-118.169815,-118.166758,-118.164484,-118.161036,-118.156488,-118.155076,-118.15578,-118.154916,-118.148405,-118.142367,-118.140876,-118.140482,-118.141185,-118.139929,-118.138203,-118.137729,-118.136551,-118.130351,-118.128407,-118.126328,-118.11925,-118.115495,-118.110422,-118.108962,-118.10804,-118.102659,-118.100661,-118.098817,-118.096972,-118.094052,-118.09213,-118.091286,-118.089673,-118.088982,-118.086523,-118.080456,-118.077997,-118.074772,-118.0717,-118.06955,-118.064404,-118.063637,-118.060105,-118.057584,-118.051814,-118.046279,-118.044232,-118.041949,-118.037125,-118.032237,-118.028283,-118.022745,-118.016228,-118.009949,-118.007344,-118.006843,-118.00333,-118.000318,-117.998992,-117.993112,-117.990182,-117.985755,-117.982631,-117.977728,-117.975378,-117.97216,-117.968688,-117.965211,-117.958124,-117.956183,-117.952633,-117.950925,-117.9477,-117.946243,-117.944977,-117.942835,-117.940522,-117.937296,-117.93636,-117.933931,-117.931873,-117.928321,-117.92723,-117.925714,-117.921696,-117.922093,-117.920378,-117.918603,-117.917634,-117.917055,-117.915266,-117.914198,-117.913393,-117.912473,-117.911901,-117.906142,-117.903603,-117.901443,-117.900497,-117.896386,-117.897252,-117.894074,-117.894708,-117.890515,-117.890152,-117.886506,-117.885732,-117.888408,-117.885361,-117.88527,-117.884041,-117.881163,-117.873396,-117.873734,-117.871887,-117.870438,-117.868648,-117.862058,-117.859832,-117.858127,-117.853788,-117.850462,-117.850204,-117.84343,-117.842069,-117.84433,-117.844909,-117.841727,-117.83989,-117.83775,-117.837244,-117.840601,-117.840934,-117.838224,-117.834022,-117.828819,-117.827377,-117.827784,-117.818062,-117.814507,-117.81202,-117.810347,-117.810499,-117.812384,-117.810901,-117.813232,-117.812501,-117.809642,-117.807106,-117.805679,-117.80439,-117.803943,-117.805343,-117.803614,-117.802486,-117.804671,-117.803038,-117.801591,-117.799102,-117.798106,-117.799062,-117.797076,-117.796519,-117.795212,-117.793418,-117.794612,-117.797179,-117.795811,-117.793905,-117.793626,-117.795624,-117.794825,-117.795976,-117.793112,-117.794182,-117.791738,-117.790617,-117.786109,-117.784715,-117.781825,-117.77942,-117.778664,-117.778261,-117.780449,-117.784287,-117.784223,-117.784917,-117.78438,-117.779549,-117.777504,-117.747664,-117.564033,-117.563402,-117.563486,-117.381873,-117.379472,-117.368183,-117.313239,-117.266005,-117.091719,-117.022673,-117.022673,-116.783771926572,-116.78371,-116.797329,-116.808576,-116.814589,-116.826133,-116.842731,-116.847944,-116.845847,-116.844796,-116.844625,-116.846103,-116.856754,-116.858313,-116.856964,-116.85226,-116.848093,-116.844323,-116.841971,-116.839031,-116.834915,-116.830505,-116.826271,-116.829329,-116.836449,-116.847888,-116.850737,-116.846461,-116.835702,-116.832176,-116.833632,-116.838467,-116.842108,-116.846061,-116.850512,-116.852427,-116.857038,-116.865338,-116.871701,-116.876001,-116.878183,-116.879375,-116.883598,-116.887748,-116.889882,-116.892361,-116.895805,-116.898153,-116.898609,-116.896424,-116.896249,-116.898388,-116.899640878328,-116.900069,-116.900146,-116.901051,-116.905771,-116.920498,-116.928099,-116.931099,-116.933699,-116.933799,-116.933099,-116.9308,-116.9307,-116.9318,-116.9347,-116.9368,-116.949001,-116.966801,-116.970902,-116.972902,-116.977802,-116.986502,-116.992003,-116.998903,-117.006045,-117.013802,-117.016216,-117.018418,-117.021398,-117.02942,-117.031738,-117.03827,-117.039549,-117.044217,-117.046250547549,-117.04782,-117.048178,-117.050495,-117.05856,-117.062273,-117.060454,-117.061799,-117.063824,-117.072221,-117.074137,-117.07912,-117.07871,-117.079483004572,-117.080555,-117.080772,-117.079835603761,-117.078574,-117.079031,-117.081022,-117.081286739531,-117.086075,-117.091223,-117.095868,-117.096791,-117.094968,-117.098221,-117.108231,-117.114754,-117.117809,-117.120522,-117.125267,-117.124754,-117.126009,-117.133963,-117.138066,-117.14248,-117.146032,-117.148255,-117.147934,-117.14293,-117.144161,-117.149242,-117.152406,-117.161033,-117.167187,-117.181583,-117.185386,-117.189759,-117.19163,-117.191329,-117.192494,-117.194317,-117.200237,-117.208936,-117.211148,-117.216372,-117.221479026379,-117.224104,-117.225076,-117.225932,-117.225758,-117.224445,-117.221548,-117.217015,-117.215573,-117.214637,-117.215072,-117.218285,-117.225461,-117.22698,-117.234835,-117.242675,-117.243027,-117.235117,-117.227938,-117.216911,-117.210587,-117.206962,-117.197339,-117.196149,-117.189769,-117.189842,-117.191546,-117.192203,-117.203323,-117.2055,-117.21521,-117.216795,-117.217843,-117.220060553639,-117.30419,-117.405264,-117.487014,-117.486744,-117.509214,-117.509202,-117.529408,-117.52936,-117.569664,-117.56962,-117.590858,-117.590849,-117.608707,-117.631491,-117.749535,-117.851163,-117.87228,-117.971787,-117.971947,-118.011402,-118.011485,-118.031671,-118.031808,-118.051956,-118.051902,-118.071916,-118.071877,-118.087016,-118.087036,-118.092087,-118.092122,-118.112068,-118.112092,-118.132347,-118.132141,-118.152456,-118.152945,-118.193405,-118.193345,-118.232214,-118.23217,-118.354122,-118.354145,-118.447185,-118.497499,-118.49732,-118.500117,-118.498411,-118.497321,-118.496152,-118.49507,-118.490468,-118.488681,-118.486512,-118.484647,-118.482345,-118.481412,-118.48124,-118.478727,-118.478595,-118.474848,-118.47266,-118.467883,-118.469096,-118.46887,-118.461061,-118.458579,-118.457563,-118.456729,-118.452455,-118.447799,-118.440356,-118.436986,-118.43437,-118.435357,-118.433621,-118.432384,-118.433579,-118.433813,-118.432812,-118.430374,-118.420455,-118.413314,-118.410955,-118.407612,-118.40889,-118.409774,-118.413703,-118.417555,-118.421329,-118.422586,-118.424394,-118.428326,-118.428483,-118.427067,-118.425493,-118.431707,-118.43501,-118.434932,-118.435954,-118.434853,-118.434066,-118.431147,-118.430919,-118.428322,-118.429108,-118.42895,-118.422418,-118.422102,-118.423597,-118.420684,-118.418457,-118.420366,-118.420601,-118.421545,-118.422173,-118.421542,-118.420911,-118.419336,-118.418155,-118.41351,-118.411069,-118.408786,-118.405392,-118.402845,-118.398703,-118.394593,-118.39201,-118.388293,-118.386097,-118.383108,-118.380034,-118.378302,-118.376741,-118.375367,-118.372852,-118.36939,-118.367973,-118.36514,-118.360732,-118.36231,-118.36365,-118.367042,-118.362312,-118.357986,-118.360667,-118.363427,-118.365086,-118.364615,-118.366115,-118.367772,-118.370202,-118.372863,-118.373195,-118.374563,-118.373523,-118.374509,-118.374236,-118.371346,-118.368806,-118.371036,-118.370803,-118.372225,-118.37153,-118.369628,-118.365535,-118.364066,-118.359224,-118.358417,-118.356315,-118.354205,-118.354821,-118.352379,-118.351025,-118.349305,-118.346739,-118.347966,-118.347614,-118.346234,-118.346866,-118.345607,-118.343872,-118.343274,-118.337886,-118.337408,-118.334252,-118.332254,-118.328495,-118.327739,-118.32617,-118.323526,-118.322737,-118.31982,-118.317296,-118.31769,-118.315482,-118.316873,-118.314069,-118.315622,-118.310984,-118.311222,-118.308934,-118.306961,-118.305777,-118.305778,-118.309328,-118.311696,-118.311853,-118.309704,-118.312564,-118.314537,-118.316589,-118.319431,-118.329297,-118.333246,-118.336404,-118.337588,-118.338852,-118.338063,-118.341934,-118.342567,-118.341699,-118.341779,-118.344374,-118.342194,-118.342172,-118.343208,-118.343684,-118.353557,-118.354824,-118.355851,-118.360273,-118.362249,-118.36454,-118.368572,-118.3711,-118.372365,-118.375037,-118.377906,-118.379855,-118.386038,-118.38634,-118.388087,-118.391024,-118.393181,-118.399942,-118.402581,-118.403639,-118.404947,-118.410214,-118.41088,-118.412928,-118.414113,-118.417036,-118.41909,-118.422329,-118.425197,-118.429638,-118.432342,-118.433626,-118.436806,-118.438184,-118.441788,-118.446702,-118.451401,-118.453139,-118.456063,-118.460962,-118.463113,-118.472734,-118.473527,-118.47732,-118.48214,-118.485639,-118.488713,-118.493278,-118.497947,-118.500889,-118.504435,-118.504437,-118.507257,-118.507077,-118.50892,-118.510957,-118.511088,-118.512691,-118.513986,-118.517591,-118.518688,-118.51765,-118.51749,-118.516452,-118.519174,-118.51944],"lat":[44.705886,44.706081,44.704765,44.7061,44.706237,44.708903,44.709331,44.708664,44.709055,44.710619,44.710678,44.710958,44.711163,44.711339,44.711606,44.711729,44.712027,44.712425,44.712865,44.713621,44.712393,44.710944,44.71003,44.710035,44.709199,44.705289,44.704,44.705666,44.706374,44.707521,44.708948,44.710861,44.712657,44.715774,44.719166,44.723436,44.724173,44.722886,44.721547,44.721555,44.720729,44.721091,44.719766,44.718554,44.719488,44.718693,44.721846,44.722776,44.724884,44.726986,44.727122,44.724808,44.72647,44.726005,44.727872,44.728998,44.731398,44.734328,44.735949,44.737389,44.739093,44.738868,44.740717,44.742041,44.744357,44.745249,44.745628,44.747213,44.747126,44.745474,44.745573,44.744738,44.743996,44.743912,44.744444,44.743944,44.742609,44.742467,44.74358,44.74162,44.74151,44.742082,44.743986,44.744241,44.74528,44.746949,44.747643,44.746025,44.746248,44.74698,44.746564,44.747389,44.749868,44.750975,44.754323,44.757123,44.759278,44.762708,44.763371,44.765439,44.767165,44.767331,44.77072,44.772211,44.773003,44.77925,44.780412,44.784664,44.787259,44.787936,44.790167,44.796442,44.798705,44.799211,44.800259,44.802979,44.807807,44.809344,44.813191,44.816164,44.816426,44.81733,44.818712,44.819407,44.821148,44.821229,44.823236,44.824802,44.828794,44.830613,44.832422,44.834937,44.836274,44.838066,44.840039,44.841107,44.843855,44.846614,44.848153,44.850451,44.853018,44.856606,44.859376,44.862086,44.863043,44.866421,44.865367,44.865007,44.866271,44.866573,44.869386,44.866412,44.866013,44.863351,44.864851,44.864071,44.863165,44.862344,44.86166,44.862587,44.865544,44.867783,44.870332,44.872332,44.875568,44.878634,44.882349,44.887149,44.891028,44.894063,44.897046,44.898643,44.901367,44.902902,44.904173,44.906927,44.908385,44.91053,44.911514,44.913854,44.918361,44.921531,44.923482,44.924687,44.926032,44.930012,44.931409,44.933778,44.93691,44.939575,44.939778,44.941695,44.940104,44.941213,44.942695,44.943198,44.94431,44.945198,44.950096,44.951086,44.956525,44.958396,44.960686,44.960686,44.963285,44.966976,44.969921,44.97237,44.973481,44.976652,44.977488,44.979158,44.981549,44.983722,44.984888,44.987447,44.988505,44.989174,44.990567,44.991343,44.995073,44.996519,44.999353,45.00108,45.005306,45.006585,45.007421,45.008201,45.010094,45.010203,45.01232,45.013155,45.015104,45.015325,45.017329,45.017997,45.019389,45.017995,45.019389,45.019388,45.017105,45.017161,45.016103,45.016657,45.015711,45.017883,45.018775,45.020442,45.022278,45.026728,45.027725,45.02945,45.031677,45.033844,45.035513,45.036458,45.040018,45.040799,45.045024,45.045214,45.044444,45.044761,45.045162,45.046962,45.046801,45.046198,45.045602,45.044347,45.044892,45.04233,45.042327,45.041238,45.038568,45.036878,45.033716,45.032029,45.025648,45.024723,45.021068,45.019598,45.016873,45.015179,45.014088,45.012924,45.012569,45.012785,45.00991,45.006868,45.006961,45.004007,45.003881,45.003403,45.001635,45.000595,44.997644,44.997415,44.996376,44.99484,44.994876,44.994348,44.994448,44.99525,44.99459,44.995409,44.994951,44.995873,44.99617,44.995908,44.997626,45.000621,45.000952,45.002967,45.004881,45.006582,45.006698,45.006667,45.008418,45.009324,45.012767,45.0125,45.014081,45.013626,45.015197,45.016787,45.016939,45.019079,45.020889,45.023006,45.024485,45.024736,45.025357,45.026033,45.026847,45.027236,45.028207,45.028008,45.030232,45.033156,45.034604,45.036321,45.037917,45.039581,45.043706,45.04524,45.047569,45.048706,45.049436,45.051089,45.0571,45.056709,45.058249,45.060095,45.059622,45.060713,45.065639,45.064703,45.060146,45.05758,45.054525,45.055712,45.059753,45.060443,45.060351,45.059736,45.058477,45.057026,45.056057,45.054797,45.054096,45.055136,45.055138,45.052819,45.051643,45.050658,45.04804,45.042113,45.037596,45.035472,45.033314,45.025909,45.024491,45.024511,45.025607,45.026711,45.027532,45.028808,45.030655,45.032274,45.032445,45.031655,45.032832,45.032625,45.031851,45.029481,45.030495,45.029705,45.028184,45.02718,45.02915,45.029284,45.028164,45.026766,45.026679,45.025335,45.026273,45.025795,45.023959,45.023925,45.02278,45.023142,45.022058,45.021648,45.020454,45.018489,45.018583,45.016682,45.016317,45.014854,45.013987,45.014289,45.013583,45.01143,45.009631,45.007621,45.005572,45.003714,44.999668,44.998322,44.995675,44.995244,44.992161,44.992426,44.992866,45.036118,45.079446,45.079997,45.079993,45.080569,45.080581,45.08057,45.080158,45.079734,45.079167,45.078265731912,45.076972,45.060267,45.050652,45.048106,45.037285,45.029446,45.022602,45.01847,45.015312,45.001435,44.999878,44.984298,44.978761,44.975173,44.972527,44.971906,44.974879,44.980758,44.983992,44.985756,44.98458,44.982493,44.975173,44.969239,44.964768,44.958113,44.951521,44.940633,44.931373,44.928976,44.923601,44.914922,44.905249,44.893523,44.887577,44.880769,44.870599,44.867613,44.866684,44.864706,44.861793,44.858268,44.855799,44.855171,44.855218,44.855752,44.854319,44.851985,44.849733,44.84833,44.84228,44.8406075080495,44.840036,44.836672,44.83568,44.834794,44.81438,44.808381,44.804781,44.798781,44.796781,44.794481,44.790981,44.789881,44.787181,44.783881,44.782881,44.777981,44.775181,44.773881,44.772581,44.767981,44.762381,44.759182,44.756382,44.756024,44.756841,44.755572,44.751942,44.750785,44.751102,44.74986,44.748179,44.746483,44.74514,44.7431132252987,44.741549,44.735916,44.732477,44.730265,44.727143,44.721668,44.706654,44.703623,44.700517,44.696374,44.692175,44.690084,44.6886720621095,44.686714,44.684161,44.6825280578776,44.680328,44.677676,44.673685,44.6735859256969,44.671794,44.668807,44.664737,44.657385,44.652011,44.640689,44.62711,44.624883,44.620139,44.614658,44.593818,44.583834,44.581553,44.57524,44.572996,44.57143,44.568603,44.564371,44.562143,44.557236,44.545647,44.536151,44.531802,44.525166,44.523431,44.52296,44.519261,44.513385,44.509886,44.506784,44.503272,44.499884,44.492027,44.485661,44.485359,44.48616,44.4845576143306,44.483734,44.482346,44.479389,44.477223,44.473884,44.470146,44.459042,44.453746,44.44803,44.427162,44.420664,44.407729,44.405583,44.399669,44.396548,44.390974,44.373853,44.367975,44.360163,44.357703,44.355206,44.347406,44.346362,44.336585,44.335007,44.329621,44.32863,44.313024,44.311789,44.309116,44.308236,44.30718,44.3014040000001,44.301462,44.301044,44.300317,44.387246,44.387143,44.401461,44.401329,44.415722,44.415678,44.430062,44.43013,44.444573,44.444661,44.444427,44.444136,44.444045,44.443511,44.443849,44.429296,44.429615,44.415169,44.415192,44.389953,44.390032,44.372004,44.372009,44.357562,44.357646,44.343184,44.343208,44.328734,44.328754,44.314271,44.31431,44.299483,44.299509,44.270684,44.270708,44.2562,44.256129,44.257343,44.256824,44.255384,44.255211,44.255248,44.277036,44.277057,44.278536,44.28383,44.287046,44.288546,44.289246,44.294188,44.297932,44.302617,44.304536,44.306626,44.309518,44.313051,44.315917,44.318331,44.319045,44.322048,44.325517,44.334584,44.336551,44.340343,44.344848,44.346428,44.349406,44.350716,44.350936,44.352126,44.353977,44.356125,44.359247,44.362848,44.364889,44.368133,44.36914,44.369882,44.371744,44.373543,44.373036,44.370845,44.372909,44.378619,44.380988,44.383807,44.385782,44.388993,44.391195,44.394126,44.394828,44.397454,44.398748,44.39858,44.397508,44.399426,44.401907,44.403825,44.407153,44.4088,44.40997,44.411717,44.414309,44.416737,44.421752,44.423503,44.426207,44.428179,44.432468,44.438442,44.443008,44.444531,44.448984,44.453439,44.455072,44.456766,44.455921,44.454282,44.452872,44.452648,44.454457,44.456458,44.457777,44.457882,44.456869,44.458337,44.458504,44.45974,44.462276,44.461433,44.45958,44.459231,44.462786,44.466172,44.466621,44.469162,44.471699,44.474066,44.474856,44.478912,44.480101,44.484385,44.485906,44.488219,44.491714,44.493629,44.496334,44.498025,44.502494,44.50479,44.506397,44.507891,44.509207,44.512089,44.514035,44.519056,44.521255,44.523791,44.526215,44.528638,44.531191,44.53281,44.538112,44.537216,44.536041,44.539108,44.541274,44.542545,44.545392,44.54759,44.548037,44.548608,44.550466,44.551086,44.553654,44.554977,44.556217,44.559716,44.560056,44.562544,44.567029,44.565182,44.564453,44.565112,44.563778,44.562207,44.56119,44.562368,44.564173,44.566543,44.567896,44.569192,44.570658,44.572539,44.575043,44.577082,44.581034,44.582581,44.585317,44.58605,44.587851,44.58881,44.589939,44.591181,44.592251,44.595679,44.597549,44.601609,44.603863,44.605442,44.608771,44.608374,44.610007,44.609502,44.61098,44.61249,44.616775,44.617901,44.618969,44.621341,44.625024,44.626656,44.628403,44.631204,44.631821,44.635601,44.639263,44.639377,44.637965,44.639769,44.639823,44.643038,44.643484,44.645121,44.646102,44.645905,44.64645,44.644419,44.642928,44.641555,44.643001,44.642871,44.643539,44.643381,44.641388,44.641444,44.643025,44.644169,44.644739,44.646543,44.647164,44.648687,44.652801,44.654828,44.653966,44.652595,44.652691,44.654376,44.653206,44.652451,44.650017,44.652859,44.653084,44.655396,44.656297,44.65559,44.656632,44.658729,44.66142,44.661871,44.663639,44.664484,44.663566,44.665698,44.665925,44.665556,44.669929,44.67433,44.675417,44.677878,44.679134,44.681049,44.684021,44.688532,44.690074,44.691562,44.692755,44.695931,44.702462,44.704031,44.705886]}]],[[{"lng":[-120.6535343441,-120.634968,-120.591166,-120.559465,-120.553317424253,-120.521964,-120.505863,-120.482362,-120.45309661514,-120.40396,-120.329057,-120.288656,-120.282156,-120.211474211014,-120.210754,-120.191103256744,-120.170453,-120.141352,-120.07015,-120.0550751063,-120.001148,-119.999501176112,-119.998161,-119.998172,-119.999242,-120.004783,-120.004859,-120.004752,-120.005124,-120.005565,-120.006555,-119.897751,-119.882346,-119.882356,-119.883914,-119.759759,-119.760731,-119.790831,-119.790699,-119.850941,-119.876525,-119.910536,-119.91054,-120.000045,-120.005372,-120.028785,-120.086479,-120.128661,-120.131926,-120.309328,-120.49516,-120.495748,-120.494548,-120.503733,-120.504449,-120.508549,-120.512249,-120.51485,-120.51005,-120.506864,-120.50345,-120.50115,-120.498149,-120.494749,-120.491949,-120.486949,-120.482849,-120.479249,-120.476849,-120.470649,-120.468849,-120.468449,-120.467448,-120.464548,-120.462548,-120.463648,-120.463448,-120.461249,-120.460549,-120.461049,-120.458449,-120.458449,-120.460249,-120.463787,-120.465706,-120.46215,-120.46045,-120.45865,-120.45505,-120.453041,-120.450097,-120.44886,-120.45225,-120.457069,-120.46295,-120.464991,-120.466995,-120.475351,-120.476251,-120.476751,-120.476251,-120.474951,-120.471551,-120.468951,-120.468551,-120.469549,-120.472951,-120.476852,-120.480252,-120.483552,-120.484052,-120.482552,-120.480152,-120.476752,-120.473652,-120.472652,-120.474752,-120.480152,-120.483352,-120.485552,-120.487653,-120.487153,-120.482353,-120.481153,-120.480953,-120.481653,-120.484853,-120.48849,-120.493553,-120.497954,-120.502854,-120.506254,-120.509454,-120.516054,-120.519354,-120.521254,-120.520455,-120.521555,-120.524155,-120.529055,-120.531655,-120.532555,-120.534055,-120.536755,-120.540955,-120.541755,-120.543008,-120.542856,-120.540256,-120.537556,-120.533055,-120.529355,-120.527555,-120.524455,-120.523855,-120.524455,-120.525956,-120.528456,-120.530056,-120.534156,-120.540056,-120.541956,-120.544856,-120.545356,-120.543656,-120.541656,-120.542956,-120.544157,-120.546457,-120.550357,-120.551139,-120.550663,-120.552057,-120.556057,-120.554457,-120.550957,-120.542857,-120.540657,-120.535757,-120.534457,-120.533657,-120.535957,-120.538157,-120.541657,-120.544657,-120.547057,-120.546358,-120.545158,-120.541857,-120.540289,-120.540257,-120.541758,-120.542858,-120.547858,-120.549158,-120.553158,-120.555558,-120.553358,-120.547358,-120.544858,-120.543158,-120.542758,-120.544258,-120.546658,-120.547758,-120.548158,-120.545458,-120.542258,-120.540358,-120.538558,-120.537758,-120.536858,-120.534658,-120.531558,-120.527757,-120.524457,-120.524057,-120.524658,-120.525558,-120.531858,-120.538858,-120.540758,-120.540458,-120.538758,-120.530358,-120.527458,-120.528058,-120.527358,-120.529458,-120.535158,-120.539358,-120.541258,-120.539658,-120.534358,-120.531958,-120.530958,-120.530758,-120.531258,-120.530458,-120.531258,-120.532458,-120.533958,-120.541459,-120.543359,-120.543059,-120.540159,-120.535559,-120.533659,-120.533659,-120.530659,-120.531859,-120.534659,-120.534459,-120.532059,-120.527059,-120.524459,-120.523459,-120.524059,-120.521859,-120.516659,-120.514958,-120.513158,-120.512558,-120.513358,-120.515159,-120.522659,-120.529759,-120.532559,-120.532059,-120.530159,-120.528159,-120.525259,-120.523059,-120.518459,-120.519359,-120.528659,-120.527559,-120.525059,-120.519859,-120.514759,-120.509659,-120.507959,-120.506259,-120.502659,-120.501159,-120.498759,-120.495759,-120.492258,-120.489258,-120.484258,-120.482958,-120.484158,-120.489058,-120.494059,-120.502959,-120.506059,-120.506459,-120.505859,-120.501859,-120.501159,-120.493959,-120.492259,-120.486758,-120.483658,-120.482941,-120.484435,-120.487859,-120.492159,-120.496059,-120.496859,-120.495159,-120.493659,-120.489859,-120.483459,-120.481559,-120.482359,-120.486359,-120.489859,-120.491759,-120.493459,-120.495859,-120.490359,-120.483859,-120.481228,-120.477559,-120.472759,-120.46966,-120.462291,-120.459937,-120.45441,-120.449907,-120.446592,-120.441284,-120.438779,-120.43323,-120.429082,-120.422903,-120.421449,-120.416409,-120.409948,-120.407022,-120.407256,-120.411057,-120.412857,-120.417857,-120.420557,-120.423257,-120.424257,-120.423357,-120.426057,-120.426856,-120.422581,-120.414957,-120.409557,-120.405557,-120.399056,-120.394456,-120.386686,-120.382056,-120.377756,-120.373427,-120.367855,-120.365655,-120.364955,-120.363246,-120.360827,-120.359976,-120.360771,-120.364122,-120.365217,-120.367013,-120.370994,-120.376304,-120.377837,-120.379469,-120.380493,-120.380486,-120.376156,-120.375793,-120.372139,-120.369313,-120.365401,-120.359512,-120.357804,-120.35798,-120.359875,-120.365267,-120.372265,-120.377466,-120.381856,-120.384579,-120.385845,-120.386122,-120.388305,-120.390763,-120.392574,-120.401323,-120.402107,-120.405673,-120.407038,-120.407663,-120.407117,-120.404832,-120.402578,-120.402654,-120.404938,-120.40536,-120.408536,-120.409128,-120.408982,-120.409413,-120.410742,-120.411699,-120.416052,-120.421999,-120.426305,-120.428135,-120.432693,-120.438889,-120.444248,-120.446592,-120.446258,-120.444612,-120.439925,-120.438299,-120.440538,-120.44422,-120.449588,-120.452159,-120.453915,-120.45746,-120.459735,-120.464725,-120.46795,-120.46897,-120.47018,-120.469915,-120.472696,-120.477475,-120.478087,-120.477833,-120.479303,-120.481042,-120.484741,-120.486421,-120.485326,-120.482367,-120.480276,-120.479181,-120.47836,-120.478341,-120.479474,-120.479903,-120.48231,-120.48244,-120.485156,-120.489585,-120.491732,-120.492223,-120.492223,-120.489739,-120.488689,-120.488779,-120.490833,-120.493853,-120.496624,-120.498461,-120.499805,-120.506384,-120.508107,-120.510188,-120.513313,-120.515688,-120.517573,-120.520924,-120.524742,-120.528516,-120.531013,-120.535308,-120.539245,-120.544783,-120.547364,-120.549064,-120.551164,-120.552064,-120.553064,-120.556464,-120.558264,-120.560065,-120.566965,-120.567465,-120.569465,-120.572265,-120.574265,-120.577565,-120.583366,-120.587066,-120.593766,-120.600466,-120.602466,-120.603766,-120.603466,-120.604867,-120.606167,-120.609967,-120.612267,-120.618567,-120.624467,-120.629067,-120.631668,-120.635868,-120.638568,-120.640368,-120.643668,-120.646068,-120.646168,-120.649368,-120.649368,-120.6535343441],"lat":[45.7372486812962,45.745847,45.746547,45.738348,45.7336759670199,45.709848,45.700048,45.694449,45.6962407125498,45.699249,45.71105,45.72015,45.72125,45.725903582393,45.725951,45.7435045782538,45.761951,45.773152,45.785152,45.7909960828741,45.811902,45.8124817188485,45.687968,45.68439,45.517539,45.517157,45.502468,45.501959,45.385771,45.350553,45.257706,45.257017,45.256916,45.25596,45.169152,45.169211,45.081278,45.081253,45.067823,45.067783,45.067866,45.067928,45.066927,45.065591,45.065582,45.065224,45.065398,45.065453,45.067354,45.06779,45.068279,45.07005,45.07465,45.083477,45.08565,45.08725,45.09095,45.09465,45.10135,45.102778,45.10265,45.1041,45.10455,45.10575,45.10585,45.10435,45.10505,45.11015,45.11165,45.10855,45.10695,45.10285,45.10155,45.10015,45.10115,45.10375,45.10515,45.10865,45.11165,45.11625,45.11945,45.12065,45.12315,45.125985,45.130127,45.13505,45.13795,45.13885,45.13945,45.139253,45.140883,45.143185,45.14545,45.145483,45.14405,45.144196,45.146686,45.15105,45.15185,45.15415,45.15645,45.15775,45.15955,45.16215,45.16355,45.16494,45.16595,45.16835,45.16895,45.17025,45.17155,45.17235,45.17235,45.17325,45.17565,45.17765,45.17975,45.18015,45.17945,45.17955,45.18075,45.18365,45.18665,45.18895,45.19125,45.19335,45.19485,45.197233,45.19765,45.19575,45.19555,45.19615,45.19785,45.19925,45.20105,45.20265,45.20445,45.20535,45.20445,45.20475,45.20605,45.21065,45.21125,45.21115,45.209949,45.210349,45.212507,45.213649,45.217049,45.21785,45.21665,45.21635,45.21675,45.21885,45.22035,45.22255,45.22385,45.22465,45.22465,45.22325,45.219849,45.220249,45.222449,45.223949,45.228449,45.231949,45.235149,45.236649,45.237249,45.240849,45.242426,45.244146,45.246649,45.250449,45.252749,45.253349,45.253849,45.253255,45.25495,45.25585,45.25905,45.26185,45.262449,45.261649,45.261649,45.262949,45.267249,45.269049,45.271849,45.274864,45.276049,45.279049,45.279649,45.281049,45.281049,45.279649,45.281249,45.283249,45.284449,45.284449,45.285649,45.288049,45.291449,45.295549,45.296449,45.298349,45.302549,45.304549,45.304349,45.302749,45.297849,45.296349,45.295049,45.294749,45.295949,45.29915,45.30015,45.304049,45.305749,45.309049,45.309749,45.311549,45.314749,45.315849,45.317549,45.319149,45.320949,45.324249,45.328149,45.328449,45.327749,45.329349,45.330649,45.331449,45.331449,45.332249,45.335149,45.336549,45.339249,45.342049,45.343649,45.344149,45.345249,45.346049,45.347649,45.349949,45.351749,45.352949,45.358149,45.363849,45.366149,45.368449,45.370249,45.371249,45.371849,45.372549,45.373549,45.376849,45.377849,45.375749,45.375649,45.376849,45.378649,45.380649,45.381149,45.381849,45.380449,45.381549,45.383249,45.385449,45.386549,45.387249,45.388849,45.394649,45.396349,45.400349,45.403449,45.405249,45.405449,45.404349,45.405049,45.405749,45.407749,45.417249,45.418749,45.419049,45.418649,45.417349,45.416849,45.419249,45.420549,45.422849,45.426949,45.428249,45.427949,45.428249,45.430649,45.431749,45.433249,45.433999,45.434549,45.434249,45.434349,45.435549,45.438548,45.440716,45.442549,45.443649,45.444049,45.446949,45.450549,45.451849,45.453649,45.455349,45.456549,45.459549,45.461749,45.462449,45.462049,45.462649,45.465349,45.468949,45.470249,45.471983,45.472649,45.476149,45.476929,45.478808,45.480212,45.485194,45.485275,45.48369,45.478877,45.475768,45.472994,45.471716,45.469243,45.468017,45.468636,45.470332,45.473147,45.47445,45.48185,45.48255,45.48305,45.48285,45.48365,45.48605,45.49195,45.49395,45.49795,45.50051,45.49875,45.49825,45.49745,45.49695,45.49705,45.496787,45.49445,45.49295,45.493714,45.49525,45.49655,45.49725,45.501064,45.505691,45.508034,45.509832,45.51263,45.51424,45.515253,45.516641,45.518095,45.518166,45.519428,45.521584,45.523731,45.527588,45.528385,45.530644,45.531392,45.53113,45.530316,45.531459,45.533713,45.535359,45.537249,45.537733,45.537535,45.538808,45.541528,45.54431,45.546732,45.548723,45.549859,45.551701,45.554154,45.555641,45.556725,45.557779,45.559754,45.563101,45.565666,45.567051,45.569936,45.574605,45.576728,45.581893,45.583655,45.589052,45.592508,45.595318,45.596067,45.597026,45.597602,45.597164,45.597302,45.598438,45.602365,45.607454,45.613944,45.615692,45.618006,45.621291,45.622848,45.626112,45.627031,45.626584,45.62586,45.624286,45.622016,45.621577,45.619673,45.619321,45.620066,45.622829,45.624827,45.626368,45.627752,45.628747,45.630668,45.633047,45.634178,45.635036,45.637158,45.638269,45.639391,45.639181,45.639518,45.640653,45.642019,45.644858,45.645151,45.645166,45.645177,45.645171,45.643312,45.643504,45.648871,45.648977,45.651677,45.654794,45.654991,45.655946,45.656147,45.655522,45.655788,45.656275,45.661515,45.663944,45.665119,45.66596,45.66608,45.666867,45.667379,45.668983,45.671177,45.671899,45.671852,45.671165,45.669195,45.669048,45.670148,45.672548,45.677548,45.678348,45.679448,45.681648,45.682348,45.686048,45.690648,45.693748,45.695448,45.696048,45.698648,45.700048,45.701648,45.701548,45.702247,45.702847,45.704747,45.706647,45.713047,45.714547,45.715847,45.717847,45.721447,45.722047,45.721346,45.720646,45.721546,45.720846,45.721046,45.722346,45.723946,45.726146,45.730246,45.732947,45.7372486812962]}]],[[{"lng":[-124.323889,-124.323214,-124.322417,-124.321769,-124.321536,-124.32138,-124.321173,-124.321095,-124.321432,-124.322087,-124.322719,-124.323287,-124.323765,-124.323739,-124.32405,-124.323889],"lat":[42.066648,42.067318,42.067459,42.067305,42.066766,42.066016,42.065612,42.065034,42.064573,42.064226,42.064104,42.064124,42.064438,42.065188,42.065785,42.066648]}],[{"lng":[-124.427244,-124.426878,-124.426074,-124.425349,-124.424934,-124.42496,-124.424856,-124.425038,-124.425556,-124.426126,-124.42693,-124.427251,-124.427244],"lat":[42.314462,42.315107,42.315529,42.315299,42.314781,42.314091,42.313325,42.312826,42.312673,42.312596,42.312846,42.313704,42.314462]}],[{"lng":[-124.47709,-124.476357,-124.476278,-124.475922,-124.475545,-124.474892,-124.475088,-124.474951,-124.474793,-124.475644,-124.475862,-124.476397,-124.476971,-124.477268,-124.47709],"lat":[42.66717,42.667622,42.667957,42.668452,42.668554,42.668029,42.667505,42.666748,42.666384,42.665743,42.665495,42.665888,42.666151,42.666602,42.66717]}],[{"lng":[-124.564595,-124.560403,-124.556645,-124.552441,-124.549492,-124.548023,-124.544561,-124.545058,-124.54051,-124.53648,-124.534433,-124.536195,-124.534589,-124.530438,-124.528298,-124.525653,-124.500141,-124.480938,-124.479636362958,-124.438676,-124.434245,-124.415423,-124.41539,-124.296347,-124.269254,-124.258388,-124.258274,-124.253467,-124.253317,-124.243779,-124.24387,-124.239129,-124.239394,-124.219623,-124.219416,-124.209708,-124.209522,-124.214393,-124.214201,-124.204851,-124.204529,-124.199717,-124.199692,-124.189984,-124.189907,-124.185291,-124.18531,-124.180706,-124.180704,-124.161308,-124.160976,-124.161288,-124.162074,-124.156629,-124.156491,-124.151209,-124.151235,-124.146377,-124.146344,-124.141475,-124.141185,-124.160658,-124.160149,-124.164889,-124.164225,-124.164887,-124.160163,-124.159895,-124.159966,-124.138655,-124.138686,-124.138748,-124.132926,-124.132918,-124.128049,-124.128073,-124.119228,-124.1192,-124.089872,-124.089872,-124.070314,-123.996291,-123.996296,-123.976677,-123.976631,-123.956985,-123.957026,-123.937288,-123.937268,-123.925942,-123.925717,-123.868491,-123.868282,-123.84989,-123.849858,-123.811553,-123.808536,-123.806976,-123.803732,-123.800444,-123.800083,-123.799136,-123.796749,-123.796456,-123.795111,-123.7917,-123.789263,-123.783304,-123.780349,-123.778041,-123.773571,-123.76995,-123.766112,-123.764019,-123.761476,-123.759427,-123.756486,-123.754526,-123.752421,-123.750436,-123.746879,-123.743493,-123.741725,-123.740093,-123.739229,-123.735741,-123.734082,-123.732315,-123.726832,-123.723188,-123.720137,-123.716495,-123.716492,-123.718719,-123.72034,-123.720119,-123.72218,-123.725276,-123.727794,-123.729321,-123.730022,-123.733021,-123.734322,-123.735421,-123.735183,-123.736506,-123.737944,-123.737502,-123.739398,-123.741852,-123.744373,-123.747579,-123.749533,-123.7545,-123.75543,-123.756231,-123.754795,-123.757263,-123.758186,-123.759135,-123.760665,-123.761074,-123.762886,-123.764535,-123.765268,-123.766875,-123.769127,-123.768483,-123.770488,-123.772341,-123.773833,-123.773716,-123.774581,-123.779962,-123.831264,-123.831689,-123.828568,-123.824264,-123.821526,-123.81985,-123.818972,-123.819403,-123.82086,-123.821583,-123.824234,-123.827067,-123.828618,-123.828393,-123.829275,-123.82926,-123.830469,-123.830315,-123.835668,-123.840861,-123.841223,-123.846549,-123.849663,-123.850178,-123.849517,-123.850134,-123.850036,-123.853456,-123.853474,-123.855639,-123.857235,-123.858754,-123.860305,-123.859671,-123.860844,-123.859311,-123.856672,-123.855219,-123.854798,-123.861708,-123.863521,-123.865356,-123.865843,-123.868406,-123.871196,-123.870714,-123.872161,-123.87338,-123.875128,-123.874554,-123.875902,-123.875677,-123.878488,-123.879224,-123.878426,-123.876055,-123.876929,-123.875256,-123.880309,-123.879821,-123.884731,-123.885552,-123.884898,-123.886257,-123.885746,-123.888662,-123.890657,-123.894213,-123.89549,-123.897998,-123.900611,-123.902759,-123.904993,-123.908023,-123.910798,-123.913158,-123.915768,-123.917355,-123.919321,-123.923228,-123.92617,-123.928109,-123.929368,-123.932984,-123.934826,-123.93669,-123.938921,-123.941841,-123.945943,-123.947539,-123.949711,-123.952541,-123.958133,-123.961176,-123.964007,-123.967916,-123.969199,-123.972758,-123.978035,-123.981442,-123.986415,-123.988482,-123.990256,-123.993419,-123.995531,-123.997493,-123.99878,-124.001195,-124.005475,-124.008695,-124.010456,-124.011544,-124.009244,-124.006863,-124.005541,-124.004173,-124.003139,-124.002248,-124.00144,-124.001629,-124.002819,-124.002893,-124.001127,-124.001225,-124.002402,-124.002827,-124.005121,-124.005753,-124.005436,-124.001334,-124.001159,-124.001535,-124.003052,-124.003935,-124.004475,-124.003591,-124.001851,-124.001625,-124.002003,-124.002891,-124.008608,-124.010703,-124.012236,-124.013606,-124.014517,-124.014611,-124.013664,-124.011699,-124.011005,-124.009677,-124.009174,-124.009457,-124.012825,-124.010968,-124.009216,-124.008668,-124.00863,-124.009651,-124.011666,-124.013057,-124.013345,-124.016251,-124.017488,-124.02036,-124.021521,-124.02306,-124.026168,-124.028557,-124.030212,-124.032309,-124.035718,-124.036828,-124.035796,-124.037047,-124.036177,-124.037333,-124.036998,-124.038842,-124.041983,-124.041579,-124.039586,-124.038584,-124.03726,-124.037266,-124.035489,-124.035001,-124.036171,-124.036265,-124.033565,-124.032262,-124.030141,-124.028712,-124.026947,-124.021961,-124.01908,-124.017452,-124.010986,-124.008637,-123.998549,-123.995141,-123.992913,-123.990456,-123.986317,-123.984686,-123.978917,-123.972898,-123.970015,-123.966661,-123.962628,-123.956029,-123.953011,-123.94959,-123.944632,-123.940407,-123.936538,-123.935313,-123.93467,-123.933213,-123.930195,-123.928303,-123.925893,-123.924437,-123.923302,-123.920408,-123.916606,-123.915017,-123.910437,-123.907007,-123.903527,-123.900219,-123.897208,-123.895094,-123.892651,-123.891321,-123.888026,-123.884354,-123.884467,-123.878816,-123.877852,-123.877858,-123.878522,-123.878927,-123.876337,-123.87675,-123.875264,-123.87318,-123.871837,-123.871462,-123.869582,-123.866394,-123.864168,-123.863558,-123.859863,-123.857646,-123.856118,-123.853846,-123.851287,-123.849054,-123.84557,-123.845982,-123.8417,-123.839496,-123.841454,-123.844167,-123.845404,-123.847483,-123.847595,-123.847315,-123.843557,-123.843007,-123.83972,-123.837879,-123.836606,-123.838419,-123.835287,-123.832956,-123.832684,-123.830947,-123.829732,-123.828031,-123.825321,-123.825742,-123.826159,-123.82382,-123.823743,-123.822177,-123.820847,-123.817359,-123.814997,-123.815251,-123.813816,-123.811992,-123.811604,-123.810017,-123.812203,-123.809421,-123.805938,-123.803515,-123.79962,-123.798159,-123.796383,-123.7922,-123.79252,-123.794003,-123.793075,-123.793288,-123.792834,-123.791154,-123.790462,-123.793144,-123.796702,-123.797063,-123.799931,-123.802202,-123.805991,-123.808307,-123.811361,-123.812417,-123.813891,-123.816794,-123.818915,-123.820471,-123.820407,-123.821531,-123.820857,-123.821288,-123.81719,-123.816316,-123.813505,-123.813199,-123.815092,-123.814536,-123.814793,-123.812603,-123.815726,-123.817915,-123.820841,-123.821199,-123.822386,-123.823911,-123.826311,-123.827684,-123.836854,-123.840232,-123.842871,-123.844724,-123.849528,-123.85081,-123.853382,-123.855572,-123.85591,-123.857192,-123.858549,-123.856075,-123.854857,-123.850176,-123.846258,-123.842828,-123.839241,-123.83883,-123.840149,-123.840156,-123.838249,-123.836688,-123.835422,-123.832155,-123.831124,-123.830979,-123.829967,-123.829528,-123.82572,-123.821973,-123.82251,-123.824877,-123.825624,-123.8271,-123.826921,-123.828112,-123.827264,-123.829397,-123.830968,-123.834173,-123.834302,-123.834601,-123.840227,-123.841559,-123.840893,-123.838755,-123.838574,-123.840118,-123.840683,-123.840693,-123.843151,-123.846851,-123.848497,-123.84909,-123.848952,-123.847758,-123.845611,-123.845386,-123.844471,-123.841723,-123.836151,-123.837574,-123.837496,-123.83653,-123.837541,-123.840103,-123.840068,-123.839963,-123.839529,-123.838849,-123.838592,-123.83774,-123.83615,-123.834613,-123.833287,-123.832066,-123.830213,-123.827325,-123.827502,-123.829295,-123.828843,-123.826343,-123.824441,-123.821615,-123.818161,-123.818981,-123.820663,-123.822037891998,-123.834208,-123.967045984176,-123.999248,-124.084956,-124.102532,-124.121365,-124.211605,-124.21894,-124.227079,-124.230459,-124.231537,-124.237242,-124.239121787196,-124.239716,-124.244725,-124.245485117115,-124.248523,-124.254028,-124.255035,-124.259821,-124.263887,-124.265820787596,-124.270094423003,-124.270464,-124.270791201675,-124.277703,-124.279883,-124.281677,-124.282347205885,-124.28264,-124.286679,-124.288729760161,-124.291269,-124.290870418472,-124.289783836142,-124.289478,-124.291670598908,-124.292595,-124.295473,-124.294998,-124.296801,-124.299649,-124.30084,-124.303991,-124.308571,-124.313319,-124.313628940036,-124.316250114133,-124.316276,-124.316823741191,-124.319738,-124.319924107201,-124.320203,-124.320698,-124.323806521608,-124.324785,-124.325767444958,-124.328858,-124.329066329506,-124.332127,-124.335162,-124.34101,-124.342669,-124.342058,-124.344673,-124.348476,-124.351083,-124.354027,-124.352136,-124.350766,-124.351193,-124.352704,-124.355319,-124.356229,-124.357122,-124.356177,-124.353486,-124.354239,-124.351535,-124.351784,-124.356493,-124.356243,-124.358499,-124.361563,-124.366028,-124.366832,-124.363389,-124.360318,-124.361972,-124.364606,-124.361748,-124.362442,-124.361009,-124.363555,-124.366106,-124.368606,-124.370319,-124.373264,-124.376215,-124.375337,-124.375697,-124.377867,-124.378158,-124.37662,-124.377762,-124.382256,-124.383633,-124.386301,-124.388426,-124.389162,-124.392505,-124.392458,-124.397747,-124.400795,-124.401549,-124.404214,-124.410982,-124.414149,-124.411534,-124.411461,-124.408514,-124.408226331137,-124.408215,-124.41051,-124.412919,-124.41131,-124.411815,-124.41978,-124.418591,-124.420557,-124.425264,-124.426435,-124.427782,-124.431686,-124.433063,-124.431438,-124.431495,-124.429288,-124.427222,-124.428752,-124.426885,-124.426354,-124.424759,-124.424765038491,-124.426155,-124.426131310332,-124.426017646233,-124.425647484431,-124.425499,-124.428734,-124.42983957245,-124.431134,-124.431273499676,-124.435892,-124.43512,-124.433983499306,-124.431748,-124.423836,-124.422038,-124.42492,-124.425631,-124.422012,-124.421981,-124.422394,-124.425816,-124.425039,-124.423084,-124.421356,-124.419964,-124.421381,-124.422195,-124.420076,-124.411362,-124.410982713025,-124.406126984569,-124.405834027084,-124.399829,-124.399133,-124.397684,-124.392657,-124.391571,-124.389977,-124.392305,-124.394426,-124.394815,-124.393663,-124.395052,-124.398319,-124.400031,-124.401954,-124.404933,-124.408289,-124.403855,-124.401716,-124.40433,-124.40112,-124.401498,-124.399421,-124.401385,-124.401177,-124.405547,-124.404841,-124.406282,-124.407266509123,-124.409431,-124.411308,-124.413764,-124.409836,-124.413119,-124.416774,-124.422747,-124.429195,-124.434688,-124.438875,-124.45074,-124.451484,-124.447873851781,-124.447487,-124.449417,-124.452248,-124.455263,-124.454984,-124.459643,-124.459797,-124.461619,-124.462569,-124.46445,-124.467766,-124.467559,-124.473864,-124.478516461253,-124.482158,-124.491225646384,-124.491679,-124.498473,-124.499122,-124.503681,-124.503784994074,-124.505236,-124.508394,-124.511286,-124.513663,-124.514669,-124.514311,-124.513602,-124.516177,-124.52046,-124.524439,-124.532333828514,-124.536073,-124.544179,-124.552845,-124.559298,-124.564487,-124.566244,-124.564595],"lat":[42.840876,42.838038,42.838429,42.840568,42.843616,42.847981,42.851377,42.854086,42.856855,42.862354,42.869664,42.87227,42.875403,42.876082,42.879534,42.879986,42.917502,42.951495,42.9543325389089,42.953817,42.95369,42.953769,42.955232,42.954621,42.954877,42.954946,42.951152,42.951314,42.943809,42.9443,42.940652,42.940948,42.933751,42.933782,42.918156,42.918227,42.911125,42.911141,42.904006,42.90391,42.900327,42.900275,42.896656,42.896696,42.893032,42.893047,42.885919,42.885998,42.88245,42.883499,42.876642,42.874824,42.86973,42.869642,42.8658,42.86581,42.862067,42.862081,42.850511,42.850586,42.828475,42.828288,42.817761,42.817825,42.804038,42.790006,42.790087,42.768326,42.739947,42.739956,42.729928,42.671115,42.671119,42.666697,42.666684,42.671123,42.671129,42.678339,42.678208,42.685454,42.685327,42.685651,42.7001,42.700118,42.714558,42.714569,42.729051,42.729097,42.739666,42.73971,42.774514,42.77484,42.781921,42.781821,42.788994,42.788837,42.787868,42.786983,42.787536,42.78959,42.790094,42.790954,42.79277,42.792936,42.793699,42.797302,42.798147,42.799426,42.798915,42.797665,42.797407,42.794568,42.793468,42.792059,42.792391,42.79107,42.789808,42.789804,42.788245,42.787735,42.788228,42.787971,42.786552,42.783343,42.782865,42.782516,42.781753,42.780131,42.781526,42.783945,42.784164,42.785376,42.784061,42.782694,42.780911,42.77747,42.775435,42.774115,42.773809,42.773041,42.771115,42.768945,42.765701,42.764575,42.762842,42.760655,42.757294,42.753118,42.751499,42.747987,42.746335,42.742576,42.742038,42.732339,42.731791,42.728067,42.72596,42.720584,42.720093,42.717906,42.717138,42.715876,42.715028,42.713543,42.711145,42.709109,42.708063,42.705989,42.704685,42.704493,42.702858,42.700834,42.700429,42.694025,42.632313,42.625798,42.625339,42.622398,42.619743,42.615779,42.614786,42.612446,42.611139,42.60913,42.607575,42.607046,42.606107,42.604497,42.601793,42.599452,42.598106,42.595067,42.591633,42.588961,42.587864,42.586258,42.583353,42.581966,42.579542,42.57809,42.574579,42.570941,42.569663,42.567228,42.566509,42.564143,42.563091,42.562393,42.559989,42.556281,42.553775,42.551791,42.549736,42.544375,42.542232,42.541989,42.539031,42.536341,42.535158,42.534203,42.533372,42.531188,42.530067,42.528675,42.527805,42.526195,42.524647,42.522047,42.519959,42.516799,42.516203,42.51372,42.511588,42.509885,42.508401,42.507625,42.506279,42.505436,42.504233,42.502978,42.500538,42.499925,42.498997,42.499058,42.498416,42.499584,42.499165,42.496903,42.497435,42.496146,42.495396,42.495798,42.494737,42.495021,42.494335,42.494563,42.496048,42.496023,42.497079,42.500293,42.50113,42.500867,42.501334,42.500474,42.500487,42.499311,42.498238,42.498816,42.49732,42.497228,42.496028,42.49535,42.49761,42.497167,42.498353,42.501979,42.501621,42.499599,42.500832,42.500694,42.499962,42.496875,42.496918,42.496147,42.494019,42.489628,42.489421,42.488828,42.487376,42.486682,42.485828,42.48466,42.480858,42.477902,42.473912,42.47166,42.467382,42.464829,42.46302,42.462667,42.462041,42.461239,42.458572,42.455054,42.453976,42.453402,42.451972,42.451543,42.451153,42.447785,42.44602,42.445291,42.444308,42.443527,42.441928,42.439908,42.437069,42.435068,42.434189,42.432342,42.430707,42.429269,42.428504,42.427851,42.427216,42.426465,42.423994,42.421801,42.421399,42.420822,42.419622,42.418034,42.416175,42.413114,42.412677,42.412176,42.410959,42.410041,42.408194,42.407621,42.407409,42.403308,42.402883,42.403283,42.401762,42.398726,42.396407,42.395766,42.394949,42.393818,42.392623,42.388837,42.387656,42.385912,42.384751,42.383094,42.382673,42.380525,42.377858,42.375876,42.374389,42.3702,42.367455,42.365481,42.363636,42.361049,42.359199,42.36166,42.361384,42.35977,42.358541,42.359016,42.358488,42.358487,42.357659,42.357941,42.359409,42.358449,42.358505,42.357979,42.357324,42.35774,42.356714,42.357866,42.356991,42.356544,42.358058,42.360604,42.361625,42.35983,42.355761,42.354338,42.353759,42.352612,42.352008,42.351045,42.348835,42.346469,42.346592,42.346709,42.347884,42.347644,42.349314,42.349234,42.350937,42.351422,42.353293,42.353095,42.351454,42.347602,42.346072,42.345667,42.344851,42.342428,42.341049,42.335279,42.333167,42.330669,42.330071,42.327633,42.327455,42.324799,42.322796,42.322362,42.321478,42.32046,42.31854,42.318688,42.319933,42.320742,42.320577,42.319125,42.318327,42.316923,42.313281,42.312202,42.310752,42.307854,42.305638,42.303538,42.301983,42.299219,42.298507,42.297656,42.296282,42.294693,42.290556,42.288537,42.286277,42.285622,42.282991,42.281652,42.279859,42.279255,42.276123,42.271824,42.270973,42.268693,42.266983,42.264365,42.264665,42.264096,42.262603,42.259439,42.254797,42.253495,42.251246,42.24779,42.24399,42.241494,42.241176,42.239436,42.240204,42.238232,42.237497,42.237623,42.233619,42.231155,42.230098,42.22781,42.224314,42.222173,42.220457,42.22111,42.219878,42.218962,42.216388,42.215738,42.216849,42.217284,42.214644,42.212667,42.20573,42.203769,42.2036,42.198974,42.195498,42.193959,42.190924,42.189849,42.188225,42.185435,42.183987,42.178235,42.174122,42.172501,42.170464,42.169651,42.166047,42.16438,42.163027,42.161167,42.159333,42.157656,42.157509,42.155855,42.154378,42.152913,42.149668,42.146369,42.145819,42.144503,42.143597,42.141392,42.138323,42.137426,42.135116,42.133224,42.130628,42.126945,42.125204,42.125599,42.124671,42.122593,42.119291,42.116779,42.113334,42.109619,42.10885,42.107914,42.103609,42.101345,42.100377,42.097285,42.093188,42.086567,42.085321,42.084441,42.080498,42.077493,42.074796,42.073675,42.072475,42.069596,42.068955,42.066002,42.063791,42.063187,42.060507,42.059225,42.058515,42.057965,42.057618,42.055504,42.05248,42.051934,42.048965,42.047798,42.046646,42.045069,42.043009,42.040136,42.03699,42.036426,42.03336,42.031385,42.029292,42.02734,42.025558,42.024006,42.020306,42.018736,42.018098,42.017586,42.01704,42.016469,42.015304,42.01489,42.013911,42.012811,42.012042,42.011666,42.011552,42.008438,42.006535,42.004951,42.002504,42.00188,42.000564,41.999935,41.998791,41.998563,41.996727,41.9956172960188,41.996116,41.9961337074385,41.996138,41.996662,41.99681,41.997015,41.99846,42.007916,42.0125,42.013206,42.015156,42.018688,42.0225828218138,42.023814,42.02522,42.0253761062006,42.026,42.029218,42.031573,42.034578,42.040923,42.042284325311,42.0452928294818,42.045553,42.0455717127357,42.045967,42.044316,42.04427,42.0450543427124,42.045397,42.045346,42.0447352398387,42.043979,42.044650646595,42.0464816379254,42.046997,42.0480183838992,42.048449,42.04764,42.048876,42.051343,42.051736,42.055806,42.060886,42.064801,42.065277,42.0655839003804,42.0681793680017,42.068205,42.0688524167975,42.072297,42.0730712835003,42.07423159375,42.076291,42.0803783978765,42.081665,42.0825671223039,42.085405,42.0854402420363,42.085958,42.087445,42.092929,42.094295,42.097922,42.100039,42.100215,42.100213,42.103539,42.104692,42.108014,42.110662,42.113293,42.113635,42.114952,42.118016,42.119711,42.121595,42.124095,42.129796,42.134965,42.139691,42.142132,42.143848,42.143767,42.152343,42.15845,42.158588,42.162272,42.166086,42.169219,42.171991,42.176704,42.180752,42.182839,42.183612,42.18862,42.191349,42.195752,42.196381,42.201109,42.206111,42.208971,42.21119,42.213643,42.218809,42.223888,42.22716,42.228076,42.229427,42.232105,42.233345,42.23515,42.239938,42.240081,42.242802,42.245129,42.250547,42.252164,42.254115,42.257678,42.260588,42.2796049322341,42.280354,42.298652,42.301818,42.305175,42.307393,42.315527,42.316757,42.320412,42.322026,42.319569,42.318857,42.321101,42.323976,42.329094,42.33072,42.331746,42.33488,42.338918,42.341532,42.352029,42.376993,42.3770733517197,42.395569,42.3960674941724,42.3984592917688,42.4062484892051,42.409373,42.417776,42.4206421965775,42.423998,42.4243844827095,42.43718,42.441926,42.443810056608,42.447516,42.45735,42.461226,42.462132,42.46346,42.465439,42.470417,42.475608,42.476345,42.478611,42.478952,42.485061,42.48998,42.491737,42.496427,42.499678,42.513378,42.5141969546748,42.5246814209893,42.5253139734301,42.53828,42.543366,42.546728,42.561716,42.568218,42.574758,42.576755,42.577054,42.578512,42.582061,42.584732,42.589587,42.591926,42.592077,42.591139,42.594815,42.594702,42.597676,42.601175,42.601872,42.610005,42.618079,42.620088,42.627192,42.628966,42.631415,42.636517,42.6370463026186,42.63821,42.640715,42.645795,42.649485,42.657934,42.661594,42.663285,42.666605,42.669958,42.670837,42.675798,42.677787,42.6840670501793,42.68474,42.689819,42.691953,42.694369,42.697079,42.702166,42.707486,42.711488,42.714106,42.717283,42.719533,42.723821,42.732671,42.7351234428017,42.737043,42.7415630136265,42.741789,42.741077,42.738606,42.739758,42.7395367701631,42.73645,42.735337,42.733124,42.732949,42.736806,42.744038,42.745827,42.755653,42.770865,42.789793,42.8063386170557,42.814175,42.822958,42.830144,42.834298,42.834164,42.836392,42.840876]}]],[[{"lng":[-124.150267,-124.144075,-124.138326,-124.137178,-124.137081915707,-124.136941,-124.134251,-124.133271736676,-124.130608,-124.125752,-124.125748897347,-124.123975,-124.125438,-124.124083,-124.123643,-124.127073,-124.127758,-124.125824,-124.123876,-124.125868,-124.128882,-124.12741,-124.125272,-124.122668,-124.117006,-124.116717,-124.115864601151,-124.114424,-124.115671,-124.114719,-124.113212,-124.111054,-124.112945,-124.115309,-124.114293,-124.111681,-124.111766,-124.108945,-124.109744,-124.114869,-124.115953,-124.114690718599,-124.114043752426,-124.083717,-124.063303,-124.063259,-123.941072,-123.941075,-123.798955,-123.775598,-123.767931,-123.723588,-123.715386,-123.715377,-123.593513,-123.59329,-123.573614,-123.556039,-123.532858,-123.472186,-123.471685,-123.455686,-123.451272,-123.371411,-123.371408,-123.367696,-123.328667,-123.288655,-123.248679,-123.230044,-123.224885,-123.200385,-123.180388,-123.179931,-123.175977,-123.175133,-123.174174,-123.174054,-123.174938,-123.17501,-123.177701,-123.178903,-123.17878,-123.175342,-123.174204,-123.171308,-123.169341,-123.166868,-123.163604,-123.159533,-123.156542,-123.153386,-123.1512,-123.15034,-123.150627,-123.152389,-123.155708,-123.15911,-123.15787,-123.160434,-123.164226,-123.166002,-123.165428,-123.127696,-123.07167,-123.060853,-123.040799,-123.038427,-123.038121,-122.985827,-122.97952,-122.979199,-122.905755,-122.903999,-122.884125,-122.872923,-122.865545,-122.865465,-122.861992,-122.860134,-122.856452,-122.852796,-122.849343,-122.846854,-122.845096,-122.843403,-122.839919,-122.837442,-122.835135,-122.833148,-122.830451,-122.830352,-122.828717,-122.829074,-122.82527,-122.823015,-122.819352,-122.817065,-122.814416,-122.811705,-122.807156,-122.804727,-122.802825,-122.798259,-122.795605,-122.791085,-122.788615,-122.784205,-122.781625,-122.779134,-122.776319,-122.774074,-122.771265,-122.768734,-122.762735,-122.758905,-122.758014,-122.753255,-122.749834,-122.746347,-122.744584,-122.742034,-122.738128,-122.731121,-122.727574,-122.725697,-122.725089,-122.724937,-122.722692,-122.721184,-122.717134,-122.71472,-122.710473,-122.706473,-122.704483,-122.700224,-122.696076,-122.696412,-122.693973,-122.692063,-122.689353,-122.686703,-122.683333,-122.680863,-122.678543,-122.676247,-122.674283,-122.670787,-122.668915,-122.665931,-122.663697,-122.657909,-122.655773,-122.652553,-122.651583,-122.646853,-122.64679,-122.644542,-122.645763,-122.64493,-122.644082,-122.640716,-122.639699,-122.637437,-122.631432,-122.624857,-122.622312,-122.617391,-122.611738,-122.608342,-122.604621,-122.599071,-122.593471,-122.591986,-122.588363,-122.585624,-122.582028,-122.579831,-122.57677,-122.5754,-122.575169,-122.57778,-122.577232,-122.573085,-122.570153,-122.567339,-122.565493,-122.562413,-122.558723,-122.554953,-122.551917,-122.549707,-122.548543,-122.545794,-122.543711,-122.539632,-122.535382,-122.533745,-122.532614,-122.532942,-122.531171,-122.529542,-122.528191,-122.522442,-122.519391,-122.513425,-122.512251,-122.511964,-122.510561,-122.507203,-122.503182,-122.499506,-122.497,-122.492272,-122.488381,-122.484305,-122.479635,-122.478045,-122.47368,-122.470829,-122.468798,-122.465628,-122.463518,-122.457892,-122.456337,-122.451074,-122.448436,-122.445272,-122.442879,-122.438796,-122.434885,-122.430218,-122.426446,-122.425081,-122.425089,-122.404748,-122.404781,-122.384561,-122.38457,-122.379589,-122.373799,-122.371128,-122.367197,-122.364257,-122.363745,-122.361244,-122.358069,-122.35689,-122.355447,-122.354488,-122.352623,-122.347714,-122.340612,-122.339923,-122.336791,-122.334249,-122.331857,-122.330673,-122.327313,-122.328729,-122.325744,-122.328531,-122.331478,-122.332446,-122.32949,-122.32715,-122.264527,-122.264527,-122.228368,-122.027996,-122.028016,-121.964517,-121.960126,-121.799426,-121.797461,-121.794053,-121.793299,-121.789648,-121.78928,-121.790457,-121.789792,-121.787806,-121.78766,-121.786562,-121.785421,-121.785753,-121.783459,-121.780239,-121.778226,-121.777905,-121.779552,-121.78406,-121.785251,-121.783458,-121.785536,-121.785631,-121.78366,-121.78161,-121.782576,-121.780652,-121.781334,-121.782174,-121.78121,-121.781511,-121.7791,-121.777485,-121.774525,-121.774047,-121.774429,-121.773407,-121.77429,-121.776464,-121.777556,-121.779738,-121.778813,-121.777229,-121.773196,-121.771647,-121.772913,-121.772426,-121.776708,-121.77888,-121.782017,-121.781132,-121.781069,-121.78342,-121.783142,-121.78402,-121.782676,-121.779553,-121.772735,-121.773339,-121.772532,-121.773003,-121.771473,-121.771649,-121.770604,-121.771345,-121.769381,-121.76807,-121.768446,-121.769573,-121.770003,-121.769311,-121.769874,-121.769259,-121.771349,-121.772156,-121.771755,-121.772481,-121.773384,-121.776779,-121.777087,-121.779395,-121.779748,-121.784547,-121.787098,-121.789211,-121.789458,-121.790365,-121.793616,-121.796501,-121.799227,-121.801513,-121.802225,-121.805421,-121.81219,-121.814176,-121.815895,-121.817468,-121.820056,-121.821394,-121.825726,-121.830059,-121.832225,-121.834472,-121.835193,-121.832785,-121.832623,-121.82955,-121.828042,-121.827324,-121.825487,-121.825042,-121.825381,-121.823599,-121.822016,-121.822384,-121.824299,-121.824533,-121.825663,-121.827099,-121.829103,-121.829239,-121.833384,-121.831355,-121.830273,-121.828402,-121.832449,-121.835458,-121.83679,-121.835963,-121.837282,-121.843135,-121.845087,-121.84511,-121.84356,-121.841469,-121.836722,-121.841387,-121.84539,-121.848898,-121.851462,-121.853218,-121.857063,-121.859711,-121.85998,-121.858022,-121.859435,-121.859497,-121.858124,-121.858174,-121.859205,-121.858102,-121.858364,-121.860927,-121.861569,-121.861353,-121.862399,-121.861553,-121.865338,-121.864863,-121.86649,-121.868366,-121.869966,-121.865855,-121.865553,-121.866636,-121.86838,-121.868029,-121.869385,-121.871602,-121.876903,-121.884325,-121.888545,-121.891442,-121.892574,-121.893921,-121.898393,-121.899743,-121.901482,-121.904318,-121.905856,-121.907868,-121.911588,-121.913613,-121.916265,-121.916801,-121.920359,-121.923578,-121.928213,-121.929404,-121.931438,-121.934322,-121.936964,-121.939333,-121.93656,-121.931479,-121.931269,-121.932415,-121.937524,-121.94233,-121.943782,-121.94521,-121.947402,-121.952256,-121.952638,-121.951391,-121.95134,-121.95296,-121.956466,-121.9575,-121.959462,-121.961483,-121.962046,-121.965431,-121.968548,-121.972931,-121.972875,-121.975113,-121.975358,-121.97542,-121.974896,-121.976173,-121.976081,-121.974401,-121.9744,-121.975192,-121.974803,-121.975226,-121.976052,-121.976763,-121.977799,-121.976611,-121.975264,-121.973657,-121.973495,-121.974756,-121.974278,-121.975565,-121.97546,-121.974371,-121.97073,-121.967767,-121.963754,-121.964537,-121.964924,-121.964404,-121.966654,-121.968382,-121.967348,-121.967157,-121.967844,-121.96739,-121.966186,-121.964026,-121.960507,-121.962544,-121.96538,-121.968894,-121.969609,-121.969048,-121.965522,-121.961437,-121.963562,-121.967095,-121.968164,-121.970119,-121.971991,-121.970437,-121.974141,-121.974351,-121.975677,-121.981248,-121.981007,-121.979648,-121.978289,-121.975173,-121.975571,-121.973689,-121.975456,-121.977949,-121.978262,-121.977,-121.975842,-121.973588,-121.973125,-121.974629,-121.975179,-121.974607,-121.973498,-121.971795,-121.967179,-121.966917,-121.967826,-121.972422,-121.973084,-121.972889,-121.973488,-121.976117,-121.978224,-121.979573,-121.979319,-121.980832,-121.981099,-121.983119,-121.98475,-121.984519,-121.985716,-121.986267,-121.985717,-121.98691,-121.985633,-121.982442,-121.980619,-121.980509,-121.978135,-121.974541,-121.973742,-121.972147,-121.969516,-121.967951,-121.9657,-121.964918,-121.968364,-121.977014,-121.981146,-121.98666,-121.99214,-121.995526,-121.997755,-122.000095,-122.001623,-122.001944,-122.002362,-122.003068,-122.010965,-122.013037,-122.016941,-122.020002,-122.026748,-122.02914,-122.034958,-122.035993,-122.038966,-122.04094,-122.042529,-122.046115,-122.047708,-122.049781,-122.056872,-122.059263,-122.061334,-122.064361,-122.067707,-122.071531,-122.072724,-122.070284,-122.071291,-122.076149,-122.078379,-122.080848,-122.0826,-122.086742,-122.092318,-122.093513,-122.094982,-122.094779,-122.096613,-122.099228,-122.103544,-122.105215,-122.106566,-122.109553,-122.110753,-122.112224,-122.116677,-122.124336,-122.125264,-122.12716,-122.129193,-122.131009,-122.131616,-122.133128,-122.133674,-122.135109,-122.136349,-122.138746,-122.139145,-122.140828,-122.142806,-122.142867,-122.141768,-122.140082,-122.140274,-122.143532,-122.144946,-122.146991,-122.146222,-122.147807,-122.149534,-122.148688,-122.147726,-122.145139,-122.142355,-122.138758,-122.132474,-122.131583,-122.129797,-122.129678,-122.130579,-122.128721,-122.130529,-122.133453,-122.133547,-122.130937,-122.131417,-122.133046,-122.133356,-122.132331,-122.132848,-122.134547,-122.13445,-122.135334,-122.136871,-122.138917,-122.140492,-122.140161,-122.13888,-122.137364,-122.136458,-122.138412,-122.138978,-122.136912,-122.138621,-122.145365,-122.147339,-122.146301,-122.148739,-122.151573,-122.15296,-122.149927,-122.147305,-122.14421,-122.14345,-122.140676,-122.138814,-122.13754,-122.132435,-122.132034,-122.270653,-122.27067,-122.447124,-122.508441,-122.508438,-122.622914,-122.622946,-122.741716,-122.741317,-122.741914,-122.741845,-122.771564,-122.776409,-122.781518,-122.833744,-122.892765,-122.9124,-122.932533,-122.935501,-122.970915,-122.987618,-122.987626,-123.107475,-123.107672,-123.107318,-123.137211,-123.13733,-123.137588,-123.137646,-123.138001,-123.137319,-123.147539,-123.153653,-123.185986,-123.312001,-123.313129,-123.348246,-123.3482,-123.397831,-123.411426,-123.470371,-123.470251,-123.529153,-123.529005,-123.579689,-123.57958,-123.619574,-123.619367,-123.619621,-123.619012,-123.658909,-123.658767,-123.703628,-123.7038,-123.734733,-123.75871,-123.81007,-123.827004,-123.827036,-123.831984,-123.832118,-123.837073,-123.837143,-123.842059,-123.842136,-123.847057,-123.847397,-123.852268,-123.852602,-123.862381,-123.862685,-123.872399,-123.872566,-123.872667,-123.877485,-123.877749,-123.882553,-123.882804,-123.897197,-123.897407,-123.902195,-123.902391,-123.907166,-123.916158,-123.925917,-123.926089,-123.925479,-123.934708,-123.946529,-123.946294,-123.96592,-123.98581,-124.005944,-124.025781,-124.064585,-124.064614,-124.098533,-124.101667,-124.102125,-124.104167,-124.138807,-124.158728145934,-124.150267],"lat":[43.91085,43.958437,43.995325,44.013606,44.0174173436398,44.023007,44.042125,44.0485338927156,44.065967,44.092848,44.0928706736351,44.105834,44.11123,44.114417,44.117217,44.119776,44.122027,44.12613,44.1341,44.136034,44.137549,44.139211,44.141892,44.142519,44.171913,44.185962,44.1904979663121,44.198164,44.206554,44.2167,44.221742,44.235071,44.24275,44.245977,44.249408,44.255421,44.260489,44.265475,44.270597,44.272721,44.274641,44.276194,44.2769899702691,44.276117,44.275094,44.277178,44.277375,44.282951,44.283304,44.283547,44.283606,44.283944,44.283946,44.280267,44.276699,44.281915,44.282597,44.281402,44.281523,44.281471,44.281185,44.280647,44.280496,44.281021,44.283725,44.283719,44.283725,44.283724,44.283726,44.283725,44.283725,44.283725,44.283725,44.283431,44.277606,44.275152,44.267131,44.266608,44.261582,44.259514,44.255751,44.253056,44.251601,44.248645,44.248114,44.247537,44.245854,44.240113,44.235315,44.233078,44.233269,44.231343,44.228779,44.226627,44.2252,44.222689,44.219947,44.214094,44.211612,44.207989,44.204725,44.201877,44.200071,44.200016,44.200024,44.200077,44.200136,44.200745,44.200129,44.200572,44.200613,44.200616,44.200736,44.259129,44.258894,44.258952,44.25898,44.287317,44.286662,44.285586,44.285373,44.285539,44.284298,44.284282,44.283601,44.281187,44.281352,44.282129,44.283455,44.282285,44.282166,44.28097,44.278525,44.277106,44.276858,44.27432,44.275804,44.27639,44.276269,44.27983,44.284171,44.283952,44.284435,44.284724,44.285708,44.285866,44.28565,44.283459,44.2834,44.283909,44.283816,44.284609,44.286729,44.288119,44.290537,44.290066,44.289137,44.28724,44.28473,44.285909,44.286051,44.287467,44.285828,44.28823,44.286529,44.286668,44.285639,44.283162,44.282775,44.281778,44.280931,44.281603,44.27937,44.279319,44.27822,44.279938,44.278893,44.277019,44.275771,44.275387,44.273948,44.27373,44.274459,44.274128,44.27327,44.273535,44.271849,44.270633,44.268902,44.269093,44.270062,44.271093,44.269688,44.26881,44.267078,44.266384,44.264246,44.260088,44.25681,44.253458,44.252551,44.251096,44.249263,44.249458,44.249189,44.25002,44.249852,44.247801,44.246867,44.245298,44.244228,44.24447,44.244427,44.242953,44.24123,44.239178,44.238046,44.237819,44.236587,44.235358,44.234628,44.22979,44.228044,44.229146,44.228689,44.229347,44.230575,44.231617,44.230568,44.231089,44.232295,44.235344,44.235588,44.235022,44.235184,44.23431,44.23486,44.233706,44.231511,44.22987,44.228633,44.226715,44.226498,44.228581,44.230717,44.231535,44.22982,44.227819,44.2262,44.223448,44.22167,44.222611,44.222308,44.219967,44.221927,44.22148,44.219132,44.219196,44.222406,44.222878,44.222599,44.223039,44.222209,44.220805,44.219036,44.21805,44.216748,44.217388,44.218543,44.21871,44.221306,44.220296,44.218544,44.218198,44.220657,44.22058,44.216938,44.217063,44.211013,44.20944,44.210413,44.209667,44.20938,44.21102,44.211945,44.211748,44.213326,44.216311,44.217265,44.219183,44.220742,44.221659,44.221577,44.224454,44.227001,44.226938,44.227653,44.229606,44.231189,44.234719,44.237579,44.238506,44.240603,44.243382,44.249537,44.252841,44.25263,44.253847,44.253847,44.253818,44.256164,44.257238,44.257313,44.25828,44.254613,44.252707,44.25152,44.249326,44.247071,44.245463,44.243505,44.240762,44.234981,44.233215,44.230903,44.229239,44.225653,44.224606,44.221483,44.218877,44.216985,44.215751,44.212595,44.209599,44.208394,44.207811,44.20542,44.205326,44.203014,44.201958,44.199392,44.198499,44.196545,44.194809,44.194255,44.192042,44.190792,44.190156,44.187627,44.185623,44.183762,44.181082,44.178687,44.17565,44.173127,44.171595,44.169488,44.167583,44.164798,44.16353,44.159933,44.160744,44.159765,44.158315,44.155202,44.154322,44.151746,44.148462,44.14625,44.145276,44.139831,44.137039,44.134981,44.133307,44.131314,44.12676,44.125254,44.123916,44.118178,44.115245,44.11205,44.110428,44.108132,44.106409,44.10395,44.10134,44.099603,44.095897,44.094858,44.091034,44.089686,44.088537,44.085138,44.082353,44.080121,44.077214,44.076541,44.075019,44.072607,44.071873,44.067131,44.061662,44.060089,44.05684,44.052691,44.052251,44.053164,44.052956,44.051201,44.051832,44.050905,44.047911,44.044147,44.041365,44.041599,44.039744,44.037024,44.035576,44.033319,44.03106,44.029158,44.024752,44.023129,44.021567,44.019426,44.016406,44.012359,44.010777,44.008066,44.004224,44.002135,43.99759,43.995395,43.994496,43.991094,43.990573,43.989247,43.988727,43.987296,43.987284,43.985983,43.984745,43.982647,43.979073,43.976239,43.975021,43.973445,43.972587,43.971232,43.969574,43.967175,43.967269,43.966335,43.966596,43.965248,43.961526,43.958507,43.954542,43.953806,43.952781,43.951404,43.948783,43.947384,43.945593,43.944787,43.943048,43.941197,43.939036,43.937103,43.935837,43.932315,43.930281,43.925795,43.923898,43.923286,43.920959,43.919789,43.917106,43.915837,43.914504,43.911859,43.911681,43.907841,43.907985,43.90867,43.908658,43.9109,43.910784,43.912269,43.914537,43.9159,43.914863,43.913363,43.913876,43.912326,43.912917,43.912347,43.911488,43.911171,43.908566,43.909181,43.907347,43.905543,43.904908,43.903343,43.900866,43.900588,43.898992,43.897504,43.894213,43.890663,43.886262,43.884603,43.882058,43.881049,43.878063,43.876552,43.875554,43.873938,43.871681,43.870083,43.868549,43.868195,43.866226,43.865003,43.865763,43.864554,43.861156,43.859351,43.85757,43.855444,43.851773,43.851243,43.848478,43.846044,43.843043,43.84128,43.83999,43.838518,43.83585,43.834914,43.830226,43.828526,43.827615,43.827875,43.829345,43.827147,43.821219,43.817418,43.812541,43.811768,43.811555,43.813036,43.812761,43.809736,43.808235,43.805798,43.803954,43.801924,43.800984,43.795743,43.793313,43.791207,43.78699,43.784709,43.782628,43.78124,43.77872,43.777706,43.774753,43.769542,43.76734,43.765176,43.763745,43.762525,43.759699,43.757767,43.756832,43.752983,43.750748,43.750364,43.748549,43.746965,43.742964,43.741516,43.739082,43.737692,43.735841,43.733585,43.730635,43.729102,43.725444,43.724446,43.722386,43.721911,43.7176,43.715821,43.714027,43.710661,43.708584,43.706227,43.705008,43.704254,43.702821,43.701406,43.69714,43.695848,43.692868,43.691409,43.690301,43.688021,43.683766,43.680825,43.676079,43.673038,43.670143,43.667019,43.665708,43.66425,43.661708,43.656292,43.653858,43.652527,43.644379,43.64254,43.639685,43.637181,43.635627,43.633715,43.631689,43.629837,43.627549,43.62779,43.627045,43.626385,43.625796,43.625894,43.625632,43.625893,43.626937,43.62704,43.626357,43.622528,43.616414,43.615498,43.614657,43.609274,43.609162,43.609916,43.606611,43.604822,43.603609,43.602452,43.601758,43.601615,43.600817,43.599211,43.597823,43.597881,43.594581,43.59192,43.590297,43.589719,43.587403,43.58775,43.58775,43.584945,43.581616,43.579585,43.579643,43.577964,43.577326,43.577615,43.579584,43.579642,43.579215,43.576825,43.575654,43.574618,43.574987,43.574486,43.572977,43.569273,43.567709,43.565274,43.56549,43.562447,43.561938,43.55993,43.558293,43.557376,43.557284,43.55495,43.553278,43.551491,43.549437,43.544544,43.543161,43.541944,43.540482,43.53711,43.535952,43.534465,43.530775,43.529683,43.528421,43.52841,43.525509,43.523617,43.523017,43.520693,43.519057,43.515463,43.513576,43.513285,43.511821,43.510434,43.507323,43.505694,43.503594,43.499774,43.496887,43.491969,43.491401,43.489966,43.485057,43.483834,43.482811,43.479701,43.478185,43.476034,43.47356,43.472069,43.468423,43.467445,43.467514,43.466716,43.463835,43.461778,43.461777,43.460686,43.459132,43.456987,43.456339,43.45514,43.45489,43.452654,43.450923,43.449351,43.448708,43.447662,43.444354,43.442479,43.442832,43.444169,43.444947,43.444501,43.443167,43.441124,43.440221,43.440011,43.441628,43.44141,43.441275,43.440226,43.440262,43.438458,43.437395,43.452015,43.517582,43.544654,43.544317,43.544034,43.543912,43.544702,43.544882,43.543886,43.544357,43.54417,43.541679,43.540992,43.538988,43.540013,43.542099,43.605889,43.605906,43.649355,43.677086,43.736284,43.753648,43.77967,43.779635,43.779631,43.779533,43.77991,43.77991,43.78017,43.809212,43.809076,43.809877,43.810056,43.831183,43.830061,43.86833,43.868291,43.891057,43.891672,43.899074,43.906509,43.921117,43.921672,43.936474,43.937399,43.944319,43.944062,43.943882,43.944581,43.944837,43.94305,43.94308,43.935987,43.935984,43.932458,43.932429,43.928878,43.928822,43.924661,43.924682,43.920553,43.920658,43.916562,43.916733,43.914097,43.912655,43.91275,43.908629,43.908714,43.904582,43.904714,43.900512,43.900512,43.896281,43.896252,43.897322,43.898476,43.878689,43.865947,43.866012,43.871689,43.862737,43.863042,43.862001,43.862996,43.862224,43.862277,43.86421,43.863512,43.86343,43.863417,43.863289,43.863611,43.8637200341693,43.91085]}]],[[{"lng":[-119.943441,-119.943504,-119.931595,-119.931944,-119.932611,-119.896969,-119.896465,-119.895056,-119.895163,-119.896581,-119.897434,-119.777528,-119.775402,-119.657183,-119.614325,-118.932024,-118.867264,-118.857192,-118.816931,-118.81689,-118.799711,-118.587172,-118.587125,-118.467308,-118.466299,-118.347859,-118.347856,-118.227645,-118.228107,-118.230291,-118.231731,-118.232392,-118.232171,-118.232178,-118.232011,-118.228069,-118.228618,-118.228683,-118.228673,-118.228793,-118.216832,-118.216384,-118.214698,-118.195281,-118.196857,-118.197369215928,-118.501002,-118.601806,-118.628692114981,-118.644698465629,-118.696409,-118.775869,-118.777228,-118.795612,-118.829630206433,-119.001022,-119.20828,-119.231876,-119.251033,-119.324182599298,-119.360121480893,-119.359446,-119.363579,-119.363648,-119.363896,-119.365156,-119.365337,-119.705858,-119.706005,-119.943779,-119.943441],"lat":[42.753671,42.917079,42.917005,42.976439,43.178963,43.179017,43.353816,43.568127,43.592745,43.611164,43.6982,43.697957,43.959086,43.95892,43.959593,43.960374,43.960462,43.960227,43.960733,44.047828,44.047775,44.046995,44.040266,44.040375,44.040374,44.040388,44.039075,44.039862,43.779195,43.779207,43.779216,43.612266,43.436775,43.43565,43.348959,43.348964,43.096791,43.086086,43.042817,42.914625,42.914703,42.805902,42.275891,42.275813,42.135279,41.9969940811635,41.995446,41.993895,41.9932978970796,41.9929424184721,41.991794,41.992692,41.992671,41.992394,41.9926256901358,41.993793,41.993177,41.994212,41.993843,41.9942055845967,41.9943837248054,42.13723,42.137231,42.220094,42.487079,42.661822,42.748958,42.748791,42.746605,42.746371,42.753671]}]],[[{"lng":[-122.867891,-122.857175,-122.851912,-122.846503,-122.846485,-122.846494,-122.843407,-122.842499,-122.825967,-122.82066,-122.807188,-122.805556,-122.80547,-122.787507,-122.786266,-122.784896,-122.769123,-122.764942,-122.75407,-122.746817,-122.743741,-122.743868,-122.743811,-122.743798,-122.743856,-122.743923,-122.743923,-122.743933,-122.743922,-122.743915,-122.743919,-122.743921,-122.743926,-122.743942,-122.743939,-122.743848,-122.743941,-122.743942,-122.743956,-122.743963,-122.743974,-122.744029,-122.74406,-122.744006,-122.743991,-122.743721,-122.741101,-122.738563,-122.733422,-122.7303,-122.725541,-122.721663,-122.721355,-122.719286,-122.715938,-122.712169,-122.707893,-122.705021,-122.703304,-122.702001,-122.701808,-122.698697,-122.697382,-122.694678,-122.682505,-122.681893,-122.675572,-122.673311,-122.672677,-122.666298,-122.666145,-122.660451,-122.654959,-122.648725,-122.648787,-122.651183,-122.646267,-122.64616,-122.647666,-122.651227,-122.652605,-122.658274,-122.659105,-122.660979,-122.656972,-122.652988,-122.652921,-122.646958,-122.641245,-122.64158,-122.636587,-122.63656,-122.632974,-122.626278,-122.622359,-122.618977,-122.618995,-122.618588,-122.618341,-122.616871,-122.616195,-122.615374,-122.613127,-122.610832,-122.608722,-122.606614,-122.60573,-122.60175,-122.601454,-122.599675,-122.597665,-122.59762,-122.597395,-122.597198,-122.597184,-122.596702,-122.596603,-122.596245,-122.58937,-122.586836,-122.58613,-122.5855,-122.583961,-122.57905,-122.571309,-122.570126,-122.568617,-122.565483,-122.558255,-122.55301,-122.548002,-122.547638,-122.537618,-122.532488,-122.530085,-122.527468,-122.517067,-122.514243,-122.510439,-122.507261,-122.504364,-122.501787,-122.501043,-122.499336,-122.496748,-122.486584,-122.485866,-122.479942,-122.47555,-122.474558,-122.47253,-122.468001,-122.466639,-122.45466,-122.447789,-122.443966,-122.439145,-122.414457,-122.41397,-122.403758,-122.389346,-122.383141,-122.372796,-122.372096,-122.357752,-122.348315,-122.342882,-122.316084,-122.305836,-122.2727,-122.263944,-122.249828,-122.249969,-122.166674,-122.147212,-122.126545,-122.126544,-122.085981,-122.004194,-121.983147,-121.983148,-121.821956,-121.821959,-121.819587,-121.815501,-121.814319,-121.810726,-121.806845,-121.805977,-121.807559,-121.807583,-121.80559,-121.805791,-121.807908,-121.806939,-121.806916,-121.80456,-121.802589,-121.799679,-121.796434,-121.794539,-121.793651,-121.792696,-121.790802,-121.785633,-121.783928,-121.780122,-121.776204,-121.773181,-121.766144,-121.762165,-121.756938,-121.744622,-121.738405,-121.735074,-121.732298,-121.730946,-121.726508,-121.72419,-121.723201,-121.720904,-121.716979,-121.714579,-121.708575,-121.705532,-121.704123,-121.700473,-121.699988,-121.698113,-121.696925,-121.69756,-121.700209,-121.699231,-121.700709,-121.700918,-121.702141,-121.70123,-121.701957,-121.703546,-121.70326,-121.704223,-121.704567,-121.703592,-121.702846,-121.70326,-121.702476,-121.700932,-121.698691,-121.697615,-121.693809,-121.691752,-121.689975,-121.688772,-121.687276,-121.687945,-121.685262,-121.683547,-121.68159,-121.679081,-121.679232,-121.680813,-121.679888,-121.68,-121.681973,-121.684562,-121.68505,-121.685033,-121.687532,-121.689008,-121.690481,-121.690732,-121.692134,-121.695032,-121.696479,-121.696411,-121.691878,-121.689261,-121.680898,-121.682463,-121.681537,-121.684793,-121.685304,-121.686262,-121.684475,-121.682607,-121.685082,-121.689772,-121.691112,-121.697685,-121.698375,-121.69945,-121.703592,-121.705971,-121.709251,-121.710517,-121.711275,-121.712953,-121.714469,-121.715592,-121.719697,-121.727341,-121.73048,-121.73492,-121.736292,-121.738512,-121.741175,-121.74687,-121.748245,-121.749061,-121.748649,-121.747973,-121.746454,-121.743454,-121.740329,-121.738794,-121.736506,-121.733403,-121.732018,-121.731438,-121.730168,-121.729226,-121.728533,-121.727194,-121.725283,-121.723999,-121.718675,-121.715716,-121.712219,-121.711596,-121.710503,-121.710201,-121.71065,-121.710291,-121.708402,-121.70805,-121.706179,-121.702383,-121.700208,-121.69865,-121.699675,-121.696085,-121.695074,-121.693387,-121.69088,-121.687776,-121.685005,-121.682723,-121.677722,-121.667021,-121.665717,-121.664694,-121.662881,-121.662382,-121.662415,-121.661656,-121.660444,-121.657245,-121.653866,-121.652638,-121.652581,-121.653315,-121.652732,-121.651394,-121.652018,-121.653593,-121.656909,-121.659639,-121.660828,-121.660419,-121.66043,-121.65871,-121.660852,-121.672405,-121.680346,-121.683277,-121.688164,-121.691214,-121.693396,-121.696035,-121.697656,-121.698143,-121.699939,-121.707639,-121.710813,-121.714462,-121.715266,-121.722584,-121.722407,-121.718977,-121.718681,-121.716996,-121.717652,-121.720814,-121.725175,-121.730625,-121.735545,-121.737791,-121.740994,-121.744103,-121.749443,-121.751454,-121.752152,-121.755915,-121.766495,-121.770738,-121.778672,-121.779906,-121.781727,-121.78183,-121.779672,-121.779132,-121.778803,-121.781121,-121.781588,-121.781098,-121.781958,-121.784556,-121.788805,-121.793219,-121.798154,-121.80044,-121.804426,-121.805269,-121.805667,-121.804406,-121.803163,-121.802547,-121.803471,-121.802935,-121.801623,-121.802626,-121.803345,-121.800131,-121.798684,-121.798502,-121.79603,-121.794783,-121.792475,-121.792162,-121.791112,-121.787787,-121.786147,-121.785593,-121.785612,-121.786735,-121.790661,-121.796127,-121.79511,-121.789703,-121.787028,-121.78285,-121.77977,-121.777156,-121.773775,-121.772236,-121.766527,-121.764083,-121.76256,-121.760379,-121.754124,-121.752417,-121.748452,-121.745436,-121.744453,-121.744585,-121.747324,-121.747297,-121.742614,-121.738297,-121.735372,-121.732821,-121.728994,-121.723005,-121.71456,-121.714854,-121.715592,-121.71822,-121.723013,-121.724519,-121.726138,-121.728208,-121.730737,-121.734396,-121.735253,-121.734223,-121.765322,-121.806706,-122.257482,-122.317709,-122.378871,-122.388999,-122.401021,-122.399655,-122.396057,-122.393936,-122.393227,-122.394475,-122.39354,-122.394498,-122.394349,-122.395774,-122.399554,-122.401663,-122.404145,-122.407737,-122.410428,-122.413982,-122.422733,-122.423551,-122.426441,-122.429684,-122.435193,-122.436643,-122.439655,-122.441487,-122.445521,-122.446968,-122.450045,-122.453594,-122.455185,-122.4585,-122.464204,-122.466492,-122.47126,-122.475125,-122.480324,-122.483507,-122.48619,-122.487974,-122.492889,-122.495627,-122.496329,-122.499167,-122.500908,-122.505316,-122.506406,-122.508106,-122.511494,-122.515898,-122.51585,-122.516997,-122.517542,-122.518934,-122.522276,-122.523985,-122.526335,-122.527397,-122.52966,-122.532858,-122.535472,-122.536946,-122.540368,-122.540574,-122.542187,-122.543205,-122.545409,-122.546099,-122.548613,-122.549216,-122.550897,-122.552009,-122.551783,-122.553144,-122.554761,-122.556847,-122.555943,-122.557935,-122.559757,-122.558937,-122.560126,-122.561605,-122.56115,-122.562859,-122.56507,-122.56476,-122.565592,-122.567212,-122.566342,-122.567385,-122.568801,-122.571483,-122.573,-122.576221,-122.579862,-122.58168,-122.586299,-122.588868,-122.592472,-122.594954,-122.595491,-122.593133,-122.594367,-122.593682,-122.593818,-122.594626,-122.593197,-122.593483,-122.593502,-122.594702,-122.593535,-122.595636,-122.594796,-122.595829,-122.59552,-122.599078,-122.602164,-122.609216,-122.61168,-122.616241,-122.618649,-122.623428,-122.626492,-122.629512,-122.631083,-122.633939,-122.635839,-122.63866,-122.639844,-122.643168,-122.644197,-122.646144,-122.647963,-122.649252,-122.650233,-122.653581,-122.657523,-122.658507,-122.660029,-122.662537,-122.666038,-122.669637,-122.673705,-122.677361,-122.677936,-122.68152,-122.681147,-122.685747,-122.689571,-122.69464,-122.699104,-122.700829,-122.705237,-122.704641,-122.70536,-122.707425,-122.707287,-122.711949,-122.714132,-122.717097,-122.718753,-122.717886,-122.720723,-122.721141,-122.719677,-122.722655,-122.723727,-122.725293,-122.725607,-122.729745,-122.729595,-122.732936,-122.736633,-122.737647,-122.739652,-122.740594,-122.743301,-122.744146,-122.745578,-122.746317,-122.748307,-122.749968,-122.748752,-122.74984,-122.752579,-122.753353,-122.755755,-122.757254,-122.760276,-122.760977,-122.762126,-122.763246,-122.763984,-122.765164,-122.764789,-122.765616,-122.766302,-122.767681,-122.766995,-122.769068,-122.7707,-122.773366,-122.773903,-122.775889,-122.774314,-122.776307,-122.776942,-122.775718,-122.776187,-122.777586,-122.777663,-122.781786,-122.782827,-122.782815,-122.785493,-122.786549,-122.788505,-122.786627,-122.78538,-122.786313,-122.784888,-122.780824,-122.779965,-122.781352,-122.780652,-122.782013,-122.782884,-122.78211,-122.779564,-122.780383,-122.779835,-122.778455,-122.778553,-122.776847,-122.776907,-122.775109,-122.774156,-122.772894,-122.772035,-122.770026,-122.772065,-122.773305,-122.774752,-122.773688,-122.771475,-122.769712,-122.768112,-122.766605,-122.763332,-122.762055,-122.760535,-122.759894,-122.7619,-122.756883,-122.756696,-122.759303,-122.757657,-122.756386,-122.754149,-122.756842,-122.75439,-122.752463,-122.751894,-122.752724,-122.756569,-122.757844,-122.760134,-122.760358,-122.754911,-122.756151,-122.757919,-122.758214,-122.756239,-122.7544,-122.753184,-122.753841,-122.756522,-122.753884,-122.753413,-122.755088,-122.756638,-122.759434,-122.760415,-122.759871,-122.757517,-122.755534,-122.75652,-122.753163,-122.751459,-122.751833,-122.754896,-122.754437,-122.751348,-122.751611,-122.749815,-122.750561,-122.750461,-122.752691,-122.754369,-122.753159,-122.753648,-122.75639,-122.757403,-122.758803,-122.759494,-122.758267,-122.75582,-122.757473,-122.754592,-122.752483,-122.752237,-122.753886,-122.753387,-122.748307,-122.747358,-122.748557,-122.745399,-122.747201,-122.748091,-122.746621,-122.747151,-122.746712,-122.748913,-122.749779,-122.752533,-122.75186,-122.748109,-122.747274,-122.746774,-122.74563,-122.745299,-122.747765,-122.749821,-122.750085,-122.750739,-122.749784,-122.747736,-122.749131,-122.75124,-122.750248,-122.751948,-122.749958,-122.749828,-122.751113,-122.750062,-122.747134,-122.747534,-122.745653,-122.744481,-122.744258,-122.743964,-122.743741,-122.743598,-122.743512,-122.743481,-122.743483,-122.74445,-122.742709,-122.74112,-122.741516,-122.738988,-122.73926,-122.784756,-122.784857,-122.784898,-122.7849,-122.832856,-122.834576,-122.834765,-122.837929,-122.842326,-122.846224,-122.84674,-122.849872,-122.849925,-122.868073,-122.867891],"lat":[45.317345,45.317273,45.317228,45.317192,45.328151,45.34595,45.346154,45.346133,45.346249,45.346233,45.346276,45.34566,45.331772,45.33182,45.33182,45.331825,45.331909,45.331928,45.331994,45.332045,45.332067,45.346587,45.353992,45.355871,45.359577,45.371751,45.372181,45.375538,45.377431,45.381513,45.386122,45.386845,45.387483,45.391704,45.393033,45.396544,45.402592,45.402702,45.404972,45.406149,45.407918,45.415311,45.418855,45.421046,45.426072,45.433294,45.433268,45.433238,45.433199,45.43324,45.433167,45.433137,45.433135,45.433113,45.433079,45.433056,45.433042,45.433037,45.433038,45.433056,45.433041,45.433041,45.433041,45.43301,45.432841,45.432841,45.432867,45.432795,45.432792,45.432743,45.432743,45.432702,45.432668,45.432718,45.432811,45.436059,45.439584,45.441424,45.443983,45.445281,45.445741,45.453242,45.454341,45.457819,45.458066,45.458314,45.458318,45.458669,45.458671,45.461482,45.461476,45.461474,45.46155,45.461451,45.461444,45.461451,45.460908,45.460933,45.460832,45.460889,45.461473,45.461481,45.461493,45.461501,45.461505,45.461493,45.461488,45.461486,45.461464,45.461454,45.461453,45.461453,45.461457,45.461457,45.461457,45.461458,45.461458,45.461458,45.46149,45.461522,45.461483,45.461487,45.461494,45.461518,45.461392,45.46138,45.461365,45.461307,45.461062,45.461053,45.461045,45.461058,45.461353,45.461318,45.461296,45.461273,45.461262,45.46126,45.461256,45.461252,45.461187,45.461107,45.46107,45.461028,45.460982,45.461132,45.461138,45.461176,45.461183,45.461184,45.461173,45.461135,45.461127,45.460941,45.460974,45.461001,45.461134,45.461579,45.461581,45.461421,45.4613,45.461276,45.46123,45.461222,45.461426,45.461502,45.461529,45.46149,45.461439,45.461394,45.461412,45.461422,45.460935,45.460837,45.460828,45.460039,45.461299,45.46058,45.461534,45.461403,45.460237,45.460226,45.461674,45.461675,45.459678,45.457968,45.455518,45.454649,45.451832,45.450143,45.448983,45.444307,45.443096,45.442561,45.440485,45.435494,45.432929,45.431927,45.427854,45.427171,45.424228,45.418572,45.415174,45.415202,45.412164,45.4101,45.407275,45.402672,45.402457,45.403433,45.402844,45.401105,45.397261,45.397131,45.395664,45.395593,45.394798,45.393784,45.393648,45.39177,45.3894,45.387131,45.386754,45.383619,45.383545,45.381733,45.378531,45.376309,45.373838,45.373564,45.371963,45.369899,45.368338,45.366277,45.364545,45.363389,45.356172,45.35187,45.349016,45.346629,45.344448,45.339223,45.338957,45.334258,45.331267,45.329188,45.327889,45.323929,45.322947,45.321348,45.319453,45.316379,45.309477,45.306251,45.30503,45.30306,45.300714,45.299775,45.297177,45.295895,45.294816,45.292672,45.290025,45.287942,45.286259,45.283681,45.281798,45.279234,45.276153,45.275625,45.271641,45.268412,45.263859,45.25792,45.255359,45.254141,45.251348,45.250581,45.247204,45.243495,45.240067,45.235873,45.233301,45.230368,45.228988,45.228409,45.22965,45.229558,45.227391,45.226448,45.224054,45.2233,45.221466,45.21998,45.21847,45.215347,45.212368,45.21133,45.210941,45.211691,45.212044,45.211543,45.208963,45.206919,45.206156,45.206788,45.205997,45.2051,45.197559,45.1918,45.188995,45.18635,45.183795,45.182227,45.180374,45.176313,45.174913,45.170913,45.170633,45.170314,45.168594,45.164721,45.161556,45.159339,45.158354,45.156838,45.154039,45.153424,45.152824,45.150597,45.148733,45.143283,45.14039,45.137271,45.134055,45.131594,45.129102,45.127066,45.123789,45.12179,45.118883,45.117392,45.116934,45.11806,45.122474,45.12369,45.123572,45.12236,45.120519,45.11972,45.115172,45.114456,45.11335,45.107592,45.105425,45.104415,45.103177,45.102852,45.101992,45.099886,45.098582,45.097111,45.088803,45.086706,45.084943,45.082515,45.079635,45.075258,45.073623,45.069473,45.066355,45.066362,45.067683,45.068111,45.068012,45.067109,45.065692,45.06365,45.062866,45.061626,45.059579,45.05852,45.057054,45.055912,45.053214,45.051756,45.045432,45.044095,45.042325,45.039285,45.038037,45.037566,45.036915,45.036784,45.036182,45.034668,45.033616,45.034428,45.03385,45.034098,45.034836,45.036162,45.037218,45.03958,45.039837,45.037277,45.035136,45.034399,45.033698,45.031646,45.030126,45.026237,45.021486,45.018144,45.016312,45.015214,45.015132,45.016028,45.017471,45.01615,45.015183,45.012877,45.011496,45.006124,45.002217,44.999614,44.995386,44.992173,44.987321,44.982743,44.981021,44.977103,44.976452,44.974963,44.973167,44.970487,44.964926,44.959666,44.95786,44.956569,44.95477,44.952248,44.950377,44.947412,44.945223,44.941371,44.937426,44.935668,44.934682,44.935457,44.935654,44.935153,44.936857,44.938213,44.93984,44.941721,44.941952,44.941233,44.938447,44.932036,44.93057,44.927539,44.923042,44.920925,44.91983,44.917166,44.914636,44.912122,44.910179,44.907761,44.906819,44.904814,44.906315,44.90613,44.90277,44.900018,44.89745,44.896167,44.895375,44.893142,44.891348,44.890799,44.88931,44.888473,44.88572,44.885719,44.88572,44.88572,44.88572,44.885716,44.88572,44.88572,44.886262,44.889461,44.890411,44.891673,44.893745,44.895326,44.896804,44.899106,44.901513,44.904077,44.903796,44.904679,44.905012,44.903207,44.903949,44.904154,44.903461,44.903142,44.902029,44.903297,44.90295,44.90407,44.903958,44.906108,44.908139,44.910375,44.911579,44.913152,44.915212,44.916363,44.915471,44.917318,44.918395,44.921567,44.921549,44.922659,44.921358,44.920914,44.919965,44.919034,44.917781,44.918567,44.918332,44.91951,44.919599,44.922628,44.927857,44.929833,44.930043,44.932797,44.933534,44.934565,44.935681,44.936046,44.935156,44.935035,44.937446,44.936684,44.939975,44.943562,44.945139,44.945665,44.948872,44.949182,44.950115,44.950425,44.954172,44.954646,44.95626,44.957953,44.959177,44.959405,44.961426,44.962863,44.963588,44.965195,44.967159,44.969355,44.970562,44.971395,44.973208,44.973904,44.975131,44.977266,44.978628,44.980206,44.982564,44.983735,44.98521,44.985101,44.986044,44.985983,44.988407,44.988748,44.989629,44.988875,44.99089,44.992781,44.995429,44.996424,44.997588,45.00001,45.00081,45.003442,45.004531,45.006866,45.009501,45.012247,45.013907,45.016304,45.017789,45.01962,45.020549,45.021784,45.021866,45.024354,45.025,45.026964,45.028271,45.028355,45.030057,45.032175,45.033795,45.033418,45.031682,45.031442,45.032126,45.03377,45.033754,45.032445,45.032454,45.035844,45.035458,45.035768,45.035877,45.037081,45.038637,45.043633,45.046532,45.047052,45.046514,45.046314,45.047789,45.050296,45.052439,45.053471,45.054055,45.055997,45.057489,45.05929,45.061008,45.061957,45.062479,45.064479,45.067162,45.069124,45.069888,45.072405,45.074183,45.0758,45.077761,45.079641,45.081425,45.083141,45.082868,45.085653,45.087275,45.088244,45.092173,45.093478,45.094204,45.094286,45.095987,45.096291,45.098606,45.099676,45.102757,45.102063,45.103315,45.105482,45.10772,45.107061,45.110084,45.110444,45.111851,45.111575,45.112905,45.112597,45.113867,45.112386,45.11301,45.114389,45.115813,45.114627,45.114868,45.115745,45.1167,45.118255,45.117758,45.119241,45.118832,45.120228,45.121021,45.121981,45.122449,45.123511,45.123531,45.122446,45.124861,45.124528,45.126177,45.127566,45.129344,45.130356,45.130538,45.132497,45.133732,45.135904,45.137743,45.139388,45.140148,45.141555,45.141717,45.143852,45.145019,45.146571,45.147702,45.148922,45.149192,45.151118,45.151644,45.153233,45.153446,45.155281,45.155645,45.157689,45.159421,45.159579,45.160965,45.16182,45.163454,45.163004,45.16167,45.163073,45.163304,45.167946,45.169203,45.169575,45.170901,45.171984,45.172802,45.174712,45.175159,45.177512,45.178058,45.177444,45.179577,45.180131,45.18098,45.182194,45.18265,45.182445,45.183093,45.182647,45.183565,45.184699,45.186249,45.185891,45.186873,45.187131,45.186135,45.187517,45.18822,45.188847,45.189178,45.190158,45.191576,45.191249,45.189771,45.19142,45.194733,45.195719,45.19542,45.193098,45.19176,45.192758,45.193742,45.195927,45.196745,45.195862,45.194701,45.194959,45.197682,45.199202,45.200024,45.199926,45.201089,45.201832,45.202085,45.200599,45.200705,45.203317,45.205555,45.20697,45.209145,45.208981,45.209758,45.210801,45.21165,45.212319,45.211034,45.212283,45.214153,45.215953,45.217883,45.22069,45.221665,45.223337,45.225199,45.227217,45.229017,45.228835,45.23017,45.231213,45.231025,45.229255,45.230095,45.232772,45.233478,45.231969,45.233603,45.235042,45.236119,45.235692,45.238205,45.238406,45.24053,45.242542,45.243364,45.244329,45.245342,45.247278,45.249281,45.252235,45.252059,45.250772,45.250775,45.250826,45.250906,45.250982,45.251193,45.251356,45.251553,45.253319,45.256638,45.257031,45.258664,45.259532,45.259532,45.259575,45.261833,45.273887,45.274069,45.274053,45.274058,45.273822,45.26955,45.265657,45.261773,45.261388,45.259717,45.259697,45.259695,45.317345]}]],[[{"lng":[-123.180908,-123.180532,-123.178468,-123.174215,-123.170891,-123.16781,-123.1616,-123.155436,-123.152597,-123.149402,-123.147924,-123.147995,-123.146617,-123.144973,-123.141485,-123.13733,-123.134498,-123.13309,-123.132383,-123.13017,-123.128245,-123.125287,-123.123769,-123.120462,-123.116542,-123.11321,-123.108792,-123.107108,-123.108165,-123.110396,-123.1123,-123.112769,-123.111472,-123.109725,-123.105091,-123.093008,-123.091347,-123.082998,-123.081694,-123.076574,-123.072813,-123.071687,-123.06993,-123.067478,-123.062005,-123.060074,-123.054933,-123.0496,-123.044433,-123.043631,-123.042906,-123.042127,-123.04148,-123.039822,-123.038095,-123.037897,-123.038923,-123.037566,-123.036985,-123.037316,-123.037807,-123.037779,-123.037594,-123.037374,-123.037897,-123.040164,-123.040529,-123.040853,-123.041717,-123.042938,-123.047081,-123.051824,-123.053762,-123.05465,-123.055299,-123.058089,-123.064261,-123.065415,-123.066938,-123.068685,-123.069219,-123.071977,-123.074723,-123.075577,-123.075174,-123.075113,-123.074284,-123.073539,-123.072732,-123.070654,-123.068975,-123.068849,-123.067835,-123.067043,-123.065974,-123.06603,-123.066732,-123.068079,-123.068271,-123.068627,-123.067619,-123.062251,-123.059397,-123.051936,-123.046115,-123.044916,-123.041478,-123.036121,-123.033439,-123.027643,-123.018118,-123.014574,-123.009998,-123.008255,-123.005564,-123.002309,-122.999042,-122.996444,-122.998002,-123.001054,-123.007494,-123.009878,-123.012235,-123.015037,-123.020187,-123.022368,-123.025303,-123.028136,-123.031177,-123.031676,-123.032027,-123.032467,-123.033292,-123.033173,-123.031407,-123.028875,-123.02705,-123.023019,-123.01801,-123.011513,-123.007346,-123.003569,-123.000726,-123.001883,-123.007746,-123.011189,-123.014505,-123.015382,-123.01624,-123.018862,-123.019124,-123.018777,-123.020521,-123.022219,-123.024949,-123.028675,-123.036649,-123.041321,-123.043892,-123.045896,-123.047009,-123.049662,-123.050918,-123.051106,-123.049012,-123.046867,-123.044146,-123.04117,-123.038475,-123.035667,-123.02609,-123.007632,-123.003867,-122.999659,-122.997737,-122.996221,-122.995366,-122.995576,-122.996087,-122.996469,-122.997702,-122.998455,-122.998984,-123.001527,-123.001497,-123.000788,-122.999811,-122.999265,-122.996046,-122.99097,-122.98831,-122.981086,-122.977037,-122.975052,-122.974937,-122.974957,-122.974911,-122.974699,-122.971659,-122.967579,-122.964021,-122.9623,-122.961195,-122.959922,-122.958818,-122.957273,-122.954429,-122.952144,-122.949691,-122.947317,-122.943419,-122.932081,-122.928984,-122.92513,-122.922836,-122.919112,-122.916561,-122.912621,-122.908708,-122.904219,-122.899528,-122.898048,-122.893198,-122.889006,-122.886812,-122.882494,-122.881015,-122.879136,-122.872906,-122.867179,-122.86352,-122.858823,-122.854691,-122.849925,-122.849872,-122.84674,-122.846224,-122.842326,-122.837929,-122.834765,-122.834576,-122.832856,-122.7849,-122.784898,-122.784857,-122.784756,-122.73926,-122.738988,-122.741516,-122.74112,-122.742709,-122.74445,-122.743483,-122.743481,-122.743512,-122.743598,-122.743741,-122.743964,-122.744258,-122.744481,-122.745653,-122.747534,-122.747134,-122.750062,-122.751113,-122.749828,-122.749958,-122.751948,-122.750248,-122.75124,-122.749131,-122.747736,-122.749784,-122.750739,-122.750085,-122.749821,-122.747765,-122.745299,-122.74563,-122.746774,-122.747274,-122.748109,-122.75186,-122.752533,-122.749779,-122.748913,-122.746712,-122.747151,-122.746621,-122.748091,-122.747201,-122.745399,-122.748557,-122.747358,-122.748307,-122.753387,-122.753886,-122.752237,-122.752483,-122.754592,-122.757473,-122.75582,-122.758267,-122.759494,-122.758803,-122.757403,-122.75639,-122.753648,-122.753159,-122.754369,-122.752691,-122.750461,-122.750561,-122.749815,-122.751611,-122.751348,-122.754437,-122.754896,-122.751833,-122.751459,-122.753163,-122.75652,-122.755534,-122.757517,-122.759871,-122.760415,-122.759434,-122.756638,-122.755088,-122.753413,-122.753884,-122.756522,-122.753841,-122.753184,-122.7544,-122.756239,-122.758214,-122.757919,-122.756151,-122.754911,-122.760358,-122.760134,-122.757844,-122.756569,-122.752724,-122.751894,-122.752463,-122.75439,-122.756842,-122.754149,-122.756386,-122.757657,-122.759303,-122.756696,-122.756883,-122.7619,-122.759894,-122.760535,-122.762055,-122.763332,-122.766605,-122.768112,-122.769712,-122.771475,-122.773688,-122.774752,-122.773305,-122.772065,-122.770026,-122.772035,-122.772894,-122.774156,-122.775109,-122.776907,-122.776847,-122.778553,-122.778455,-122.779835,-122.780383,-122.779564,-122.78211,-122.782884,-122.782013,-122.780652,-122.781352,-122.779965,-122.780824,-122.784888,-122.786313,-122.78538,-122.786627,-122.788505,-122.786549,-122.785493,-122.782815,-122.782827,-122.781786,-122.777663,-122.777586,-122.776187,-122.775718,-122.776942,-122.776307,-122.774314,-122.775889,-122.773903,-122.773366,-122.7707,-122.769068,-122.766995,-122.767681,-122.766302,-122.765616,-122.764789,-122.765164,-122.763984,-122.763246,-122.762126,-122.760977,-122.760276,-122.757254,-122.755755,-122.753353,-122.752579,-122.74984,-122.748752,-122.749968,-122.748307,-122.746317,-122.745578,-122.744146,-122.743301,-122.740594,-122.739652,-122.737647,-122.736633,-122.732936,-122.729595,-122.729745,-122.725607,-122.725293,-122.723727,-122.722655,-122.719677,-122.721141,-122.720723,-122.717886,-122.718753,-122.717097,-122.714132,-122.711949,-122.707287,-122.707425,-122.70536,-122.704641,-122.705237,-122.700829,-122.699104,-122.69464,-122.689571,-122.685747,-122.681147,-122.68152,-122.677936,-122.677361,-122.673705,-122.669637,-122.666038,-122.662537,-122.660029,-122.658507,-122.657523,-122.653581,-122.650233,-122.649252,-122.647963,-122.646144,-122.644197,-122.643168,-122.639844,-122.63866,-122.635839,-122.633939,-122.631083,-122.629512,-122.626492,-122.623428,-122.618649,-122.616241,-122.61168,-122.609216,-122.602164,-122.599078,-122.59552,-122.595829,-122.594796,-122.595636,-122.593535,-122.594702,-122.593502,-122.593483,-122.593197,-122.594626,-122.593818,-122.593682,-122.594367,-122.593133,-122.595491,-122.594954,-122.592472,-122.588868,-122.586299,-122.58168,-122.579862,-122.576221,-122.573,-122.571483,-122.568801,-122.567385,-122.566342,-122.567212,-122.565592,-122.56476,-122.56507,-122.562859,-122.56115,-122.561605,-122.560126,-122.558937,-122.559757,-122.557935,-122.555943,-122.556847,-122.554761,-122.553144,-122.551783,-122.552009,-122.550897,-122.549216,-122.548613,-122.546099,-122.545409,-122.543205,-122.542187,-122.540574,-122.540368,-122.536946,-122.535472,-122.532858,-122.52966,-122.527397,-122.526335,-122.523985,-122.522276,-122.518934,-122.517542,-122.516997,-122.51585,-122.515898,-122.511494,-122.508106,-122.506406,-122.505316,-122.500908,-122.499167,-122.496329,-122.495627,-122.492889,-122.487974,-122.48619,-122.483507,-122.480324,-122.475125,-122.47126,-122.466492,-122.464204,-122.4585,-122.455185,-122.453594,-122.450045,-122.446968,-122.445521,-122.441487,-122.439655,-122.436643,-122.435193,-122.429684,-122.426441,-122.423551,-122.422733,-122.413982,-122.410428,-122.407737,-122.404145,-122.401663,-122.399554,-122.395774,-122.394349,-122.394498,-122.39354,-122.394475,-122.393227,-122.393936,-122.396057,-122.399655,-122.401021,-122.388999,-122.378871,-122.317709,-122.257482,-121.806706,-121.765322,-121.734223,-121.733528,-121.736936,-121.739922,-121.746221,-121.747741,-121.747874,-121.750034,-121.753182,-121.751069,-121.748587,-121.742406,-121.741864,-121.742441,-121.745258,-121.746671,-121.750261,-121.752994,-121.753589,-121.759991,-121.76252,-121.764831,-121.767978,-121.775926,-121.781753,-121.787132,-121.790183,-121.792116,-121.796409,-121.803883,-121.808137,-121.812221,-121.811363,-121.810174,-121.813063,-121.813663,-121.816998,-121.820278,-121.819663,-121.820254,-121.817693,-121.816517,-121.816436,-121.817212,-121.817809,-121.819137,-121.817386,-121.813655,-121.81202,-121.810296,-121.80762,-121.806653,-121.804304,-121.804413,-121.801536,-121.798998,-121.796831,-121.795963,-121.79151,-121.789999,-121.784961,-121.783621,-121.779924,-121.778305,-121.776323,-121.773183,-121.772449,-121.771593,-121.769125,-121.769206,-121.76661,-121.763225,-121.761005,-121.759958,-121.762002,-121.768218,-121.772321,-121.775652,-121.774175,-121.780168,-121.782569,-121.788203,-121.788525,-121.79161,-121.792298,-121.795075,-121.797222,-121.800219,-121.799458,-121.802779,-121.804597,-121.802682,-121.798109,-121.79695,-121.794385,-121.795643,-121.79528,-121.795864,-121.795797,-121.796107,-121.796704,-121.797833,-121.798174,-121.802109,-121.802922,-121.800479,-121.797651,-121.796565,-121.797009,-121.796635,-121.795481,-121.793604,-121.793329,-121.790022,-121.788944,-121.787179,-121.788859,-121.793238,-121.794599,-121.799562,-121.963805,-121.964997,-121.966375,-121.967345,-121.971604,-121.973503,-121.974303,-121.977179,-121.980176,-121.981681,-121.984527,-121.992926,-121.996208,-121.999761,-122.001009,-122.003216,-122.005291,-122.008804,-122.011684,-122.015715,-122.016709,-122.01847,-122.020851,-122.024106,-122.026339,-122.028916,-122.030498,-122.033006,-122.034171,-122.03598,-122.040875,-122.045304,-122.046094,-122.047028,-122.050762,-122.054415,-122.056484,-122.058813,-122.060621,-122.063939,-122.065765,-122.068144,-122.069796,-122.071823,-122.074393,-122.075401,-122.077104,-122.081091,-122.08412,-122.086244,-122.088617,-122.09404,-122.096559,-122.100326,-122.103815,-122.107563,-122.108719,-122.110688,-122.11344,-122.118702,-122.119828,-122.119821,-122.121442,-122.122466,-122.124247,-122.128698,-122.130972,-122.132685,-122.138702,-122.14237,-122.149224,-122.152774,-122.154325,-122.156292,-122.161118,-122.164191,-122.166572,-122.171843,-122.174251,-122.178684,-122.179739,-122.184557,-122.189405,-122.193924,-122.196732,-122.198046,-122.198685,-122.199334,-122.204021,-122.207421,-122.210663,-122.21445,-122.218413,-122.220719,-122.222145,-122.224659,-122.22769,-122.23037,-122.231438,-122.23292,-122.237408,-122.23706,-122.242203,-122.245971,-122.246528,-122.247582,-122.250044,-122.253592,-122.255066,-122.255448,-122.259394,-122.261423,-122.264381,-122.269612,-122.271886,-122.273067,-122.274,-122.27376,-122.276675,-122.278591,-122.282872,-122.288569,-122.292897,-122.300164,-122.302935,-122.306909,-122.308786,-122.311568,-122.317447,-122.318858,-122.32137,-122.325742,-122.328534,-122.333374,-122.334685,-122.340708,-122.343213,-122.34955,-122.354329,-122.35614,-122.362732,-122.370076,-122.372462,-122.378629,-122.382079,-122.38863,-122.39138,-122.394416,-122.397991,-122.400882,-122.4027,-122.406298,-122.408208,-122.41,-122.41099,-122.411198,-122.410944,-122.410988,-122.411213,-122.412346,-122.419433,-122.423287,-122.428316,-122.431319,-122.435041,-122.436918,-122.44036,-122.441817,-122.442151,-122.443103,-122.443897,-122.454774,-122.457333,-122.46124,-122.469302,-122.473551,-122.475835,-122.475968,-122.475677,-122.477499,-122.480122,-122.484798,-122.487637,-122.496565,-122.503151,-122.50559,-122.511612,-122.519439,-122.520605,-122.520625,-122.52245,-122.522561,-122.52029,-122.521912,-122.531042,-122.532911,-122.536666,-122.538944,-122.541561,-122.542407,-122.546669,-122.553888,-122.56151,-122.564402,-122.56693,-122.568195,-122.568548,-122.569953,-122.5701,-122.572269,-122.576929,-122.582836,-122.597363,-122.599469,-122.603458,-122.607766,-122.61524,-122.618014,-122.620463,-122.621327,-122.627139,-122.634129,-122.639144,-122.64073,-122.645826,-122.65029,-122.653472,-122.660327,-122.66985,-122.670774,-122.677492,-122.680574,-122.683555,-122.690864,-122.694844,-122.696463,-122.700531,-122.705411,-122.713778,-122.715588,-122.719631,-122.721705,-122.724795,-122.726418,-122.727945,-122.729355,-122.732714,-122.737302,-122.743446,-122.748027,-122.753221,-122.757763,-122.759186,-122.762124,-122.763398,-122.765303,-122.768613,-122.773998,-122.778248,-122.779831,-122.783465,-122.787691,-122.793327,-122.794418,-122.800709,-122.804166,-122.803195,-122.805408,-122.807949,-122.812321,-122.813636,-122.813769,-122.815899,-122.819465,-122.821487,-122.825426,-122.828925,-122.832797,-122.839136,-122.839763,-122.842851,-122.845145,-122.847178,-122.848492,-122.846935,-122.8471,-122.849696,-122.852323,-122.856157,-122.861237,-122.864965,-122.868847,-122.871689,-122.873219,-122.873245,-122.87453,-122.882731,-122.884958,-122.890258,-122.891829,-122.892398,-122.895184,-122.897648,-122.899397,-122.900612,-122.902456,-122.90538,-122.906842,-122.909232,-122.909888,-122.913298,-122.916886,-122.919518,-122.919464,-122.922578,-122.925638,-122.928097,-122.929887,-122.929381,-122.931922,-122.93408,-122.937846,-122.943228,-122.947659,-122.949349,-122.955481,-122.957256,-122.962703,-122.964661,-122.969086,-122.971694,-122.97265,-122.97364,-122.973993,-122.973649,-122.974427,-122.975862,-122.979769,-122.985042,-122.986746,-122.988675,-122.990027,-122.991695,-122.993648,-122.996175,-122.998293,-122.997623,-122.996025,-122.996297,-122.998717,-123.000013,-123.001831,-123.004903,-123.005477,-123.006847,-123.007595,-123.010604,-123.01133,-123.012491,-123.013065,-123.01383,-123.014599,-123.015982,-123.018107,-123.018367,-123.018598,-123.018734,-123.018747,-123.018679,-123.017345,-123.016551,-123.015765,-123.015049,-123.014433,-123.013824,-123.013866,-123.01474,-123.01509,-123.015148,-123.015825,-123.016667,-123.018153,-123.019999,-123.024002,-123.027127,-123.031884,-123.034095,-123.035804,-123.03941,-123.041567,-123.042756,-123.041897,-123.039451,-123.039828,-123.039988,-123.040809,-123.041354,-123.042037,-123.043527,-123.044987,-123.050025,-123.053026,-123.055342,-123.060106,-123.061853,-123.061431,-123.060721,-123.061117,-123.062154,-123.066818,-123.07173,-123.076375,-123.078903,-123.081389,-123.086457,-123.089503,-123.092658,-123.095772,-123.099242,-123.100881,-123.105377,-123.106032,-123.107712,-123.111578,-123.113025,-123.118721,-123.120253,-123.119733,-123.120155,-123.123007,-123.12769,-123.133831,-123.13696,-123.139759,-123.142191,-123.143843,-123.145463,-123.147833,-123.148411,-123.148333,-123.14752,-123.145812,-123.144012,-123.140101,-123.137656,-123.133628,-123.132924,-123.131328,-123.129627,-123.128571,-123.126787,-123.125807,-123.124779,-123.122064,-123.117983,-123.110229,-123.102131,-123.097713,-123.095698,-123.09199,-123.091349,-123.091479,-123.093335,-123.101167,-123.103566,-123.109462,-123.1114,-123.118528,-123.126252,-123.131734,-123.140136,-123.143754,-123.149254,-123.151364,-123.152849,-123.154541,-123.158928,-123.166472,-123.169856,-123.173863,-123.17778,-123.179387,-123.179555,-123.179677,-123.179758,-123.179829,-123.18001,-123.180117,-123.179881,-123.179857,-123.180122,-123.180944,-123.180908],"lat":[44.857553,44.858765,44.861006,44.863534,44.864462,44.864022,44.861579,44.860009,44.860059,44.861254,44.863181,44.866795,44.870722,44.877305,44.88374,44.887259,44.889368,44.891904,44.894683,44.90073,44.904764,44.909273,44.910536,44.912185,44.913242,44.914782,44.917505,44.920337,44.92249,44.923826,44.926012,44.928728,44.930161,44.930863,44.93044,44.930541,44.930297,44.927167,44.926878,44.926914,44.927686,44.928107,44.92905,44.932214,44.936207,44.937885,44.940694,44.942701,44.944231,44.94495,44.945975,44.947098,44.948114,44.95165,44.95657,44.958779,44.961154,44.965581,44.967428,44.972795,44.975841,44.977463,44.979621,44.981139,44.984421,44.988153,44.988502,44.98877,44.989381,44.990026,44.991041,44.990302,44.989928,44.989868,44.989826,44.989368,44.989778,44.990718,44.995005,44.998378,45.000505,45.008897,45.012533,45.014513,45.017489,45.021657,45.02584,45.031314,45.033397,45.036599,45.041493,45.046709,45.054188,45.060738,45.068042,45.069102,45.071438,45.074288,45.074864,45.076586,45.078925,45.082673,45.083942,45.086332,45.089197,45.090273,45.094073,45.097729,45.098953,45.100555,45.100961,45.101967,45.105444,45.107235,45.111091,45.11311,45.114694,45.117631,45.120604,45.123249,45.127319,45.129273,45.133769,45.136757,45.138747,45.139431,45.140185,45.141313,45.144303,45.144999,45.145564,45.146614,45.150825,45.153831,45.15794,45.160852,45.161894,45.162905,45.162765,45.160252,45.159498,45.161321,45.16452,45.167365,45.170955,45.173053,45.175796,45.177017,45.181566,45.189247,45.191003,45.19584,45.199841,45.201121,45.202051,45.201943,45.199434,45.198918,45.199481,45.201105,45.204744,45.207266,45.209391,45.211305,45.214705,45.216583,45.21828,45.220788,45.222272,45.222789,45.223224,45.222137,45.22217,45.223696,45.226947,45.230698,45.233981,45.237426,45.238305,45.238752,45.239953,45.241311,45.242731,45.254877,45.257284,45.259347,45.26085,45.261554,45.264811,45.267714,45.268761,45.271011,45.273321,45.276226,45.276928,45.278081,45.279143,45.279979,45.283041,45.285083,45.284894,45.28388,45.282982,45.281837,45.280509,45.278695,45.273639,45.270488,45.26826,45.267485,45.267586,45.268499,45.268621,45.268635,45.268509,45.268065,45.267445,45.266203,45.262835,45.259435,45.256719,45.256622,45.257798,45.257491,45.256531,45.255211,45.254827,45.254425,45.253827,45.252972,45.253084,45.254719,45.257252,45.259697,45.259717,45.261388,45.261773,45.265657,45.26955,45.273822,45.274058,45.274053,45.274069,45.273887,45.261833,45.259575,45.259532,45.259532,45.258664,45.257031,45.256638,45.253319,45.251553,45.251356,45.251193,45.250982,45.250906,45.250826,45.250775,45.250772,45.252059,45.252235,45.249281,45.247278,45.245342,45.244329,45.243364,45.242542,45.24053,45.238406,45.238205,45.235692,45.236119,45.235042,45.233603,45.231969,45.233478,45.232772,45.230095,45.229255,45.231025,45.231213,45.23017,45.228835,45.229017,45.227217,45.225199,45.223337,45.221665,45.22069,45.217883,45.215953,45.214153,45.212283,45.211034,45.212319,45.21165,45.210801,45.209758,45.208981,45.209145,45.20697,45.205555,45.203317,45.200705,45.200599,45.202085,45.201832,45.201089,45.199926,45.200024,45.199202,45.197682,45.194959,45.194701,45.195862,45.196745,45.195927,45.193742,45.192758,45.19176,45.193098,45.19542,45.195719,45.194733,45.19142,45.189771,45.191249,45.191576,45.190158,45.189178,45.188847,45.18822,45.187517,45.186135,45.187131,45.186873,45.185891,45.186249,45.184699,45.183565,45.182647,45.183093,45.182445,45.18265,45.182194,45.18098,45.180131,45.179577,45.177444,45.178058,45.177512,45.175159,45.174712,45.172802,45.171984,45.170901,45.169575,45.169203,45.167946,45.163304,45.163073,45.16167,45.163004,45.163454,45.16182,45.160965,45.159579,45.159421,45.157689,45.155645,45.155281,45.153446,45.153233,45.151644,45.151118,45.149192,45.148922,45.147702,45.146571,45.145019,45.143852,45.141717,45.141555,45.140148,45.139388,45.137743,45.135904,45.133732,45.132497,45.130538,45.130356,45.129344,45.127566,45.126177,45.124528,45.124861,45.122446,45.123531,45.123511,45.122449,45.121981,45.121021,45.120228,45.118832,45.119241,45.117758,45.118255,45.1167,45.115745,45.114868,45.114627,45.115813,45.114389,45.11301,45.112386,45.113867,45.112597,45.112905,45.111575,45.111851,45.110444,45.110084,45.107061,45.10772,45.105482,45.103315,45.102063,45.102757,45.099676,45.098606,45.096291,45.095987,45.094286,45.094204,45.093478,45.092173,45.088244,45.087275,45.085653,45.082868,45.083141,45.081425,45.079641,45.077761,45.0758,45.074183,45.072405,45.069888,45.069124,45.067162,45.064479,45.062479,45.061957,45.061008,45.05929,45.057489,45.055997,45.054055,45.053471,45.052439,45.050296,45.047789,45.046314,45.046514,45.047052,45.046532,45.043633,45.038637,45.037081,45.035877,45.035768,45.035458,45.035844,45.032454,45.032445,45.033754,45.03377,45.032126,45.031442,45.031682,45.033418,45.033795,45.032175,45.030057,45.028355,45.028271,45.026964,45.025,45.024354,45.021866,45.021784,45.020549,45.01962,45.017789,45.016304,45.013907,45.012247,45.009501,45.006866,45.004531,45.003442,45.00081,45.00001,44.997588,44.996424,44.995429,44.992781,44.99089,44.988875,44.989629,44.988748,44.988407,44.985983,44.986044,44.985101,44.98521,44.983735,44.982564,44.980206,44.978628,44.977266,44.975131,44.973904,44.973208,44.971395,44.970562,44.969355,44.967159,44.965195,44.963588,44.962863,44.961426,44.959405,44.959177,44.957953,44.95626,44.954646,44.954172,44.950425,44.950115,44.949182,44.948872,44.945665,44.945139,44.943562,44.939975,44.936684,44.937446,44.935035,44.935156,44.936046,44.935681,44.934565,44.933534,44.932797,44.930043,44.929833,44.927857,44.922628,44.919599,44.91951,44.918332,44.918567,44.917781,44.919034,44.919965,44.920914,44.921358,44.922659,44.921549,44.921567,44.918395,44.917318,44.915471,44.916363,44.915212,44.913152,44.911579,44.910375,44.908139,44.906108,44.903958,44.90407,44.90295,44.903297,44.902029,44.903142,44.903461,44.904154,44.903949,44.903207,44.905012,44.904679,44.903796,44.904077,44.901513,44.899106,44.896804,44.895326,44.893745,44.891673,44.890411,44.889461,44.886262,44.88572,44.88572,44.885716,44.88572,44.88572,44.88572,44.885719,44.88572,44.882059,44.879812,44.876673,44.875394,44.872298,44.869565,44.864573,44.86124,44.856706,44.855163,44.853292,44.847398,44.845514,44.841401,44.837387,44.832677,44.829919,44.828908,44.82543,44.824633,44.820267,44.819734,44.819846,44.818958,44.815469,44.815433,44.813004,44.812002,44.81217,44.811634,44.811574,44.807869,44.806377,44.805407,44.80399,44.803173,44.800134,44.795847,44.79466,44.793037,44.792964,44.792548,44.791602,44.790637,44.7898,44.786813,44.784404,44.781509,44.78228,44.782159,44.780597,44.779078,44.777548,44.779277,44.778183,44.776675,44.772848,44.772311,44.773281,44.771856,44.772641,44.775543,44.77555,44.77416,44.775636,44.775136,44.772141,44.769993,44.769111,44.766914,44.767292,44.765293,44.762326,44.760886,44.76137,44.759964,44.754074,44.752723,44.750464,44.748893,44.748232,44.747845,44.746259,44.744269,44.741882,44.738266,44.735456,44.732713,44.730793,44.729236,44.729116,44.727671,44.727148,44.725896,44.724655,44.72052,44.716295,44.71558,44.714547,44.714077,44.713842,44.713707,44.711741,44.710685,44.703088,44.70078,44.699309,44.69837,44.698304,44.69753,44.696291,44.6946,44.6928,44.690417,44.689291,44.687063,44.685153,44.683929,44.683915,44.683888,44.684129,44.685564,44.685483,44.689168,44.691926,44.692141,44.691065,44.693635,44.693787,44.69226,44.689704,44.690406,44.687755,44.687445,44.68911,44.688618,44.686724,44.687317,44.690576,44.690836,44.690819,44.689988,44.690218,44.689948,44.688861,44.687201,44.685691,44.685799,44.687338,44.688084,44.688263,44.688731,44.692286,44.692841,44.692955,44.693644,44.697043,44.697513,44.696384,44.696426,44.697193,44.697478,44.698365,44.700448,44.700734,44.700608,44.698712,44.699471,44.702147,44.702552,44.704358,44.705825,44.707154,44.707611,44.706996,44.707172,44.708855,44.710107,44.710977,44.71193,44.713165,44.714143,44.715879,44.717151,44.718001,44.718005,44.721143,44.725179,44.7261,44.726127,44.724254,44.719643,44.717671,44.717039,44.715565,44.71368,44.713151,44.710244,44.708729,44.707001,44.705819,44.703685,44.703152,44.703218,44.700798,44.696784,44.69617,44.697184,44.695977,44.696236,44.694456,44.693239,44.694399,44.695981,44.696937,44.697071,44.697668,44.698465,44.70099,44.705106,44.706416,44.713068,44.717246,44.719361,44.720745,44.722005,44.722504,44.723565,44.725706,44.728796,44.729275,44.73179,44.732929,44.734203,44.735506,44.738496,44.741007,44.746135,44.747099,44.750634,44.753062,44.753979,44.754257,44.75525,44.75549,44.75611,44.75621,44.758914,44.759289,44.758822,44.758759,44.756705,44.756323,44.755412,44.755972,44.756864,44.75804,44.75766,44.757225,44.757428,44.756511,44.754975,44.752014,44.752082,44.754362,44.755029,44.753131,44.752316,44.753697,44.755047,44.755006,44.754739,44.754428,44.754134,44.753908,44.753124,44.752753,44.752512,44.752011,44.753528,44.751448,44.752751,44.754761,44.756134,44.755458,44.753528,44.753404,44.753858,44.754725,44.755009,44.755259,44.755633,44.755564,44.753742,44.752139,44.752096,44.752567,44.753934,44.75489,44.755819,44.755009,44.754001,44.751043,44.749763,44.750074,44.752692,44.753486,44.754101,44.755686,44.758945,44.760641,44.762046,44.764031,44.766805,44.766867,44.766226,44.764863,44.765619,44.766239,44.767362,44.768217,44.767942,44.768072,44.769646,44.771258,44.774001,44.774716,44.774732,44.775558,44.776476,44.777214,44.777804,44.778181,44.782461,44.784075,44.788271,44.788863,44.789213,44.789107,44.787851,44.787861,44.787054,44.784738,44.782401,44.781976,44.781136,44.780277,44.777719,44.777574,44.777923,44.777371,44.776088,44.775417,44.77602,44.777267,44.777245,44.778523,44.780196,44.781647,44.789338,44.791364,44.792929,44.793214,44.792106,44.789677,44.789109,44.789479,44.787808,44.787738,44.789642,44.790451,44.790249,44.791419,44.792586,44.793174,44.792765,44.793463,44.792603,44.79278,44.794422,44.793666,44.791563,44.791537,44.791578,44.789678,44.78903,44.786855,44.785434,44.785209,44.783213,44.779591,44.777942,44.778194,44.775523,44.771708,44.77072,44.770298,44.770616,44.770896,44.774362,44.77468,44.774063,44.772644,44.769308,44.767536,44.76229,44.760755,44.759186,44.758055,44.7583,44.758216,44.757137,44.75506,44.752291,44.751136,44.751034,44.750569,44.748623,44.747499,44.745129,44.743985,44.744958,44.743794,44.741044,44.739819,44.739187,44.737503,44.736472,44.732507,44.729806,44.728611,44.726906,44.724935,44.723703,44.721852,44.72222,44.720663,44.719301,44.716995,44.71578,44.714889,44.715479,44.717986,44.718634,44.720937,44.721094,44.715557,44.714277,44.713103,44.709874,44.707984,44.705845,44.702888,44.700518,44.698606,44.697578,44.696492,44.696526,44.695985,44.694026,44.693479,44.693872,44.696058,44.695699,44.694101,44.69212,44.690286,44.689016,44.687233,44.686916,44.688924,44.68809,44.687041,44.686898,44.68794,44.689732,44.690091,44.690794,44.691194,44.691887,44.69276,44.694116,44.697591,44.69816,44.698774,44.699336,44.699592,44.700354,44.704244,44.705776,44.707409,44.709128,44.710897,44.712904,44.714894,44.717341,44.71976,44.719877,44.721154,44.72213,44.723642,44.725376,44.725578,44.723951,44.72107,44.720551,44.721804,44.723498,44.725243,44.728972,44.731045,44.733589,44.735417,44.735833,44.736823,44.73726,44.737595,44.73808,44.738451,44.73849,44.737627,44.737034,44.737684,44.738869,44.743405,44.744883,44.747124,44.748042,44.748094,44.74615,44.743504,44.743073,44.743343,44.745997,44.747011,44.747551,44.746539,44.746215,44.746553,44.748844,44.751034,44.752966,44.759049,44.759483,44.758445,44.756922,44.753731,44.752475,44.751272,44.751372,44.752109,44.751258,44.749592,44.7488,44.748914,44.749516,44.751446,44.755137,44.760578,44.765404,44.770231,44.771832,44.773729,44.775272,44.778736,44.779867,44.785587,44.787897,44.789249,44.79117,44.791961,44.792666,44.793774,44.794537,44.796516,44.797542,44.799099,44.800848,44.806642,44.80953,44.811523,44.814044,44.817768,44.818847,44.82098,44.821691,44.822803,44.826079,44.826479,44.825503,44.825398,44.826506,44.827607,44.829536,44.830219,44.830236,44.828733,44.829041,44.83042,44.833332,44.835729,44.83612,44.836601,44.837131,44.837984,44.839568,44.841506,44.844667,44.845611,44.851647,44.855601,44.857553]}]],[[{"lng":[-121.849512,-121.847093,-121.843955,-121.844453,-121.844256,-121.843049,-121.844366,-121.845971,-121.847034,-121.84938,-121.848875,-121.847359,-121.84688,-121.844861,-121.843914,-121.839796,-121.834668,-121.832405,-121.829007,-121.82561,-121.824155,-121.823104,-121.819453,-121.818283,-121.815638,-121.814698,-121.809865,-121.809382,-121.809419,-121.811212,-121.813074,-121.812509,-121.813482,-121.816073,-121.816317,-121.815832,-121.8138,-121.813604,-121.811331,-121.807657,-121.806817,-121.807092,-121.804825,-121.803286,-121.802801,-121.802093,-121.803133,-121.801798,-121.800708,-121.801265,-121.800617,-121.79921,-121.800051,-121.799081,-121.799965,-121.798363,-121.796859,-121.79518,-121.793895,-121.795273,-121.795192,-121.800216,-121.800926,-121.798646,-121.800331,-121.802162,-121.802325,-121.804756,-121.806559,-121.81069,-121.811566,-121.810189,-121.80941,-121.807491,-121.808206,-121.805763,-121.805488,-121.80419,-121.802244,-121.80273,-121.801352,-121.800054,-121.797945,-121.799432,-121.799566,-121.797991,-121.797622,-121.797993,-121.79865,-121.798969,-121.799036,-121.798805,-121.798435,-121.798296,-121.801092,-121.801611,-121.800563,-121.800936,-121.800345,-121.799241,-121.799675,-121.800929,-121.800402,-121.799562,-121.794599,-121.793238,-121.788859,-121.787179,-121.788944,-121.790022,-121.793329,-121.793604,-121.795481,-121.796635,-121.797009,-121.796565,-121.797651,-121.800479,-121.802922,-121.802109,-121.798174,-121.797833,-121.796704,-121.796107,-121.795797,-121.795864,-121.79528,-121.795643,-121.794385,-121.79695,-121.798109,-121.802682,-121.804597,-121.802779,-121.799458,-121.800219,-121.797222,-121.795075,-121.792298,-121.79161,-121.788525,-121.788203,-121.782569,-121.780168,-121.774175,-121.775652,-121.772321,-121.768218,-121.762002,-121.759958,-121.761005,-121.763225,-121.76661,-121.769206,-121.769125,-121.771593,-121.772449,-121.773183,-121.776323,-121.778305,-121.779924,-121.783621,-121.784961,-121.789999,-121.79151,-121.795963,-121.796831,-121.798998,-121.801536,-121.804413,-121.804304,-121.806653,-121.80762,-121.810296,-121.81202,-121.813655,-121.817386,-121.819137,-121.817809,-121.817212,-121.816436,-121.816517,-121.817693,-121.820254,-121.819663,-121.820278,-121.816998,-121.813663,-121.813063,-121.810174,-121.811363,-121.812221,-121.808137,-121.803883,-121.796409,-121.792116,-121.790183,-121.787132,-121.781753,-121.775926,-121.767978,-121.764831,-121.76252,-121.759991,-121.753589,-121.752994,-121.725068,-121.725068,-121.351973,-121.210841,-121.091897,-121.090568,-121.08948,-120.989505,-120.923309,-120.68959,-120.371441,-120.372635,-120.379053,-120.380711,-120.377062,-120.377797,-120.38353,-120.386035,-120.386498,-120.385489,-120.384813,-120.380814,-120.379005,-120.379794,-120.381376,-120.385877,-120.385062,-120.390987,-120.393173,-120.394109,-120.395872,-120.398292,-120.399226,-120.401654,-120.404676,-120.404685,-120.400743,-120.39737,-120.394668,-120.394254,-120.394825,-120.397984,-120.399248,-120.398603,-120.393046,-120.389667,-120.387782,-120.387452,-120.388118,-120.387642,-120.385687,-120.386378,-120.385768,-120.386561,-120.406743,-120.597275,-120.827555,-120.827552,-120.826899,-120.988824,-120.988375,-121.014525,-121.058034,-121.058352,-121.076748,-121.077844,-121.107534,-121.130934,-121.149644,-121.189792,-121.199971,-121.229289,-121.2293,-121.242113,-121.291112,-121.405495,-121.473293,-121.533117,-121.59326,-121.596883,-121.636001,-121.673699,-121.674928,-121.776324,-121.776324,-121.843138,-121.843218,-121.846123,-121.846756,-121.846519,-121.845128,-121.845745,-121.842528,-121.841332,-121.843244,-121.843146,-121.845531,-121.844403,-121.845334,-121.84552,-121.845745,-121.847561,-121.847578,-121.846191,-121.846615,-121.844711,-121.841535,-121.841128,-121.84291,-121.844408,-121.847502,-121.848677,-121.848139,-121.848791,-121.847291,-121.847634,-121.849462,-121.849512],"lat":[44.468364,44.470459,44.471833,44.473565,44.475957,44.479035,44.481512,44.483372,44.483275,44.484523,44.486706,44.488942,44.49109,44.491746,44.492775,44.495385,44.499335,44.502985,44.504256,44.50698,44.510048,44.511203,44.512045,44.512981,44.512108,44.513325,44.513812,44.514425,44.517546,44.519831,44.525157,44.527784,44.531585,44.534596,44.537376,44.539172,44.541745,44.54353,44.545235,44.546928,44.548444,44.551851,44.553353,44.555321,44.559782,44.562017,44.564929,44.566362,44.567833,44.570839,44.572228,44.573115,44.576399,44.579193,44.581321,44.582152,44.588985,44.592814,44.594056,44.596546,44.597702,44.600249,44.603152,44.605198,44.606225,44.608412,44.610439,44.611599,44.613731,44.61439,44.615767,44.617967,44.622239,44.623723,44.628211,44.631081,44.63302,44.633771,44.636033,44.63719,44.637365,44.639156,44.640313,44.643578,44.646223,44.64721,44.649507,44.650642,44.651538,44.652275,44.652762,44.653385,44.653849,44.654228,44.657456,44.660301,44.663489,44.665891,44.671413,44.672991,44.676467,44.67856,44.683013,44.683915,44.683929,44.685153,44.687063,44.689291,44.690417,44.6928,44.6946,44.696291,44.69753,44.698304,44.69837,44.699309,44.70078,44.703088,44.710685,44.711741,44.713707,44.713842,44.714077,44.714547,44.71558,44.716295,44.72052,44.724655,44.725896,44.727148,44.727671,44.729116,44.729236,44.730793,44.732713,44.735456,44.738266,44.741882,44.744269,44.746259,44.747845,44.748232,44.748893,44.750464,44.752723,44.754074,44.759964,44.76137,44.760886,44.762326,44.765293,44.767292,44.766914,44.769111,44.769993,44.772141,44.775136,44.775636,44.77416,44.77555,44.775543,44.772641,44.771856,44.773281,44.772311,44.772848,44.776675,44.778183,44.779277,44.777548,44.779078,44.780597,44.782159,44.78228,44.781509,44.784404,44.786813,44.7898,44.790637,44.791602,44.792548,44.792964,44.793037,44.79466,44.795847,44.800134,44.803173,44.80399,44.805407,44.806377,44.807869,44.811574,44.811634,44.81217,44.812002,44.813004,44.815433,44.815469,44.818958,44.819846,44.819734,44.820267,44.824633,44.82543,44.828908,44.829919,44.829919,44.825519,44.8247,44.825067,44.825098,44.824093,44.823272,44.823135,44.822996,44.822491,44.821769,44.82037,44.819357,44.817938,44.814826,44.812034,44.8119,44.810985,44.809966,44.809674,44.807041,44.807352,44.806314,44.80298,44.800721,44.798474,44.796406,44.795784,44.797013,44.802712,44.803969,44.802357,44.799835,44.797861,44.794719,44.792695,44.789951,44.788414,44.786038,44.784272,44.782665,44.78073,44.778767,44.776973,44.773307,44.771638,44.769866,44.767886,44.763229,44.761979,44.761175,44.653068,44.578606,44.564009,44.564036,44.563012,44.562793,44.562604,44.476499,44.476484,44.390265,44.390325,44.390428,44.390474,44.390427,44.390531,44.3906,44.390635,44.390647,44.390621,44.390631,44.390646,44.393036,44.392954,44.392893,44.393153,44.393464,44.393184,44.392612,44.392578,44.392413,44.393383,44.393387,44.393402,44.392829,44.39263,44.395459,44.398504,44.4022,44.404103,44.407373,44.408824,44.409387,44.41103,44.4118,44.413395,44.414634,44.417873,44.420456,44.424733,44.426582,44.428753,44.430542,44.431791,44.433879,44.437707,44.441974,44.444912,44.447288,44.451388,44.454743,44.458411,44.459549,44.461925,44.462899,44.464364,44.466672,44.468364]}]],[[{"lng":[-122.289972,-122.28747,-122.287458,-122.287177,-122.28769,-122.287686,-122.287818,-122.284689,-122.283449,-122.283778,-122.283792,-122.282708,-122.28273,-122.282622,-122.282585,-122.282245,-122.119656,-122.076261,-122.08045,-122.083097,-122.086152,-122.087905,-122.09102,-122.093776,-122.093953,-122.092989,-122.091829,-122.092132,-122.089048,-122.086957,-122.08859,-122.086627,-122.08697,-122.08664,-122.084436,-122.083111,-122.082668,-122.08346,-122.081345,-122.079883,-122.077287,-122.077133,-122.076045,-122.075297,-122.071996,-122.068737,-122.065175,-122.064263,-122.064303,-122.065324,-122.066487,-122.067115,-122.065992,-122.066281,-122.065023,-122.06047,-122.057458,-122.055484,-122.053544,-122.054283,-122.052383,-122.053175,-122.054621,-122.05417,-122.052183,-122.051025,-122.048329,-122.047031,-122.045526,-122.044583,-122.042643,-122.040172,-122.038962,-122.039694,-122.039964,-122.040977,-122.03966,-122.034519,-122.033634,-122.034014,-122.037333,-122.038408,-122.03965,-122.040718,-122.040658,-122.039396,-122.037335,-122.034178,-122.028174,-122.02634,-122.024834,-122.023229,-122.018876,-122.015876,-122.014804,-122.013759,-122.011983,-122.010682,-122.006618,-122.003126,-122.001997,-122.001265,-121.999218,-121.996857,-121.996478,-121.992757,-121.992743,-121.98966,-121.988228,-121.98518,-121.979423,-121.97532,-121.974199,-121.976391,-121.980554,-121.982424,-121.9839,-121.984575,-121.986399,-121.987774,-121.992765,-121.994513,-121.999904,-122.001332,-122.006263,-122.00765,-122.008778,-122.009532,-122.008532,-122.009075,-122.008467,-122.005582,-122.003164,-122.001443,-121.999293,-122.000957,-122.001748,-122.008646,-122.012305,-122.013078,-122.01326,-122.015941,-122.015598,-122.012945,-122.012157,-122.009233,-122.009346,-122.008208,-122.010144,-122.010789,-122.010403,-122.01216,-122.013147,-122.015812,-122.017972,-122.020536,-122.021663,-122.021803,-122.025284,-122.028001,-122.030376,-122.033694,-122.031057,-122.030513,-122.029159,-122.029958,-122.032684,-122.033982,-122.039166,-122.042212,-122.044577,-122.047945,-122.048876,-122.051658,-122.053217,-122.056221,-122.057121,-122.05949,-122.06024,-122.062266,-122.062769,-122.062446,-122.05922,-122.0571,-122.060407,-122.062799,-122.063256,-122.064155,-122.067515,-122.073062,-122.074132,-122.077115,-122.081246,-122.083154,-122.085681,-122.085903,-122.084586,-122.084678,-122.088043,-122.091182,-122.091581,-122.093408,-122.095125,-122.096658,-122.099629,-122.101598,-122.101702,-122.106436,-122.108581,-122.111765,-122.113959,-122.117102,-122.118494,-122.120581,-122.123909,-122.126425,-122.128491,-122.129916,-122.132883,-122.133328,-122.131782,-122.132034,-122.132435,-122.13754,-122.138814,-122.140676,-122.14345,-122.14421,-122.147305,-122.149927,-122.15296,-122.151573,-122.148739,-122.146301,-122.147339,-122.145365,-122.138621,-122.136912,-122.138978,-122.138412,-122.136458,-122.137364,-122.13888,-122.140161,-122.140492,-122.138917,-122.136871,-122.135334,-122.13445,-122.134547,-122.132848,-122.132331,-122.133356,-122.133046,-122.131417,-122.130937,-122.133547,-122.133453,-122.130529,-122.128721,-122.130579,-122.129678,-122.129797,-122.131583,-122.132474,-122.138758,-122.142355,-122.145139,-122.147726,-122.148688,-122.149534,-122.147807,-122.146222,-122.146991,-122.144946,-122.143532,-122.140274,-122.140082,-122.141768,-122.142867,-122.142806,-122.140828,-122.139145,-122.138746,-122.136349,-122.135109,-122.133674,-122.133128,-122.131616,-122.131009,-122.129193,-122.12716,-122.125264,-122.124336,-122.116677,-122.112224,-122.110753,-122.109553,-122.106566,-122.105215,-122.103544,-122.099228,-122.096613,-122.094779,-122.094982,-122.093513,-122.092318,-122.086742,-122.0826,-122.080848,-122.078379,-122.076149,-122.071291,-122.070284,-122.072724,-122.071531,-122.067707,-122.064361,-122.061334,-122.059263,-122.056872,-122.049781,-122.047708,-122.046115,-122.042529,-122.04094,-122.038966,-122.035993,-122.034958,-122.02914,-122.026748,-122.020002,-122.016941,-122.013037,-122.010965,-122.003068,-122.002362,-121.642987,-121.600018,-121.547864,-121.464437,-121.398498,-121.39767,-121.332969,-121.332609,-121.332413,-121.348471,-121.349247,-121.349315,-121.3513,-121.35055,-121.35053,-121.350007,-121.349679,-121.131887,-120.996685,-120.996696,-120.899236,-120.883327,-120.882106,-120.882106,-120.880436,-120.880501,-120.879805,-120.879925977229,-120.940201,-120.980416,-121.022114,-121.080956,-121.111238326886,-121.125007,-121.174152,-121.250331958387,-121.297304,-121.31648631619,-121.328988,-121.344911,-121.356649,-121.435531,-121.447537949131,-121.518985,-121.519526386293,-121.591106,-121.600214645464,-121.600302875257,-121.680618944726,-121.69468,-121.800981,-121.825079635986,-121.889217528984,-121.88925504236,-121.939829,-121.954084502429,-121.95743,-122.034563,-122.047234,-122.144058,-122.163511,-122.189401401612,-122.260687,-122.284835725791,-122.289748006076,-122.289972],"lat":[42.127156,42.127168,42.202994,42.288838,42.392086,42.395348,42.4745,42.4745,42.707455,42.901702,42.910926,42.910928,42.996499,43.056265,43.067719,43.06772,43.067757,43.067744,43.069772,43.069841,43.072046,43.072155,43.073641,43.076257,43.077449,43.082238,43.083706,43.086837,43.090462,43.091483,43.094927,43.096334,43.098894,43.100431,43.101539,43.103033,43.104749,43.10851,43.1135,43.115911,43.1177,43.120005,43.122069,43.126545,43.129445,43.131102,43.135701,43.140814,43.143377,43.146062,43.147204,43.149964,43.150872,43.152756,43.15248,43.154236,43.15582,43.156334,43.157965,43.162171,43.164577,43.167235,43.168662,43.172116,43.174665,43.176881,43.178552,43.181278,43.183103,43.186757,43.187293,43.189496,43.191598,43.193526,43.196262,43.197659,43.199921,43.205333,43.206901,43.207857,43.211156,43.213191,43.214102,43.216623,43.218136,43.218581,43.217497,43.218674,43.219886,43.221535,43.221998,43.224582,43.226832,43.226904,43.228348,43.232005,43.234109,43.234593,43.234065,43.23423,43.234752,43.236587,43.238929,43.239893,43.24262,43.248354,43.251153,43.253139,43.254846,43.25735,43.259784,43.260981,43.261693,43.262296,43.26518,43.268887,43.27039,43.27353,43.27473,43.277653,43.279401,43.280439,43.281121,43.281696,43.285971,43.288227,43.291051,43.294341,43.296048,43.298773,43.30118,43.302549,43.304723,43.307618,43.308993,43.310469,43.312566,43.317236,43.317991,43.31895,43.32131,43.324152,43.325457,43.327747,43.329023,43.331929,43.33516,43.337374,43.340257,43.342685,43.344697,43.345646,43.347589,43.350868,43.352741,43.358409,43.359378,43.362042,43.361911,43.360013,43.358849,43.35665,43.360048,43.361626,43.363153,43.364558,43.366071,43.368514,43.370607,43.372241,43.37526,43.377492,43.377553,43.379996,43.380888,43.381459,43.383771,43.386782,43.390573,43.39268,43.394378,43.395276,43.398562,43.399646,43.400716,43.403898,43.405868,43.406547,43.407003,43.409675,43.410852,43.412149,43.414465,43.418402,43.419318,43.420242,43.421641,43.422579,43.423647,43.426736,43.42882,43.429284,43.427893,43.425298,43.425947,43.425083,43.428032,43.429801,43.429219,43.429089,43.431354,43.431977,43.432837,43.435399,43.434663,43.435349,43.435234,43.436162,43.436528,43.437293,43.439396,43.440221,43.441124,43.443167,43.444501,43.444947,43.444169,43.442832,43.442479,43.444354,43.447662,43.448708,43.449351,43.450923,43.452654,43.45489,43.45514,43.456339,43.456987,43.459132,43.460686,43.461777,43.461778,43.463835,43.466716,43.467514,43.467445,43.468423,43.472069,43.47356,43.476034,43.478185,43.479701,43.482811,43.483834,43.485057,43.489966,43.491401,43.491969,43.496887,43.499774,43.503594,43.505694,43.507323,43.510434,43.511821,43.513285,43.513576,43.515463,43.519057,43.520693,43.523017,43.523617,43.525509,43.52841,43.528421,43.529683,43.530775,43.534465,43.535952,43.53711,43.540482,43.541944,43.543161,43.544544,43.549437,43.551491,43.553278,43.55495,43.557284,43.557376,43.558293,43.55993,43.561938,43.562447,43.56549,43.565274,43.567709,43.569273,43.572977,43.574486,43.574987,43.574618,43.575654,43.576825,43.579215,43.579642,43.579584,43.577615,43.577326,43.577964,43.579643,43.579585,43.581616,43.584945,43.58775,43.58775,43.587403,43.589719,43.590297,43.59192,43.594581,43.597881,43.597823,43.599211,43.600817,43.601615,43.601758,43.602452,43.603609,43.604822,43.606611,43.609916,43.609162,43.609274,43.614657,43.615498,43.616648,43.616443,43.616497,43.616607,43.616218,43.616295,43.616645,43.473058,43.356663,43.356753,43.111683,43.089928,42.919989,42.919989,42.91669,42.833905,42.746644,42.746775,42.746349,42.743688,42.743806,42.744214,42.486559,42.483262,42.483263,42.428587,41.996882,41.9937643415584,41.993492,41.993023,41.993308,41.995314,41.995871512136,41.996125,41.997228,41.9973071788576,41.997356,41.997018172313,41.996798,41.996214,41.996493,41.997327,41.9974692924328,41.998316,41.9983223656297,41.999164,41.9992909902104,41.9992922202857,42.0004119646647,42.000608,42.002122,42.0024146243105,42.0031934363034,42.0031938918199,42.003808,42.0035463939955,42.003485,42.004696,42.005339,42.006552,42.007264,42.0073583154912,42.007618,42.0080194929245,42.0081011637255,42.127156]}]],[[{"lng":[-121.108335,-121.108065,-121.107534,-121.077844,-121.076748,-121.058352,-121.058034,-121.014525,-120.988375,-120.988824,-120.826899,-120.827552,-120.827555,-120.597275,-120.406743,-120.386561,-120.387186,-120.385775,-120.386074,-120.36646,-120.143544,-120.101166,-120.021621,-120.020708,-120.010547,-120.000617,-119.970532,-119.960375,-119.899283,-119.899002,-119.655517,-119.654993,-119.656838,-119.657183,-119.775402,-119.777528,-119.897434,-120.237934,-120.257777,-120.258386,-120.298364,-120.378107,-120.37874,-120.747848,-120.748249,-120.918109,-120.986587,-120.986955,-120.987084,-120.987271,-121.028358,-121.09243,-121.102773,-121.102781,-121.102791,-121.102883,-121.102938,-121.108537,-121.108335],"lat":[44.26204,44.32718,44.3906,44.390531,44.390427,44.390474,44.390428,44.390325,44.390265,44.476484,44.476499,44.562604,44.562793,44.563012,44.564036,44.564009,44.476624,44.476624,44.436083,44.437015,44.437751,44.43821,44.438793,44.389687,44.389727,44.389104,44.388968,44.389457,44.389575,44.30662,44.307045,44.220276,44.220277,43.95892,43.959086,43.697957,43.6982,43.697376,43.698762,43.785297,43.785545,43.785429,43.872362,43.871331,43.95731,43.959365,43.960852,44.047637,44.076292,44.134026,44.135452,44.137751,44.138125,44.169238,44.17139,44.20241,44.218487,44.218519,44.26204]}]],[[{"lng":[-118.697766,-118.656251,-118.656266,-118.633925,-118.613243,-118.613254,-118.613107,-118.577354,-118.572271,-118.536194,-118.506296,-118.506172,-118.469471,-118.428329,-118.428539,-118.428539,-118.404806,-118.404849,-118.392817,-118.38422,-118.384117,-118.366522,-118.366326,-118.267614,-118.241665,-118.241668,-118.197876,-118.197955,-118.117464,-118.116461,-118.116362,-118.116355,-118.116309,-118.11836,-118.116844,-118.117121,-118.117194,-118.066383,-118.066513,-118.066465,-118.066506,-118.054666,-118.045102,-118.045003,-117.972948,-117.97298,-117.747327,-117.747405,-117.747464,-117.74765,-117.788395,-117.787623,-117.766865,-117.767063,-117.746137,-117.745959,-117.730633,-117.727225,-117.727235,-117.683986,-117.683794,-117.683951,-117.68379,-117.664146,-117.663391,-117.643485,-117.643494,-117.622777,-117.622801,-117.582344,-117.582674,-117.582166,-117.562208,-117.561969,-117.542058,-117.542216,-117.522249,-117.522313,-117.520674,-117.520941,-117.501432,-117.496311,-117.476762,-117.476684,-117.373361,-117.320193,-117.266006,-117.266006,-117.266005,-117.313239,-117.368183,-117.379472,-117.381873,-117.563486,-117.563402,-117.564033,-117.747664,-117.777504,-117.779549,-117.78438,-117.784917,-117.784223,-117.784287,-117.780449,-117.778261,-117.778664,-117.77942,-117.781825,-117.784715,-117.786109,-117.790617,-117.791738,-117.794182,-117.793112,-117.795976,-117.794825,-117.795624,-117.793626,-117.793905,-117.795811,-117.797179,-117.794612,-117.793418,-117.795212,-117.796519,-117.797076,-117.799062,-117.798106,-117.799102,-117.801591,-117.803038,-117.804671,-117.802486,-117.803614,-117.805343,-117.803943,-117.80439,-117.805679,-117.807106,-117.809642,-117.812501,-117.813232,-117.810901,-117.812384,-117.810499,-117.810347,-117.81202,-117.814507,-117.818062,-117.827784,-117.827377,-117.828819,-117.834022,-117.838224,-117.840934,-117.840601,-117.837244,-117.83775,-117.83989,-117.841727,-117.844909,-117.84433,-117.842069,-117.84343,-117.850204,-117.850462,-117.853788,-117.858127,-117.859832,-117.862058,-117.868648,-117.870438,-117.871887,-117.873734,-117.873396,-117.881163,-117.884041,-117.88527,-117.885361,-117.888408,-117.885732,-117.886506,-117.890152,-117.890515,-117.894708,-117.894074,-117.897252,-117.896386,-117.900497,-117.901443,-117.903603,-117.906142,-117.911901,-117.912473,-117.913393,-117.914198,-117.915266,-117.917055,-117.917634,-117.918603,-117.920378,-117.922093,-117.921696,-117.925714,-117.92723,-117.928321,-117.931873,-117.933931,-117.93636,-117.937296,-117.940522,-117.942835,-117.944977,-117.946243,-117.9477,-117.950925,-117.952633,-117.956183,-117.958124,-117.965211,-117.968688,-117.97216,-117.975378,-117.977728,-117.982631,-117.985755,-117.990182,-117.993112,-117.998992,-118.000318,-118.00333,-118.006843,-118.007344,-118.009949,-118.016228,-118.022745,-118.028283,-118.032237,-118.037125,-118.041949,-118.044232,-118.046279,-118.051814,-118.057584,-118.060105,-118.063637,-118.064404,-118.06955,-118.0717,-118.074772,-118.077997,-118.080456,-118.086523,-118.088982,-118.089673,-118.091286,-118.09213,-118.094052,-118.096972,-118.098817,-118.100661,-118.102659,-118.10804,-118.108962,-118.110422,-118.115495,-118.11925,-118.126328,-118.128407,-118.130351,-118.136551,-118.137729,-118.138203,-118.139929,-118.141185,-118.140482,-118.140876,-118.142367,-118.148405,-118.154916,-118.15578,-118.155076,-118.156488,-118.161036,-118.164484,-118.166758,-118.169815,-118.172167,-118.175223,-118.17687,-118.178908,-118.184709,-118.192549,-118.194901,-118.197174,-118.200232,-118.201486,-118.203838,-118.206973,-118.209168,-118.211519,-118.214184,-118.214497,-118.21246,-118.212459,-118.213556,-118.213478,-118.212772,-118.214731,-118.213634,-118.213869,-118.217081,-118.219197,-118.220763,-118.220371,-118.223192,-118.223739,-118.225462,-118.227421,-118.228047,-118.229691,-118.231806,-118.232658,-118.232165,-118.232197,-118.245136,-118.244662,-118.251326,-118.254562,-118.256409,-118.260454,-118.263148,-118.264747,-118.267939,-118.270121,-118.272668,-118.274333,-118.276006,-118.277008,-118.278403,-118.280496,-118.28229,-118.282246,-118.284328,-118.286304,-118.287892,-118.290194,-118.292543,-118.296386,-118.299031,-118.298941,-118.299819,-118.302714,-118.304524,-118.305238,-118.307603,-118.308807,-118.308527,-118.311985,-118.314562,-118.315687,-118.318969,-118.320187,-118.321271,-118.323544,-118.324554,-118.329464,-118.32962,-118.331747,-118.3346,-118.336217,-118.339081,-118.342078,-118.34662,-118.350693,-118.351765,-118.356323,-118.356759,-118.358389,-118.359455,-118.364214,-118.366738,-118.367815,-118.368541,-118.370856,-118.373475,-118.375376,-118.378083,-118.380085,-118.381016,-118.386538,-118.387501,-118.38708,-118.387479,-118.390619,-118.390399,-118.389864,-118.392626,-118.39477,-118.39872,-118.40065,-118.404535,-118.405273,-118.408772,-118.411093,-118.416289,-118.418766,-118.42272,-118.425078,-118.430751,-118.433878,-118.4361,-118.439339,-118.438286,-118.437099,-118.438268,-118.438524,-118.437462,-118.437612,-118.436403,-118.437351,-118.44167,-118.444209,-118.445887,-118.446726,-118.446315,-118.448093,-118.452852,-118.456019,-118.457035,-118.464283,-118.469023,-118.469598,-118.468871,-118.518689,-118.519022,-118.518687,-118.547652,-118.546632,-118.655992,-118.656102,-118.696986,-118.697013,-118.697766],"lat":[45.345647,45.345146,45.340337,45.340006,45.339884,45.345788,45.354951,45.354773,45.354767,45.354518,45.354632,45.354867,45.355164,45.35519,45.428951,45.429076,45.429013,45.44255,45.442554,45.44258,45.435246,45.43531,45.428951,45.429103,45.428841,45.427391,45.427204,45.4704,45.470702,45.470732,45.49282,45.498842,45.514652,45.514664,45.600729,45.673797,45.688607,45.688395,45.737574,45.769522,45.77346,45.773563,45.773538,45.817073,45.816896,45.860595,45.861072,45.850523,45.833238,45.773625,45.773515,45.689567,45.689605,45.660227,45.660736,45.616635,45.61692,45.61699,45.51478,45.51523,45.506771,45.441917,45.428365,45.428344,45.365749,45.365322,45.33687,45.336789,45.338171,45.338096,45.324359,45.310184,45.310219,45.295879,45.295956,45.267424,45.267731,45.253458,45.223598,45.209768,45.210148,45.209977,45.209973,45.166539,45.16654,45.166537,45.166539,45.152442,45.08057,45.080581,45.080569,45.079993,45.079997,45.079446,45.036118,44.992866,44.992426,44.992161,44.995244,44.995675,44.998322,44.999668,45.003714,45.005572,45.007621,45.009631,45.01143,45.013583,45.014289,45.013987,45.014854,45.016317,45.016682,45.018583,45.018489,45.020454,45.021648,45.022058,45.023142,45.02278,45.023925,45.023959,45.025795,45.026273,45.025335,45.026679,45.026766,45.028164,45.029284,45.02915,45.02718,45.028184,45.029705,45.030495,45.029481,45.031851,45.032625,45.032832,45.031655,45.032445,45.032274,45.030655,45.028808,45.027532,45.026711,45.025607,45.024511,45.024491,45.025909,45.033314,45.035472,45.037596,45.042113,45.04804,45.050658,45.051643,45.052819,45.055138,45.055136,45.054096,45.054797,45.056057,45.057026,45.058477,45.059736,45.060351,45.060443,45.059753,45.055712,45.054525,45.05758,45.060146,45.064703,45.065639,45.060713,45.059622,45.060095,45.058249,45.056709,45.0571,45.051089,45.049436,45.048706,45.047569,45.04524,45.043706,45.039581,45.037917,45.036321,45.034604,45.033156,45.030232,45.028008,45.028207,45.027236,45.026847,45.026033,45.025357,45.024736,45.024485,45.023006,45.020889,45.019079,45.016939,45.016787,45.015197,45.013626,45.014081,45.0125,45.012767,45.009324,45.008418,45.006667,45.006698,45.006582,45.004881,45.002967,45.000952,45.000621,44.997626,44.995908,44.99617,44.995873,44.994951,44.995409,44.99459,44.99525,44.994448,44.994348,44.994876,44.99484,44.996376,44.997415,44.997644,45.000595,45.001635,45.003403,45.003881,45.004007,45.006961,45.006868,45.00991,45.012785,45.012569,45.012924,45.014088,45.015179,45.016873,45.019598,45.021068,45.024723,45.025648,45.032029,45.033716,45.036878,45.038568,45.041238,45.042327,45.04233,45.044892,45.044347,45.045602,45.046198,45.046801,45.046962,45.045162,45.044761,45.044444,45.045214,45.045024,45.040799,45.040018,45.036458,45.035513,45.033844,45.031677,45.02945,45.027725,45.026728,45.022278,45.020442,45.018775,45.017883,45.015711,45.016657,45.016103,45.017161,45.017105,45.019388,45.019389,45.017995,45.019389,45.017997,45.017329,45.015325,45.015104,45.013155,45.01232,45.010203,45.010094,45.008201,45.007421,45.006585,45.005306,45.00108,44.999353,44.996519,44.995073,44.991343,44.990567,44.989174,44.988505,44.987447,44.984888,44.983722,44.981549,44.979158,44.977488,44.976652,44.973481,44.97237,44.969921,44.966976,44.963285,44.960686,44.960686,44.958396,44.956351,44.956457,44.956934,44.956655,44.958896,44.95929,44.958731,44.957313,44.957659,44.957348,44.957896,44.96023,44.961771,44.962104,44.963114,44.964726,44.964459,44.965046,44.964509,44.962755,44.962913,44.960768,44.96063,44.963426,44.963839,44.968559,44.968488,44.969209,44.969659,44.970771,44.972016,44.971568,44.972586,44.974252,44.975929,44.975415,44.973044,44.972832,44.971889,44.972329,44.973393,44.975827,44.976675,44.978879,44.979593,44.983748,44.986988,44.987332,44.987824,44.988214,44.990605,44.992174,44.992301,44.990763,44.986714,44.985957,44.984037,44.982434,44.981597,44.981894,44.980115,44.979488,44.98129,44.983712,44.983786,44.980483,44.979407,44.97756,44.974115,44.972402,44.972544,44.973976,44.97436,44.975912,44.976476,44.975031,44.973309,44.971192,44.968752,44.967006,44.965656,44.963809,44.963891,44.96256,44.96242,44.96625,44.968054,44.971665,44.975192,44.977115,44.978587,44.980277,44.98298,44.984781,44.985326,44.986752,44.986767,44.988471,44.990024,44.990623,44.989289,44.989514,44.990257,44.989822,44.991737,44.992707,44.995176,44.995877,45.010173,45.08069,45.080753,45.196898,45.196928,45.257729,45.257715,45.259928,45.345647]}]],[[{"lng":[-124.214477,-124.210531,-124.210203396979,-124.208958,-124.206343,-124.206343,-124.206343,-124.200217,-124.193623,-124.193984,-124.177685,-124.16856,-124.164503939476,-124.158728145934,-124.138807,-124.104167,-124.102125,-124.101667,-124.098533,-124.064614,-124.064585,-124.025781,-124.005944,-123.98581,-123.96592,-123.946294,-123.946529,-123.934708,-123.925479,-123.926089,-123.925917,-123.916158,-123.907166,-123.902391,-123.902195,-123.897407,-123.897197,-123.882804,-123.882553,-123.877749,-123.877485,-123.872667,-123.872566,-123.872399,-123.862685,-123.862381,-123.852602,-123.852268,-123.847397,-123.847057,-123.842136,-123.842059,-123.837143,-123.837073,-123.832118,-123.831984,-123.827036,-123.827004,-123.81007,-123.75871,-123.734733,-123.7038,-123.703628,-123.658767,-123.658909,-123.619012,-123.619621,-123.619367,-123.619574,-123.57958,-123.579689,-123.529005,-123.529153,-123.470251,-123.470371,-123.411426,-123.397831,-123.3482,-123.348246,-123.313129,-123.312001,-123.185986,-123.153653,-123.147539,-123.137319,-123.138001,-123.137646,-123.137588,-123.13733,-123.137211,-123.107318,-123.107672,-123.107475,-122.987626,-122.987618,-122.970915,-122.935501,-122.932533,-122.9124,-122.892765,-122.833744,-122.781518,-122.776409,-122.771564,-122.741845,-122.741914,-122.741317,-122.741716,-122.622946,-122.622914,-122.508438,-122.508441,-122.447124,-122.27067,-122.270653,-122.132034,-122.131782,-122.133328,-122.132883,-122.129916,-122.128491,-122.126425,-122.123909,-122.120581,-122.118494,-122.117102,-122.113959,-122.111765,-122.108581,-122.106436,-122.101702,-122.101598,-122.099629,-122.096658,-122.095125,-122.093408,-122.091581,-122.091182,-122.088043,-122.084678,-122.084586,-122.085903,-122.085681,-122.083154,-122.081246,-122.077115,-122.074132,-122.073062,-122.067515,-122.064155,-122.063256,-122.062799,-122.060407,-122.0571,-122.05922,-122.062446,-122.062769,-122.062266,-122.06024,-122.05949,-122.057121,-122.056221,-122.053217,-122.051658,-122.048876,-122.047945,-122.044577,-122.042212,-122.039166,-122.033982,-122.032684,-122.029958,-122.029159,-122.030513,-122.031057,-122.033694,-122.030376,-122.028001,-122.025284,-122.021803,-122.021663,-122.020536,-122.017972,-122.015812,-122.013147,-122.01216,-122.010403,-122.010789,-122.010144,-122.008208,-122.009346,-122.009233,-122.012157,-122.012945,-122.015598,-122.015941,-122.01326,-122.013078,-122.012305,-122.008646,-122.001748,-122.000957,-121.999293,-122.001443,-122.003164,-122.005582,-122.008467,-122.009075,-122.008532,-122.009532,-122.008778,-122.00765,-122.006263,-122.001332,-121.999904,-121.994513,-121.992765,-121.987774,-121.986399,-121.984575,-121.9839,-121.982424,-121.980554,-121.976391,-121.974199,-121.97532,-121.979423,-121.98518,-121.988228,-121.98966,-121.992743,-121.992757,-121.996478,-121.996857,-121.999218,-122.001265,-122.001997,-122.003126,-122.006618,-122.010682,-122.011983,-122.013759,-122.014804,-122.015876,-122.018876,-122.023229,-122.024834,-122.02634,-122.028174,-122.034178,-122.037335,-122.039396,-122.040658,-122.040718,-122.03965,-122.038408,-122.037333,-122.034014,-122.033634,-122.034519,-122.03966,-122.040977,-122.039964,-122.039694,-122.038962,-122.040172,-122.042643,-122.044583,-122.045526,-122.047031,-122.048329,-122.051025,-122.052183,-122.05417,-122.054621,-122.053175,-122.052383,-122.054283,-122.053544,-122.055484,-122.057458,-122.06047,-122.065023,-122.066281,-122.065992,-122.067115,-122.066487,-122.065324,-122.064303,-122.064263,-122.065175,-122.068737,-122.071996,-122.075297,-122.076045,-122.077133,-122.077287,-122.079883,-122.081345,-122.08346,-122.082668,-122.083111,-122.084436,-122.08664,-122.08697,-122.086627,-122.08859,-122.086957,-122.089048,-122.092132,-122.091829,-122.092989,-122.093953,-122.093776,-122.09102,-122.087905,-122.086152,-122.083097,-122.08045,-122.076261,-122.119656,-122.282245,-122.282585,-122.282622,-122.28273,-122.385922,-122.40031,-122.401025,-122.401041,-122.401077,-122.420844,-122.420863,-122.440535,-122.440505,-122.46021,-122.460224,-122.520525,-122.520741,-122.560273,-122.560299,-122.580049,-122.580094,-122.600202,-122.600251,-122.621665,-122.637812,-122.637695,-122.677181,-122.677198,-122.697017,-122.69701,-122.716657,-122.716699,-122.736329,-122.736367,-122.756033,-122.756079,-122.775223,-122.775044,-122.784914,-122.785493,-122.794811,-122.794776,-122.814413,-122.833971,-122.853707,-122.852943,-122.868692,-122.911925,-122.9178,-122.93175,-122.9451,-122.951199,-122.95119,-122.970829,-122.970492,-122.990035,-122.990728,-123.009744,-123.009765,-123.112688,-123.112652,-123.152233,-123.152023,-123.180512,-123.180551,-123.190456,-123.190504,-123.200419,-123.200424,-123.209912,-123.210392,-123.229635,-123.229619,-123.249209,-123.249328,-123.27426,-123.274283,-123.309197,-123.309162,-123.328626,-123.328588,-123.347048,-123.366666,-123.36665,-123.371581,-123.371999,-123.400242,-123.401297,-123.4014,-123.406341,-123.406299,-123.425721,-123.425687,-123.431052,-123.444922,-123.445456,-123.455213,-123.455304,-123.465271,-123.465261,-123.484693,-123.494304,-123.494414,-123.523444,-123.542539,-123.542433,-123.562168,-123.562086,-123.567036,-123.566777,-123.571728,-123.571814,-123.581862,-123.581699,-123.677275,-123.677206,-123.687082,-123.687089,-123.697,-123.696843,-123.701384,-123.716505,-123.716492,-123.716495,-123.720137,-123.723188,-123.726832,-123.732315,-123.734082,-123.735741,-123.739229,-123.740093,-123.741725,-123.743493,-123.746879,-123.750436,-123.752421,-123.754526,-123.756486,-123.759427,-123.761476,-123.764019,-123.766112,-123.76995,-123.773571,-123.778041,-123.780349,-123.783304,-123.789263,-123.7917,-123.795111,-123.796456,-123.796749,-123.799136,-123.800083,-123.800444,-123.803732,-123.806976,-123.808536,-123.811553,-123.811789,-123.820439,-123.819144,-123.81915,-123.819496,-123.820515,-123.821513,-123.821121,-123.821118,-123.761594,-123.761384,-123.761333,-123.707057,-123.707059,-123.702144,-123.702139,-123.702131,-123.702167,-123.703655,-123.703417,-123.703568,-123.703862,-123.704456,-123.704752,-123.764356,-123.764339,-123.763917,-123.764496,-123.762289,-123.761983,-123.762801,-123.761528,-123.764884,-123.769016,-123.817614,-123.817154,-123.816657,-123.875628,-123.875698,-123.949573,-123.949565,-123.979004,-124.062969,-124.100765,-124.146347,-124.180894,-124.183435,-124.218966377223,-124.214477],"lat":[43.627619,43.653347,43.6547163514708,43.659922,43.666628,43.6691103603323,43.674021,43.689555,43.706137,43.706674,43.767228,43.808955,43.8315479200854,43.8637200341693,43.863611,43.863289,43.863417,43.86343,43.863512,43.86421,43.862277,43.862224,43.862996,43.862001,43.863042,43.862737,43.871689,43.866012,43.865947,43.878689,43.898476,43.897322,43.896252,43.896281,43.900512,43.900512,43.904714,43.904582,43.908714,43.908629,43.91275,43.912655,43.914097,43.916733,43.916562,43.920658,43.920553,43.924682,43.924661,43.928822,43.928878,43.932429,43.932458,43.935984,43.935987,43.94308,43.94305,43.944837,43.944581,43.943882,43.944062,43.944319,43.937399,43.936474,43.921672,43.921117,43.906509,43.899074,43.891672,43.891057,43.868291,43.86833,43.830061,43.831183,43.810056,43.809877,43.809076,43.809212,43.78017,43.77991,43.77991,43.779533,43.779631,43.779635,43.77967,43.753648,43.736284,43.677086,43.649355,43.605906,43.605889,43.542099,43.540013,43.538988,43.540992,43.541679,43.54417,43.544357,43.543886,43.544882,43.544702,43.543912,43.544034,43.544317,43.544654,43.517582,43.452015,43.437395,43.438458,43.440262,43.440226,43.441275,43.44141,43.441628,43.440011,43.440221,43.439396,43.437293,43.436528,43.436162,43.435234,43.435349,43.434663,43.435399,43.432837,43.431977,43.431354,43.429089,43.429219,43.429801,43.428032,43.425083,43.425947,43.425298,43.427893,43.429284,43.42882,43.426736,43.423647,43.422579,43.421641,43.420242,43.419318,43.418402,43.414465,43.412149,43.410852,43.409675,43.407003,43.406547,43.405868,43.403898,43.400716,43.399646,43.398562,43.395276,43.394378,43.39268,43.390573,43.386782,43.383771,43.381459,43.380888,43.379996,43.377553,43.377492,43.37526,43.372241,43.370607,43.368514,43.366071,43.364558,43.363153,43.361626,43.360048,43.35665,43.358849,43.360013,43.361911,43.362042,43.359378,43.358409,43.352741,43.350868,43.347589,43.345646,43.344697,43.342685,43.340257,43.337374,43.33516,43.331929,43.329023,43.327747,43.325457,43.324152,43.32131,43.31895,43.317991,43.317236,43.312566,43.310469,43.308993,43.307618,43.304723,43.302549,43.30118,43.298773,43.296048,43.294341,43.291051,43.288227,43.285971,43.281696,43.281121,43.280439,43.279401,43.277653,43.27473,43.27353,43.27039,43.268887,43.26518,43.262296,43.261693,43.260981,43.259784,43.25735,43.254846,43.253139,43.251153,43.248354,43.24262,43.239893,43.238929,43.236587,43.234752,43.23423,43.234065,43.234593,43.234109,43.232005,43.228348,43.226904,43.226832,43.224582,43.221998,43.221535,43.219886,43.218674,43.217497,43.218581,43.218136,43.216623,43.214102,43.213191,43.211156,43.207857,43.206901,43.205333,43.199921,43.197659,43.196262,43.193526,43.191598,43.189496,43.187293,43.186757,43.183103,43.181278,43.178552,43.176881,43.174665,43.172116,43.168662,43.167235,43.164577,43.162171,43.157965,43.156334,43.15582,43.154236,43.15248,43.152756,43.150872,43.149964,43.147204,43.146062,43.143377,43.140814,43.135701,43.131102,43.129445,43.126545,43.122069,43.120005,43.1177,43.115911,43.1135,43.10851,43.104749,43.103033,43.101539,43.100431,43.098894,43.096334,43.094927,43.091483,43.090462,43.086837,43.083706,43.082238,43.077449,43.076257,43.073641,43.072155,43.072046,43.069841,43.069772,43.067744,43.067757,43.06772,43.067719,43.056265,42.996499,42.996644,42.996632,42.996632,42.993456,42.983458,42.983439,42.968927,42.968923,42.95442,42.954373,42.939873,42.93976,42.939077,42.939185,42.92469,42.924651,42.9108,42.911073,42.895693,42.896812,42.89699,42.881141,42.88108,42.866603,42.866572,42.852099,42.85211,42.837671,42.837661,42.823496,42.823195,42.828689,42.8288,42.806831,42.806845,42.792712,42.792721,42.778221,42.780511,42.780653,42.781766,42.774603,42.774541,42.774704,42.774753,42.774874,42.774805,42.774773,42.767555,42.768116,42.760945,42.76095,42.759538,42.75941,42.752144,42.752218,42.75575,42.755835,42.737721,42.737765,42.731655,42.731703,42.724495,42.724474,42.717236,42.717161,42.709983,42.709956,42.70261,42.702421,42.724404,42.724712,42.73203,42.732055,42.728412,42.728247,42.73175,42.732226,42.732194,42.739471,42.739484,42.724955,42.724951,42.724958,42.710297,42.710288,42.713966,42.714483,42.711039,42.710928,42.711122,42.703025,42.702982,42.699406,42.699297,42.702942,42.702168,42.702248,42.70918,42.709186,42.709832,42.717122,42.717574,42.724796,42.72483,42.735693,42.735716,42.732098,42.732149,42.73992,42.739682,42.750145,42.750274,42.753789,42.753907,42.739593,42.739703,42.739658,42.784061,42.785376,42.784164,42.783945,42.781526,42.780131,42.781753,42.782516,42.782865,42.783343,42.786552,42.787971,42.788228,42.787735,42.788245,42.789804,42.789808,42.79107,42.792391,42.792059,42.793468,42.794568,42.797407,42.797665,42.798915,42.799426,42.798147,42.797302,42.793699,42.792936,42.79277,42.790954,42.790094,42.78959,42.787536,42.786983,42.787868,42.788837,42.824101,42.824112,42.884356,42.885135,42.909661,42.909675,42.924483,42.965284,42.996291,42.996318,43.054511,43.08316,43.083457,43.087067,43.087083,43.112458,43.113946,43.17059,43.170579,43.177696,43.186134,43.214139,43.243253,43.257741,43.258054,43.2636,43.287099,43.344799,43.351419,43.358748,43.387997,43.422294,43.431548,43.431695,43.431306,43.459594,43.516449,43.515947,43.608407,43.608472,43.609265,43.609363,43.609641,43.611244,43.611216,43.611445,43.610925,43.6109319633736,43.627619]}]],[[{"lng":[-122.929193,-122.928956,-122.929145,-122.929122,-122.929146,-122.885463,-122.87539,-122.863423,-122.784735,-122.784663,-122.762437,-122.762189526428,-122.772511,-122.772681206097,-122.774511,-122.76381,-122.762414110309,-122.743540245466,-122.738109,-122.713309,-122.691381583242,-122.6911850902,-122.691008,-122.675327484197,-122.675093773773,-122.675008,-122.643907,-122.634962906196,-122.607718206328,-122.602606,-122.588917822907,-122.586005557515,-122.582325993186,-122.581406,-122.55127899822,-122.550211685523,-122.549955276927,-122.549438939157,-122.548149,-122.545981397444,-122.523668,-122.505353096256,-122.49601900833,-122.492259,-122.479315,-122.475778139509,-122.474659,-122.471883289024,-122.455261778702,-122.453891,-122.438674,-122.416934004748,-122.410706,-122.401222955157,-122.397100512625,-122.391802,-122.383435896741,-122.380302,-122.372189242991,-122.352802,-122.341811701881,-122.339070265255,-122.331502,-122.294901,-122.294819998052,-122.266701,-122.262625,-122.259530999909,-122.248993,-122.248911947664,-122.2017,-122.197527546048,-122.183695,-122.166829998749,-122.14075,-122.129548,-122.12949,-122.126197,-122.126197,-122.112356,-122.101675,-122.100176014643,-122.044374,-122.022571,-122.00369,-121.983038,-121.979797,-121.963547,-121.961258017759,-121.955734,-121.951838,-121.935149,-121.922028852172,-121.922051,-121.918698,-121.916509,-121.915478,-121.913115,-121.915184,-121.915527,-121.914551,-121.915913,-121.915803,-121.918095,-121.918386,-121.91549,-121.910547,-121.910516,-121.911443,-121.913019,-121.913911,-121.912619,-121.910309,-121.907326,-121.908329,-121.907176,-121.906325,-121.902915,-121.903291,-121.902678,-121.901879,-121.908793,-121.911695,-121.919685,-121.922136,-121.91644,-121.913216,-121.913761,-121.913087,-121.911614,-121.911443,-121.909746,-121.906924,-121.906688,-121.902817,-121.895902,-121.89392,-121.891749,-121.888674,-121.885605,-121.881862,-121.878538,-121.874665,-121.870166,-121.869342,-121.868187,-121.866919,-121.864656,-121.860873,-121.859828,-121.860137,-121.861111,-121.86337,-121.860323,-121.85882,-121.854653,-121.850403,-121.847872,-121.846821,-121.846764,-121.844301,-121.842521,-121.836809,-121.83527,-121.831765,-121.828898,-121.824922,-121.821485,-121.819587,-121.821959,-121.821956,-121.983148,-121.983147,-122.004194,-122.085981,-122.126544,-122.126545,-122.147212,-122.166674,-122.249969,-122.249828,-122.263944,-122.2727,-122.305836,-122.316084,-122.342882,-122.348315,-122.357752,-122.372096,-122.372796,-122.383141,-122.389346,-122.403758,-122.41397,-122.414457,-122.439145,-122.443966,-122.447789,-122.45466,-122.466639,-122.468001,-122.47253,-122.474558,-122.47555,-122.479942,-122.485866,-122.486584,-122.496748,-122.499336,-122.501043,-122.501787,-122.504364,-122.507261,-122.510439,-122.514243,-122.517067,-122.527468,-122.530085,-122.532488,-122.537618,-122.547638,-122.548002,-122.55301,-122.558255,-122.565483,-122.568617,-122.570126,-122.571309,-122.57905,-122.583961,-122.5855,-122.58613,-122.586836,-122.58937,-122.596245,-122.596603,-122.596702,-122.597184,-122.597198,-122.597395,-122.59762,-122.597665,-122.599675,-122.601454,-122.60175,-122.60573,-122.606614,-122.608722,-122.610832,-122.613127,-122.615374,-122.616195,-122.616871,-122.618341,-122.618588,-122.618995,-122.618977,-122.622359,-122.626278,-122.632974,-122.63656,-122.636587,-122.64158,-122.641245,-122.646958,-122.652921,-122.652988,-122.656972,-122.660979,-122.659105,-122.658274,-122.652605,-122.651227,-122.647666,-122.64616,-122.646267,-122.651183,-122.648787,-122.648725,-122.654959,-122.660451,-122.666145,-122.666298,-122.672677,-122.673311,-122.675572,-122.681893,-122.682505,-122.694678,-122.697382,-122.698697,-122.701808,-122.702001,-122.703304,-122.705021,-122.707893,-122.712169,-122.715938,-122.719286,-122.721355,-122.721663,-122.725541,-122.7303,-122.733422,-122.738563,-122.741101,-122.743721,-122.743718,-122.743703,-122.743691,-122.743673,-122.743668,-122.743649,-122.743659,-122.743667,-122.743672,-122.743663,-122.743654,-122.743626,-122.743671,-122.743681,-122.743711,-122.743745,-122.743746,-122.743758,-122.743798,-122.743799,-122.743809,-122.743785,-122.743803,-122.743805,-122.743813,-122.743815,-122.743828,-122.743847,-122.743856,-122.743859,-122.743859,-122.743862,-122.764464,-122.764486,-122.764472,-122.764459,-122.764458,-122.764439,-122.764436,-122.764412,-122.765076,-122.76609,-122.77215,-122.774659,-122.779838,-122.78234,-122.783624,-122.784232,-122.784864,-122.784768,-122.784769,-122.78477,-122.784771,-122.795111,-122.792699,-122.795914,-122.796057,-122.803132,-122.804585,-122.805432,-122.805481,-122.826005,-122.826222,-122.826342,-122.846978,-122.846905,-122.846849,-122.866745,-122.867592,-122.867495,-122.868303,-122.887963,-122.887837,-122.908992,-122.909078,-122.918725,-122.929128,-122.929193],"lat":[45.671015,45.67835,45.69381,45.698697,45.721482,45.721378,45.721418,45.721416,45.720946,45.72865,45.728665,45.7285767375573,45.699637,45.6980030214684,45.680437,45.657138,45.6564319354118,45.6468852157137,45.644138,45.637438,45.6249517318773,45.6248398415969,45.624739,45.6181727840074,45.6180749177675,45.618039,45.609739,45.6092842265807,45.6078989364008,45.607639,45.6052506713647,45.6047425360023,45.6041005214526,45.60394,45.5974429961583,45.5972128260687,45.5971575305685,45.597046180342,45.596768,45.5961361625816,45.589632,45.5859286680353,45.5840412856794,45.583281,45.579761,45.5786549714616,45.578305,45.5768358833279,45.5680385200064,45.567313,45.563585,45.5667315782601,45.567633,45.5710983445711,45.5726047893983,45.574541,45.5755594821359,45.575941,45.5740234392524,45.569441,45.558502299525,45.5557737334935,45.548241,45.543541,45.5435418617228,45.543841,45.544321,45.5450981314783,45.547745,45.5477731000169,45.564141,45.5672822170685,45.577696,45.5803711516712,45.584508,45.582945,45.582967,45.582573,45.582617,45.581409,45.583516,45.5841961560057,45.609516,45.615151,45.61593,45.622812,45.624839,45.632784,45.6359407622737,45.643559,45.644951,45.644169,45.6491618990508,45.610761,45.608288,45.607635,45.605163,45.601297,45.598698,45.597109,45.593684,45.591609,45.589685,45.587287,45.585484,45.582447,45.581241,45.579733,45.576484,45.575168,45.571163,45.568211,45.566826,45.566723,45.564983,45.56255,45.561935,45.561121,45.559517,45.55686,45.55619,45.549992,45.548941,45.547614,45.546673,45.543205,45.537275,45.535329,45.532567,45.530303,45.529082,45.526749,45.524655,45.520828,45.51853,45.514896,45.513388,45.512631,45.512252,45.512408,45.513125,45.514295,45.515751,45.514598,45.514103,45.508715,45.506786,45.504495,45.501814,45.499168,45.496923,45.495096,45.492844,45.489377,45.489006,45.486638,45.486502,45.483377,45.481329,45.47907,45.476188,45.476109,45.474619,45.472492,45.470184,45.467466,45.465469,45.46333,45.461675,45.461674,45.460226,45.460237,45.461403,45.461534,45.46058,45.461299,45.460039,45.460828,45.460837,45.460935,45.461422,45.461412,45.461394,45.461439,45.46149,45.461529,45.461502,45.461426,45.461222,45.46123,45.461276,45.4613,45.461421,45.461581,45.461579,45.461134,45.461001,45.460974,45.460941,45.461127,45.461135,45.461173,45.461184,45.461183,45.461176,45.461138,45.461132,45.460982,45.461028,45.46107,45.461107,45.461187,45.461252,45.461256,45.46126,45.461262,45.461273,45.461296,45.461318,45.461353,45.461058,45.461045,45.461053,45.461062,45.461307,45.461365,45.46138,45.461392,45.461518,45.461494,45.461487,45.461483,45.461522,45.46149,45.461458,45.461458,45.461458,45.461457,45.461457,45.461457,45.461453,45.461453,45.461454,45.461464,45.461486,45.461488,45.461493,45.461505,45.461501,45.461493,45.461481,45.461473,45.460889,45.460832,45.460933,45.460908,45.461451,45.461444,45.461451,45.46155,45.461474,45.461476,45.461482,45.458671,45.458669,45.458318,45.458314,45.458066,45.457819,45.454341,45.453242,45.445741,45.445281,45.443983,45.441424,45.439584,45.436059,45.432811,45.432718,45.432668,45.432702,45.432743,45.432743,45.432792,45.432795,45.432867,45.432841,45.432841,45.43301,45.433041,45.433041,45.433041,45.433056,45.433038,45.433037,45.433042,45.433056,45.433079,45.433113,45.433135,45.433137,45.433167,45.43324,45.433199,45.433238,45.433268,45.433294,45.435079,45.442944,45.444663,45.447284,45.447693,45.454892,45.456685,45.458486,45.465576,45.467532,45.469466,45.476439,45.476442,45.477961,45.484201,45.487084,45.48725,45.488258,45.494401,45.494665,45.497618,45.505017,45.506834,45.507374,45.507886,45.508181,45.509582,45.512509,45.5144,45.515754,45.516665,45.519509,45.519562,45.526737,45.528166,45.529634,45.529727,45.531184,45.531344,45.533822,45.533858,45.533852,45.533815,45.533809,45.533897,45.533946,45.533971,45.533982,45.533994,45.54232,45.543979,45.545158,45.5484,45.548433,45.54935,45.552082,45.555695,45.555689,45.556182,45.555687,45.562911,45.563041,45.568063,45.577521,45.577516,45.581018,45.591836,45.591881,45.591878,45.606226,45.606223,45.606352,45.620466,45.620763,45.635228,45.635399,45.635313,45.671015]}]],[[{"lng":[-119.672228,-119.667065,-119.603647,-119.593374,-119.552894,-119.544565,-119.306611,-119.306043,-119.162966,-119.002263,-118.946612,-118.675353,-118.518689,-118.468871,-118.469598,-118.469023,-118.464283,-118.457035,-118.456019,-118.452852,-118.448093,-118.446315,-118.446726,-118.445887,-118.444209,-118.44167,-118.437351,-118.436403,-118.437612,-118.437462,-118.438524,-118.438268,-118.437099,-118.438286,-118.439339,-118.4361,-118.433878,-118.430751,-118.425078,-118.42272,-118.418766,-118.416289,-118.411093,-118.408772,-118.405273,-118.404535,-118.40065,-118.39872,-118.39477,-118.392626,-118.389864,-118.390399,-118.390619,-118.387479,-118.38708,-118.387501,-118.386538,-118.381016,-118.380085,-118.378083,-118.375376,-118.373475,-118.370856,-118.368541,-118.367815,-118.366738,-118.364214,-118.359455,-118.358389,-118.356759,-118.356323,-118.351765,-118.350693,-118.34662,-118.342078,-118.339081,-118.336217,-118.3346,-118.331747,-118.32962,-118.329464,-118.324554,-118.323544,-118.321271,-118.320187,-118.318969,-118.315687,-118.314562,-118.311985,-118.308527,-118.308807,-118.307603,-118.305238,-118.304524,-118.302714,-118.299819,-118.298941,-118.299031,-118.296386,-118.292543,-118.290194,-118.287892,-118.286304,-118.284328,-118.282246,-118.28229,-118.280496,-118.278403,-118.277008,-118.276006,-118.274333,-118.272668,-118.270121,-118.267939,-118.264747,-118.263148,-118.260454,-118.256409,-118.254562,-118.251326,-118.244662,-118.243553,-118.244533,-118.24364,-118.245043,-118.244382,-118.24161,-118.237322,-118.23623,-118.233636,-118.229663,-118.227547,-118.226449,-118.223449,-118.225709,-118.226727,-118.226561,-118.22828,-118.231337,-118.232128,-118.231634,-118.227791,-118.229421,-118.232795,-118.235115,-118.237399,-118.236831,-118.234808,-118.235656,-118.235589,-118.236369,-118.235329,-118.231462,-118.232402,-118.230979,-118.229972,-118.226627,-118.224904,-118.228056,-118.22816,-118.227459,-118.228076,-118.23518,-118.236861,-118.24055,-118.242499,-118.246533,-118.253802,-118.258237,-118.261829,-118.264012,-118.267786,-118.2759,-118.279179,-118.283489,-118.2872,-118.289794,-118.295659,-118.296234,-118.294716,-118.294909,-118.293566,-118.29906,-118.302862,-118.306764,-118.306817,-118.309246,-118.312281,-118.314454,-118.3187,-118.317934,-118.313907,-118.308421,-118.30847,-118.310056,-118.311173,-118.308837,-118.307233,-118.307522,-118.304572,-118.303366,-118.300975,-118.296269,-118.295068,-118.294827,-118.296548,-118.298077,-118.2978,-118.296578,-118.298355,-118.299459,-118.294383,-118.293393,-118.294019,-118.294094,-118.292122,-118.290151,-118.284994,-118.283385,-118.28311,-118.286294,-118.287422,-118.28984,-118.289351,-118.288299,-118.286739,-118.286281,-118.286743,-118.285439,-118.289862,-118.292079,-118.294194,-118.296443,-118.29877,-118.300094,-118.302565,-118.305462,-118.306628,-118.311639,-118.316347,-118.319306,-118.321741,-118.325783,-118.329785,-118.332304,-118.336355,-118.339207,-118.343374,-118.346502,-118.350798,-118.35243,-118.358121,-118.361673,-118.365587,-118.367621,-118.372775,-118.376666,-118.379786,-118.381491,-118.383411,-118.383321,-118.385176,-118.387277,-118.387177,-118.391704,-118.391656,-118.394052,-118.393659,-118.395839,-118.40025,-118.403611,-118.413647,-118.417419,-118.418867,-118.418247,-118.419907,-118.419381,-118.422747,-118.425086,-118.43182,-118.432064,-118.433707,-118.435673,-118.437712,-118.440003,-118.443456,-118.445862,-118.45227,-118.459157,-118.460487,-118.461866,-118.460802,-118.461528,-118.464244,-118.468284,-118.470581,-118.473427,-118.476922,-118.480904,-118.483704,-118.488174,-118.491292,-118.492404,-118.495257,-118.495729,-118.496169,-118.496583,-118.496787,-118.497422,-118.497865,-118.498161,-118.498373,-118.498457,-118.499774,-118.501794,-118.505765,-118.507765,-118.509705,-118.513679,-118.516539,-118.518181,-118.51944,-118.519174,-118.516452,-118.51749,-118.51765,-118.518688,-118.517591,-118.513986,-118.512691,-118.511088,-118.510957,-118.50892,-118.507077,-118.507257,-118.504437,-118.504435,-118.500889,-118.497947,-118.493278,-118.488713,-118.485639,-118.48214,-118.47732,-118.473527,-118.472734,-118.463113,-118.460962,-118.456063,-118.453139,-118.451401,-118.446702,-118.441788,-118.438184,-118.436806,-118.433626,-118.432342,-118.429638,-118.425197,-118.422329,-118.41909,-118.417036,-118.414113,-118.412928,-118.41088,-118.410214,-118.404947,-118.403639,-118.402581,-118.399942,-118.393181,-118.391024,-118.388087,-118.38634,-118.386038,-118.379855,-118.377906,-118.375037,-118.372365,-118.3711,-118.368572,-118.36454,-118.362249,-118.360273,-118.355851,-118.354824,-118.353557,-118.343684,-118.343208,-118.342172,-118.342194,-118.344374,-118.341779,-118.341699,-118.342567,-118.341934,-118.338063,-118.338852,-118.337588,-118.336404,-118.333246,-118.329297,-118.319431,-118.316589,-118.314537,-118.312564,-118.309704,-118.311853,-118.311696,-118.309328,-118.305778,-118.305777,-118.306961,-118.308934,-118.311222,-118.310984,-118.315622,-118.314069,-118.316873,-118.315482,-118.31769,-118.317296,-118.31982,-118.322737,-118.323526,-118.32617,-118.327739,-118.328495,-118.332254,-118.334252,-118.337408,-118.337886,-118.343274,-118.343872,-118.345607,-118.346866,-118.346234,-118.347614,-118.347966,-118.346739,-118.349305,-118.351025,-118.352379,-118.354821,-118.354205,-118.356315,-118.358417,-118.359224,-118.364066,-118.365535,-118.369628,-118.37153,-118.372225,-118.370803,-118.371036,-118.368806,-118.371346,-118.374236,-118.374509,-118.373523,-118.374563,-118.373195,-118.372863,-118.370202,-118.367772,-118.366115,-118.364615,-118.365086,-118.363427,-118.360667,-118.357986,-118.362312,-118.367042,-118.36365,-118.36231,-118.360732,-118.36514,-118.367973,-118.36939,-118.372852,-118.375367,-118.376741,-118.378302,-118.380034,-118.383108,-118.386097,-118.388293,-118.39201,-118.394593,-118.398703,-118.402845,-118.405392,-118.408786,-118.411069,-118.41351,-118.418155,-118.419336,-118.420911,-118.421542,-118.422173,-118.421545,-118.420601,-118.420366,-118.418457,-118.420684,-118.423597,-118.422102,-118.422418,-118.42895,-118.429108,-118.428322,-118.430919,-118.431147,-118.434066,-118.434853,-118.435954,-118.434932,-118.43501,-118.431707,-118.425493,-118.427067,-118.428483,-118.428326,-118.424394,-118.422586,-118.421329,-118.417555,-118.413703,-118.409774,-118.40889,-118.407612,-118.410955,-118.413314,-118.420455,-118.430374,-118.432812,-118.433813,-118.433579,-118.432384,-118.433621,-118.435357,-118.43437,-118.436986,-118.440356,-118.447799,-118.452455,-118.456729,-118.457563,-118.458579,-118.461061,-118.46887,-118.469096,-118.467883,-118.47266,-118.474848,-118.478595,-118.478727,-118.48124,-118.481412,-118.482345,-118.484647,-118.486512,-118.488681,-118.490468,-118.49507,-118.496152,-118.497321,-118.498411,-118.500117,-118.49732,-118.497499,-118.447185,-118.354145,-118.354122,-118.23217,-118.232214,-118.233908,-118.228843,-118.228541,-118.227645,-118.347856,-118.347859,-118.466299,-118.467308,-118.587125,-118.587172,-118.799711,-118.81689,-118.816931,-118.857192,-118.867264,-118.932024,-119.614325,-119.657183,-119.656838,-119.654993,-119.655517,-119.655248,-119.655108,-119.653696,-119.653832,-119.653673,-119.653885,-119.653538,-119.653476,-119.653347,-119.653184,-119.652431,-119.671532,-119.672228],"lat":[44.995117,44.994664,44.994539,44.99531,44.995311,44.995689,44.995993,44.995696,44.996241,44.996558,44.997439,44.997662,44.995877,44.995176,44.992707,44.991737,44.989822,44.990257,44.989514,44.989289,44.990623,44.990024,44.988471,44.986767,44.986752,44.985326,44.984781,44.98298,44.980277,44.978587,44.977115,44.975192,44.971665,44.968054,44.96625,44.96242,44.96256,44.963891,44.963809,44.965656,44.967006,44.968752,44.971192,44.973309,44.975031,44.976476,44.975912,44.97436,44.973976,44.972544,44.972402,44.974115,44.97756,44.979407,44.980483,44.983786,44.983712,44.98129,44.979488,44.980115,44.981894,44.981597,44.982434,44.984037,44.985957,44.986714,44.990763,44.992301,44.992174,44.990605,44.988214,44.987824,44.987332,44.986988,44.983748,44.979593,44.978879,44.976675,44.975827,44.973393,44.972329,44.971889,44.972832,44.973044,44.975415,44.975929,44.974252,44.972586,44.971568,44.972016,44.970771,44.969659,44.969209,44.968488,44.968559,44.963839,44.963426,44.96063,44.960768,44.962913,44.962755,44.964509,44.965046,44.964459,44.964726,44.963114,44.962104,44.961771,44.96023,44.957896,44.957348,44.957659,44.957313,44.958731,44.95929,44.958896,44.956655,44.956934,44.956457,44.956351,44.958396,44.956525,44.951086,44.950096,44.945198,44.94431,44.943198,44.942695,44.941213,44.940104,44.941695,44.939778,44.939575,44.93691,44.933778,44.931409,44.930012,44.926032,44.924687,44.923482,44.921531,44.918361,44.913854,44.911514,44.91053,44.908385,44.906927,44.904173,44.902902,44.901367,44.898643,44.897046,44.894063,44.891028,44.887149,44.882349,44.878634,44.875568,44.872332,44.870332,44.867783,44.865544,44.862587,44.86166,44.862344,44.863165,44.864071,44.864851,44.863351,44.866013,44.866412,44.869386,44.866573,44.866271,44.865007,44.865367,44.866421,44.863043,44.862086,44.859376,44.856606,44.853018,44.850451,44.848153,44.846614,44.843855,44.841107,44.840039,44.838066,44.836274,44.834937,44.832422,44.830613,44.828794,44.824802,44.823236,44.821229,44.821148,44.819407,44.818712,44.81733,44.816426,44.816164,44.813191,44.809344,44.807807,44.802979,44.800259,44.799211,44.798705,44.796442,44.790167,44.787936,44.787259,44.784664,44.780412,44.77925,44.773003,44.772211,44.77072,44.767331,44.767165,44.765439,44.763371,44.762708,44.759278,44.757123,44.754323,44.750975,44.749868,44.747389,44.746564,44.74698,44.746248,44.746025,44.747643,44.746949,44.74528,44.744241,44.743986,44.742082,44.74151,44.74162,44.74358,44.742467,44.742609,44.743944,44.744444,44.743912,44.743996,44.744738,44.745573,44.745474,44.747126,44.747213,44.745628,44.745249,44.744357,44.742041,44.740717,44.738868,44.739093,44.737389,44.735949,44.734328,44.731398,44.728998,44.727872,44.726005,44.72647,44.724808,44.727122,44.726986,44.724884,44.722776,44.721846,44.718693,44.719488,44.718554,44.719766,44.721091,44.720729,44.721555,44.721547,44.722886,44.724173,44.723436,44.719166,44.715774,44.712657,44.710861,44.708948,44.707521,44.706374,44.705666,44.704,44.705289,44.709199,44.710035,44.71003,44.710944,44.712393,44.713621,44.712865,44.712425,44.712027,44.711729,44.711606,44.711339,44.711163,44.710958,44.710678,44.710619,44.709055,44.708664,44.709331,44.708903,44.706237,44.7061,44.704765,44.706081,44.705886,44.704031,44.702462,44.695931,44.692755,44.691562,44.690074,44.688532,44.684021,44.681049,44.679134,44.677878,44.675417,44.67433,44.669929,44.665556,44.665925,44.665698,44.663566,44.664484,44.663639,44.661871,44.66142,44.658729,44.656632,44.65559,44.656297,44.655396,44.653084,44.652859,44.650017,44.652451,44.653206,44.654376,44.652691,44.652595,44.653966,44.654828,44.652801,44.648687,44.647164,44.646543,44.644739,44.644169,44.643025,44.641444,44.641388,44.643381,44.643539,44.642871,44.643001,44.641555,44.642928,44.644419,44.64645,44.645905,44.646102,44.645121,44.643484,44.643038,44.639823,44.639769,44.637965,44.639377,44.639263,44.635601,44.631821,44.631204,44.628403,44.626656,44.625024,44.621341,44.618969,44.617901,44.616775,44.61249,44.61098,44.609502,44.610007,44.608374,44.608771,44.605442,44.603863,44.601609,44.597549,44.595679,44.592251,44.591181,44.589939,44.58881,44.587851,44.58605,44.585317,44.582581,44.581034,44.577082,44.575043,44.572539,44.570658,44.569192,44.567896,44.566543,44.564173,44.562368,44.56119,44.562207,44.563778,44.565112,44.564453,44.565182,44.567029,44.562544,44.560056,44.559716,44.556217,44.554977,44.553654,44.551086,44.550466,44.548608,44.548037,44.54759,44.545392,44.542545,44.541274,44.539108,44.536041,44.537216,44.538112,44.53281,44.531191,44.528638,44.526215,44.523791,44.521255,44.519056,44.514035,44.512089,44.509207,44.507891,44.506397,44.50479,44.502494,44.498025,44.496334,44.493629,44.491714,44.488219,44.485906,44.484385,44.480101,44.478912,44.474856,44.474066,44.471699,44.469162,44.466621,44.466172,44.462786,44.459231,44.45958,44.461433,44.462276,44.45974,44.458504,44.458337,44.456869,44.457882,44.457777,44.456458,44.454457,44.452648,44.452872,44.454282,44.455921,44.456766,44.455072,44.453439,44.448984,44.444531,44.443008,44.438442,44.432468,44.428179,44.426207,44.423503,44.421752,44.416737,44.414309,44.411717,44.40997,44.4088,44.407153,44.403825,44.401907,44.399426,44.397508,44.39858,44.398748,44.397454,44.394828,44.394126,44.391195,44.388993,44.385782,44.383807,44.380988,44.378619,44.372909,44.370845,44.373036,44.373543,44.371744,44.369882,44.36914,44.368133,44.364889,44.362848,44.359247,44.356125,44.353977,44.352126,44.350936,44.350716,44.349406,44.346428,44.344848,44.340343,44.336551,44.334584,44.325517,44.322048,44.319045,44.318331,44.315917,44.313051,44.309518,44.306626,44.304536,44.302617,44.297932,44.294188,44.289246,44.288546,44.287046,44.28383,44.278536,44.277057,44.277036,44.255248,44.255211,44.255384,44.256824,44.257343,44.256129,44.212548,44.21255,44.183239,44.039862,44.039075,44.040388,44.040374,44.040375,44.040266,44.046995,44.047775,44.047828,43.960733,43.960227,43.960462,43.960374,43.959593,43.95892,44.220277,44.220276,44.307045,44.34547,44.389206,44.38917,44.454961,44.461288,44.534131,44.621785,44.652251,44.652252,44.762701,44.823299,44.823343,44.995117]}]],[[{"lng":[-123.816709,-123.734996,-123.735153,-123.715538,-123.715675,-123.715866,-123.72014,-123.720065,-123.720071,-123.699976,-123.68952,-123.679097,-123.66875,-123.648669,-123.608115,-123.597677,-123.59763,-123.597233,-123.596134,-123.596674,-123.596919,-123.596929,-123.602817,-123.602794,-123.603143,-123.602609,-123.580966,-123.54132,-123.47056,-123.438419,-123.414116,-123.409764,-123.339138,-123.316612,-123.301882,-123.240276,-123.23521,-123.221593,-123.201917,-123.182025,-123.149025,-123.147507,-123.147489,-123.145982,-123.143316,-123.1366,-123.133244,-123.126206,-123.12453,-123.121299,-123.119339,-123.119212,-123.117517,-123.116892,-123.114522,-123.111736,-123.105532,-123.100643,-123.092509,-123.089254,-123.087313,-123.086173,-123.084184,-123.07836,-123.074838,-123.073643,-123.073132,-123.074291,-123.078206,-123.088313,-123.095339,-123.09675,-123.101193,-123.105311,-123.105836,-123.108685,-123.110063,-123.112528,-123.119519,-123.121978,-123.126206,-123.133623,-123.136988,-123.14252,-123.150434,-123.15707,-123.16132,-123.164428,-123.17088,-123.171739,-123.172124,-123.171855,-123.169674,-123.17011,-123.171626,-123.174226,-123.179922,-123.181816,-123.183175,-123.183449,-123.182812,-123.18291,-123.18392,-123.187849,-123.19519,-123.198028,-123.198645,-123.198355,-123.19701,-123.191431,-123.18719,-123.184161,-123.183202,-123.183011,-123.185375,-123.18564,-123.19195,-123.195441,-123.203044,-123.206301,-123.214573,-123.221793,-123.227875,-123.232606,-123.251209,-123.251831,-123.25212,-123.253373,-123.254317,-123.256178,-123.260251,-123.260791,-123.260739,-123.260151,-123.250991,-123.247404,-123.24292,-123.242113,-123.241754,-123.24579,-123.248391,-123.250254,-123.253376,-123.251728,-123.250029,-123.245055,-123.240081,-123.238067,-123.233093,-123.231079,-123.228001,-123.22581,-123.222672,-123.218023,-123.214683,-123.212619,-123.211967,-123.214343,-123.215082,-123.214409,-123.214778,-123.219354,-123.221019,-123.220156,-123.219144,-123.214276,-123.213426,-123.213992,-123.216169,-123.216462,-123.213822,-123.211785,-123.211866,-123.211306,-123.209831,-123.208492,-123.206317,-123.205287,-123.207587,-123.209194,-123.212903,-123.215459,-123.21886,-123.224857,-123.227466,-123.228054,-123.227685,-123.225841,-123.222195,-123.21938,-123.219345,-123.220377,-123.222904,-123.226797,-123.229311,-123.229331,-123.229324,-123.229146,-123.22896,-123.227668,-123.225099,-123.22345,-123.223614,-123.229297,-123.233258,-123.235868,-123.238668,-123.242821,-123.244952,-123.245157,-123.244701,-123.242288,-123.239283,-123.23416,-123.230813,-123.22595,-123.223754,-123.221167,-123.219011,-123.219661,-123.222699,-123.226797,-123.229529,-123.23319,-123.235048,-123.235102,-123.233245,-123.230581,-123.229399,-123.228599,-123.228518,-123.229898,-123.232316,-123.237425,-123.240744,-123.245334,-123.245678,-123.244844,-123.239365,-123.236564,-123.229862,-123.224557,-123.220295,-123.21691,-123.217585,-123.216802,-123.217302,-123.216178,-123.214125,-123.211304,-123.204394,-123.200105,-123.197359,-123.193766,-123.193097,-123.193752,-123.190897,-123.18975,-123.190365,-123.193657,-123.193575,-123.191102,-123.187851,-123.183671,-123.180388,-123.200385,-123.224885,-123.230044,-123.248679,-123.288655,-123.328667,-123.367696,-123.371408,-123.371411,-123.451272,-123.455686,-123.471685,-123.472186,-123.532858,-123.556039,-123.573614,-123.59329,-123.593513,-123.715377,-123.715386,-123.723588,-123.767931,-123.775598,-123.775789,-123.816525,-123.816709],"lat":[44.344622,44.345778,44.36035,44.360458,44.379969,44.389495,44.389506,44.432329,44.433374,44.433788,44.433582,44.433928,44.432935,44.43342,44.433671,44.433109,44.46932,44.477454,44.477454,44.541804,44.545624,44.651139,44.651159,44.702125,44.709242,44.721154,44.719415,44.72127,44.720722,44.720622,44.720552,44.720531,44.720059,44.719994,44.719835,44.719914,44.720146,44.720125,44.720099,44.720085,44.720225,44.717047,44.714848,44.711407,44.70831,44.702178,44.700002,44.696014,44.693903,44.691353,44.684493,44.682083,44.678592,44.676966,44.675549,44.674826,44.674763,44.675959,44.675887,44.674727,44.672546,44.66814,44.665294,44.662326,44.659373,44.657331,44.652359,44.649613,44.646585,44.643195,44.641107,44.640814,44.639818,44.639202,44.63915,44.639262,44.639801,44.640594,44.640896,44.640363,44.639291,44.638056,44.637775,44.63787,44.637507,44.637269,44.637619,44.637507,44.634245,44.632428,44.628866,44.62779,44.624542,44.622674,44.621011,44.620036,44.619901,44.619,44.61745,44.616087,44.613029,44.611036,44.609246,44.60723,44.604953,44.602857,44.60042,44.599046,44.59756,44.595896,44.595583,44.594289,44.593077,44.590002,44.587298,44.587179,44.585814,44.585615,44.586063,44.586028,44.585376,44.584597,44.583056,44.581496,44.574626,44.574095,44.573848,44.572781,44.571477,44.566167,44.559351,44.557491,44.556365,44.555148,44.551983,44.550583,44.548154,44.547324,44.544575,44.539654,44.536969,44.532434,44.52887,44.526486,44.525947,44.526172,44.528059,44.527969,44.524644,44.522623,44.516608,44.513286,44.510982,44.51022,44.507681,44.504978,44.501218,44.495079,44.494188,44.491014,44.488627,44.486962,44.484751,44.482585,44.481805,44.479649,44.476371,44.473803,44.471695,44.468473,44.460622,44.457143,44.452756,44.450269,44.448576,44.447397,44.445745,44.443038,44.437074,44.435239,44.434572,44.434638,44.434205,44.434126,44.433293,44.431889,44.42996,44.426664,44.422371,44.419436,44.416461,44.415712,44.416941,44.417256,44.415073,44.414213,44.414127,44.41312,44.41221,44.406912,44.39935,44.395505,44.393452,44.388135,44.386089,44.385229,44.384887,44.385352,44.384143,44.382254,44.380821,44.377715,44.374888,44.37205,44.371131,44.370322,44.36901,44.366149,44.362497,44.35993,44.359588,44.360124,44.359847,44.358396,44.356979,44.354622,44.352618,44.348468,44.345995,44.344606,44.342591,44.340852,44.339869,44.338879,44.337789,44.33363,44.332099,44.330984,44.329186,44.328999,44.330779,44.331266,44.32943,44.324952,44.32066,44.317272,44.313726,44.310808,44.309747,44.309222,44.308716,44.308829,44.308573,44.306974,44.305646,44.303354,44.29984,44.295892,44.294963,44.292272,44.290742,44.287587,44.285562,44.28493,44.283725,44.283725,44.283725,44.283725,44.283726,44.283724,44.283725,44.283719,44.283725,44.281021,44.280496,44.280647,44.281185,44.281471,44.281523,44.281402,44.282597,44.281915,44.276699,44.280267,44.283946,44.283944,44.283606,44.283547,44.316167,44.315303,44.344622]}]],[[{"lng":[-121.031202,-121.026348,-121.024374,-121.022556,-121.019811,-121.018483,-121.018588,-121.017429,-121.01569,-121.01079,-121.007455,-121.005447,-121.000973,-120.997673,-120.992973,-120.990473,-120.988673,-120.986474,-120.985498,-120.982776,-120.979647,-120.973089,-120.972589,-120.97387,-120.974381,-120.973344,-120.97218,-120.969577,-120.966974,-120.963672,-120.959771,-120.956471,-120.955773,-120.954171,-120.947171,-120.946071,-120.945771,-120.946472,-120.953872,-120.955372,-120.955072,-120.953672,-120.949472,-120.946372,-120.940771,-120.938471,-120.935871,-120.93377,-120.93237,-120.932169,-120.933068,-120.935868,-120.939568,-120.939628,-120.938472,-120.934171,-120.930471,-120.923671,-120.921771,-120.920471,-120.919771,-120.920475,-120.920371,-120.918671,-120.914371,-120.909271,-120.904671,-120.901065,-120.899371,-120.899771,-120.898171,-120.89428,-120.889071,-120.883445,-120.883039,-120.881064,-120.879164,-120.877522,-120.872479,-120.868265,-120.866962,-120.865759,-120.866075,-120.868235,-120.868569,-120.86607,-120.86657,-120.86157,-120.86267,-120.86287,-120.86209,-120.85917,-120.854872,-120.852271,-120.84987,-120.84947,-120.851771,-120.856371,-120.859571,-120.863971,-120.865071,-120.865771,-120.865371,-120.862871,-120.861871,-120.861471,-120.860972,-120.859072,-120.856571,-120.847671,-120.845671,-120.837971,-120.836073,-120.835571,-120.837371,-120.837471,-120.839171,-120.839071,-120.838172,-120.833377,-120.833178,-120.83458,-120.838981,-120.838881,-120.837783,-120.836184,-120.834585,-120.828587,-120.82629,-120.825731,-120.827084,-120.833877,-120.838772,-120.841972,-120.853673,-120.854473,-120.864073,-120.865268,-120.869928,-120.874893,-120.877966,-120.882656,-120.884318,-120.884777,-120.884644,-120.884983,-120.890264,-120.896833,-120.898438,-120.899356,-120.903006,-120.908459,-120.909382,-120.908205,-120.906528,-120.905657,-120.905899,-120.904815,-120.903013,-120.896872,-120.895674,-120.895397,-120.896478,-120.898788,-120.901176,-120.906075,-120.909275,-120.911675,-120.911282,-120.906375,-120.904375,-120.903975,-120.904775,-120.907361,-120.909223,-120.912191,-120.914281,-120.914976,-120.915795173154,-120.913476,-120.895575,-120.885616086084,-120.870042,-120.855674,-120.836141479114,-120.788872,-120.724171,-120.68937,-120.668869,-120.6535343441,-120.649368,-120.649368,-120.646168,-120.646068,-120.643668,-120.640368,-120.638568,-120.635868,-120.631668,-120.629067,-120.624467,-120.618567,-120.612267,-120.609967,-120.606167,-120.604867,-120.603466,-120.603766,-120.602466,-120.600466,-120.593766,-120.587066,-120.583366,-120.577565,-120.574265,-120.572265,-120.569465,-120.567465,-120.566965,-120.560065,-120.558264,-120.556464,-120.553064,-120.552064,-120.551164,-120.549064,-120.547364,-120.544783,-120.539245,-120.535308,-120.531013,-120.528516,-120.524742,-120.520924,-120.517573,-120.515688,-120.513313,-120.510188,-120.508107,-120.506384,-120.499805,-120.498461,-120.496624,-120.493853,-120.490833,-120.488779,-120.488689,-120.489739,-120.492223,-120.492223,-120.491732,-120.489585,-120.485156,-120.48244,-120.48231,-120.479903,-120.479474,-120.478341,-120.47836,-120.479181,-120.480276,-120.482367,-120.485326,-120.486421,-120.484741,-120.481042,-120.479303,-120.477833,-120.478087,-120.477475,-120.472696,-120.469915,-120.47018,-120.46897,-120.46795,-120.464725,-120.459735,-120.45746,-120.453915,-120.452159,-120.449588,-120.44422,-120.440538,-120.438299,-120.439925,-120.444612,-120.446258,-120.446592,-120.444248,-120.438889,-120.432693,-120.428135,-120.426305,-120.421999,-120.416052,-120.411699,-120.410742,-120.409413,-120.408982,-120.409128,-120.408536,-120.40536,-120.404938,-120.402654,-120.402578,-120.404832,-120.407117,-120.407663,-120.407038,-120.405673,-120.402107,-120.401323,-120.392574,-120.390763,-120.388305,-120.386122,-120.385845,-120.384579,-120.381856,-120.377466,-120.372265,-120.365267,-120.359875,-120.35798,-120.357804,-120.359512,-120.365401,-120.369313,-120.372139,-120.375793,-120.376156,-120.380486,-120.380493,-120.379469,-120.377837,-120.376304,-120.370994,-120.367013,-120.365217,-120.364122,-120.360771,-120.359976,-120.360827,-120.363246,-120.364955,-120.365655,-120.367855,-120.373427,-120.377756,-120.382056,-120.386686,-120.394456,-120.399056,-120.405557,-120.409557,-120.414957,-120.422581,-120.426856,-120.426057,-120.423357,-120.424257,-120.423257,-120.420557,-120.417857,-120.412857,-120.411057,-120.407256,-120.407022,-120.409948,-120.416409,-120.421449,-120.422903,-120.429082,-120.43323,-120.438779,-120.441284,-120.446592,-120.449907,-120.45441,-120.459937,-120.462291,-120.46966,-120.472759,-120.477559,-120.481228,-120.483859,-120.490359,-120.495859,-120.493459,-120.491759,-120.489859,-120.486359,-120.482359,-120.481559,-120.483459,-120.489859,-120.493659,-120.495159,-120.496859,-120.496059,-120.492159,-120.487859,-120.484435,-120.482941,-120.483658,-120.486758,-120.492259,-120.493959,-120.501159,-120.501859,-120.505859,-120.506459,-120.506059,-120.502959,-120.494059,-120.489058,-120.484158,-120.482958,-120.484258,-120.489258,-120.492258,-120.495759,-120.498759,-120.501159,-120.502659,-120.506259,-120.507959,-120.509659,-120.514759,-120.519859,-120.525059,-120.527559,-120.528659,-120.519359,-120.518459,-120.523059,-120.525259,-120.528159,-120.530159,-120.532059,-120.532559,-120.529759,-120.522659,-120.515159,-120.513358,-120.512558,-120.513158,-120.514958,-120.516659,-120.521859,-120.524059,-120.523459,-120.524459,-120.527059,-120.532059,-120.534459,-120.534659,-120.531859,-120.530659,-120.533659,-120.533659,-120.535559,-120.540159,-120.543059,-120.543359,-120.541459,-120.533958,-120.532458,-120.531258,-120.530458,-120.531258,-120.530758,-120.530958,-120.531958,-120.534358,-120.539658,-120.541258,-120.539358,-120.535158,-120.529458,-120.527358,-120.528058,-120.527458,-120.530358,-120.538758,-120.540458,-120.540758,-120.538858,-120.531858,-120.525558,-120.524658,-120.524057,-120.524457,-120.527757,-120.531558,-120.534658,-120.536858,-120.537758,-120.538558,-120.540358,-120.542258,-120.545458,-120.548158,-120.547758,-120.546658,-120.544258,-120.542758,-120.543158,-120.544858,-120.547358,-120.553358,-120.555558,-120.553158,-120.549158,-120.547858,-120.542858,-120.541758,-120.540257,-120.540289,-120.541857,-120.545158,-120.546358,-120.547057,-120.544657,-120.541657,-120.538157,-120.535957,-120.533657,-120.534457,-120.535757,-120.540657,-120.542857,-120.550957,-120.554457,-120.556057,-120.552057,-120.550663,-120.551139,-120.550357,-120.546457,-120.544157,-120.542956,-120.541656,-120.543656,-120.545356,-120.544856,-120.541956,-120.540056,-120.534156,-120.530056,-120.528456,-120.525956,-120.524455,-120.523855,-120.524455,-120.527555,-120.529355,-120.533055,-120.537556,-120.540256,-120.542856,-120.543008,-120.541755,-120.540955,-120.536755,-120.534055,-120.532555,-120.531655,-120.529055,-120.524155,-120.521555,-120.520455,-120.521254,-120.519354,-120.516054,-120.509454,-120.506254,-120.502854,-120.497954,-120.493553,-120.48849,-120.484853,-120.481653,-120.480953,-120.481153,-120.482353,-120.487153,-120.487653,-120.485552,-120.483352,-120.480152,-120.474752,-120.472652,-120.473652,-120.476752,-120.480152,-120.482552,-120.484052,-120.483552,-120.480252,-120.476852,-120.472951,-120.469549,-120.468551,-120.468951,-120.471551,-120.474951,-120.476251,-120.476751,-120.476251,-120.475351,-120.466995,-120.464991,-120.46295,-120.457069,-120.45225,-120.44886,-120.450097,-120.453041,-120.45505,-120.45865,-120.46045,-120.46215,-120.465706,-120.463787,-120.460249,-120.458449,-120.458449,-120.461049,-120.460549,-120.461249,-120.463448,-120.463648,-120.462548,-120.464548,-120.467448,-120.468449,-120.468849,-120.470649,-120.476849,-120.479249,-120.482849,-120.486949,-120.491949,-120.494749,-120.498149,-120.50115,-120.50345,-120.506864,-120.51005,-120.51485,-120.512249,-120.508549,-120.504449,-120.503733,-120.504419,-120.626232,-120.688617,-120.729792,-120.730182,-120.729292,-120.729487,-120.728574,-120.726329,-120.727391,-120.727052,-120.728455,-120.727736,-120.726605,-120.725299,-120.722581,-120.721768,-120.720072,-120.718099,-120.719022,-120.718381,-120.718645,-120.722032,-120.722779,-120.72414,-120.72332,-120.724375,-120.723166,-120.726786,-120.727515,-120.731003,-120.733197,-120.734189,-120.737715,-120.739885,-120.742358,-120.744025,-120.745747,-120.74657,-120.747881,-120.74927,-120.75116,-120.753057,-120.75508,-120.757615,-120.761281,-120.761838,-120.76099,-120.764167,-120.765987,-120.76907,-120.769379,-120.767914,-120.767269,-120.769803,-120.770957,-120.771887,-120.776469,-120.779175,-120.781447,-120.785207,-120.789015,-120.790705,-120.791689,-120.793721,-120.79614,-120.797512,-120.799513,-120.801544,-120.802598,-120.804459,-120.807057,-120.810019,-120.810337,-120.814098,-120.816572,-120.818038,-120.82114,-120.824421,-120.826779,-120.828702,-120.830944,-120.8339,-120.83473,-120.837282,-120.838408,-120.841194,-120.846485,-120.848278,-120.850241,-120.852133,-120.855029,-120.857412,-120.858274,-120.862649,-120.866917,-120.869892,-120.874104,-120.880732,-120.883252,-120.885464,-120.889357,-120.890777,-120.891826,-120.893665,-120.89586,-120.896262,-120.900336,-120.903867,-120.906598,-120.907903,-120.91103,-120.913498,-120.915516,-120.920404,-120.921218,-120.918168,-120.919952,-120.92356,-120.925671,-120.928255,-120.929924,-120.930986,-120.932135,-120.933105,-120.934796,-120.937582,-120.939568,-120.940399,-120.941741,-120.943269,-120.944643,-120.945892,-120.948817,-120.949477,-120.95345,-120.955009,-120.952541,-120.952936,-120.95377,-120.960641,-120.96269,-120.965499,-120.969286,-120.971202,-120.976906,-120.978751,-120.979915,-120.981623,-120.982904,-120.984454,-120.987364,-120.987691,-120.990604,-120.992661,-120.994305,-120.996115,-120.996341,-120.998011,-121.002122,-121.004846,-121.005607,-121.00779,-121.009205,-121.012104,-121.013426,-121.012758,-121.01339,-121.015251,-121.017818,-121.018916,-121.019213,-121.017603,-121.017866,-121.022616,-121.024,-121.024294,-121.023358,-121.021783,-121.020802,-121.023205,-121.02369,-121.019103,-121.020535,-121.022339,-121.024289,-121.020562,-121.022387,-121.022886,-121.025146,-121.025194,-121.023648,-121.023799,-121.0217,-121.022667,-121.022588,-121.023321,-121.022639,-121.024033,-121.022217,-121.020367,-121.018924,-121.019468,-121.023617,-121.024876,-121.024135,-121.021053,-121.017426,-121.017771,-121.020739,-121.028421,-121.03044,-121.031202],"lat":[45.285857,45.288917,45.289725,45.291386,45.294684,45.297022,45.301504,45.30514,45.307148,45.309269,45.31006,45.309698,45.307644,45.306544,45.307444,45.309344,45.312644,45.318543,45.320256,45.321963,45.322652,45.320315,45.319027,45.316643,45.312945,45.309899,45.308635,45.307437,45.30694,45.306845,45.307945,45.310345,45.313445,45.316745,45.323445,45.325045,45.327145,45.331345,45.333445,45.334445,45.335645,45.337245,45.337645,45.336745,45.332645,45.331345,45.330844,45.331343,45.332443,45.336443,45.337843,45.340244,45.342046,45.345588,45.346845,45.347745,45.347745,45.347345,45.348045,45.349245,45.351645,45.356144,45.359344,45.361345,45.362645,45.362145,45.360745,45.361596,45.364245,45.370245,45.374445,45.378322,45.383145,45.387278,45.390457,45.392552,45.392414,45.391687,45.388216,45.38852,45.389224,45.391231,45.393451,45.397879,45.401146,45.409346,45.412746,45.422746,45.425346,45.427346,45.428414,45.428645,45.426945,45.427145,45.428545,45.431445,45.433645,45.434645,45.435846,45.439046,45.440546,45.445046,45.446046,45.448446,45.450346,45.454546,45.456246,45.459946,45.461546,45.461946,45.462746,45.467346,45.469146,45.471246,45.474546,45.475646,45.479546,45.483245,45.485645,45.493046,45.494646,45.497345,45.501841,45.502441,45.504841,45.506742,45.507742,45.509945,45.511466,45.514077,45.515307,45.515968,45.515946,45.517546,45.521846,45.523446,45.528746,45.528848,45.528391,45.526944,45.526771,45.527564,45.529435,45.531695,45.538782,45.539326,45.541614,45.54268,45.543979,45.549261,45.553406,45.558241,45.561148,45.564497,45.565662,45.568928,45.571842,45.576068,45.579033,45.585914,45.586685,45.589342,45.592333,45.596399,45.598387,45.600345,45.602445,45.605245,45.608839,45.613245,45.615745,45.617145,45.621645,45.626731,45.627939,45.632496,45.634693,45.636345,45.641301218792,45.640045,45.642945,45.6500815780723,45.661242,45.671545,45.6758434879127,45.686246,45.706446,45.715847,45.730147,45.7372486812962,45.732947,45.730246,45.726146,45.723946,45.722346,45.721046,45.720846,45.721546,45.720646,45.721346,45.722047,45.721447,45.717847,45.715847,45.714547,45.713047,45.706647,45.704747,45.702847,45.702247,45.701548,45.701648,45.700048,45.698648,45.696048,45.695448,45.693748,45.690648,45.686048,45.682348,45.681648,45.679448,45.678348,45.677548,45.672548,45.670148,45.669048,45.669195,45.671165,45.671852,45.671899,45.671177,45.668983,45.667379,45.666867,45.66608,45.66596,45.665119,45.663944,45.661515,45.656275,45.655788,45.655522,45.656147,45.655946,45.654991,45.654794,45.651677,45.648977,45.648871,45.643504,45.643312,45.645171,45.645177,45.645166,45.645151,45.644858,45.642019,45.640653,45.639518,45.639181,45.639391,45.638269,45.637158,45.635036,45.634178,45.633047,45.630668,45.628747,45.627752,45.626368,45.624827,45.622829,45.620066,45.619321,45.619673,45.621577,45.622016,45.624286,45.62586,45.626584,45.627031,45.626112,45.622848,45.621291,45.618006,45.615692,45.613944,45.607454,45.602365,45.598438,45.597302,45.597164,45.597602,45.597026,45.596067,45.595318,45.592508,45.589052,45.583655,45.581893,45.576728,45.574605,45.569936,45.567051,45.565666,45.563101,45.559754,45.557779,45.556725,45.555641,45.554154,45.551701,45.549859,45.548723,45.546732,45.54431,45.541528,45.538808,45.537535,45.537733,45.537249,45.535359,45.533713,45.531459,45.530316,45.53113,45.531392,45.530644,45.528385,45.527588,45.523731,45.521584,45.519428,45.518166,45.518095,45.516641,45.515253,45.51424,45.51263,45.509832,45.508034,45.505691,45.501064,45.49725,45.49655,45.49525,45.493714,45.49295,45.49445,45.496787,45.49705,45.49695,45.49745,45.49825,45.49875,45.50051,45.49795,45.49395,45.49195,45.48605,45.48365,45.48285,45.48305,45.48255,45.48185,45.47445,45.473147,45.470332,45.468636,45.468017,45.469243,45.471716,45.472994,45.475768,45.478877,45.48369,45.485275,45.485194,45.480212,45.478808,45.476929,45.476149,45.472649,45.471983,45.470249,45.468949,45.465349,45.462649,45.462049,45.462449,45.461749,45.459549,45.456549,45.455349,45.453649,45.451849,45.450549,45.446949,45.444049,45.443649,45.442549,45.440716,45.438548,45.435549,45.434349,45.434249,45.434549,45.433999,45.433249,45.431749,45.430649,45.428249,45.427949,45.428249,45.426949,45.422849,45.420549,45.419249,45.416849,45.417349,45.418649,45.419049,45.418749,45.417249,45.407749,45.405749,45.405049,45.404349,45.405449,45.405249,45.403449,45.400349,45.396349,45.394649,45.388849,45.387249,45.386549,45.385449,45.383249,45.381549,45.380449,45.381849,45.381149,45.380649,45.378649,45.376849,45.375649,45.375749,45.377849,45.376849,45.373549,45.372549,45.371849,45.371249,45.370249,45.368449,45.366149,45.363849,45.358149,45.352949,45.351749,45.349949,45.347649,45.346049,45.345249,45.344149,45.343649,45.342049,45.339249,45.336549,45.335149,45.332249,45.331449,45.331449,45.330649,45.329349,45.327749,45.328449,45.328149,45.324249,45.320949,45.319149,45.317549,45.315849,45.314749,45.311549,45.309749,45.309049,45.305749,45.304049,45.30015,45.29915,45.295949,45.294749,45.295049,45.296349,45.297849,45.302749,45.304349,45.304549,45.302549,45.298349,45.296449,45.295549,45.291449,45.288049,45.285649,45.284449,45.284449,45.283249,45.281249,45.279649,45.281049,45.281049,45.279649,45.279049,45.276049,45.274864,45.271849,45.269049,45.267249,45.262949,45.261649,45.261649,45.262449,45.26185,45.25905,45.25585,45.25495,45.253255,45.253849,45.253349,45.252749,45.250449,45.246649,45.244146,45.242426,45.240849,45.237249,45.236649,45.235149,45.231949,45.228449,45.223949,45.222449,45.220249,45.219849,45.22325,45.22465,45.22465,45.22385,45.22255,45.22035,45.21885,45.21675,45.21635,45.21665,45.21785,45.217049,45.213649,45.212507,45.210349,45.209949,45.21115,45.21125,45.21065,45.20605,45.20475,45.20445,45.20535,45.20445,45.20265,45.20105,45.19925,45.19785,45.19615,45.19555,45.19575,45.19765,45.197233,45.19485,45.19335,45.19125,45.18895,45.18665,45.18365,45.18075,45.17955,45.17945,45.18015,45.17975,45.17765,45.17565,45.17325,45.17235,45.17235,45.17155,45.17025,45.16895,45.16835,45.16595,45.16494,45.16355,45.16215,45.15955,45.15775,45.15645,45.15415,45.15185,45.15105,45.146686,45.144196,45.14405,45.145483,45.14545,45.143185,45.140883,45.139253,45.13945,45.13885,45.13795,45.13505,45.130127,45.125985,45.12315,45.12065,45.11945,45.11625,45.11165,45.10865,45.10515,45.10375,45.10115,45.10015,45.10155,45.10285,45.10695,45.10855,45.11165,45.11015,45.10505,45.10435,45.10585,45.10575,45.10455,45.1041,45.10265,45.102778,45.10135,45.09465,45.09095,45.08725,45.08565,45.083477,45.083477,45.083589,45.083695,45.083731,45.085907,45.086873,45.088765,45.089885,45.091092,45.093143,45.095639,45.097334,45.099715,45.100225,45.103616,45.105245,45.106348,45.106596,45.111056,45.114616,45.117583,45.119629,45.121757,45.124848,45.126089,45.127872,45.129578,45.130522,45.131673,45.132358,45.133054,45.135077,45.134533,45.1344,45.134805,45.136159,45.136322,45.137567,45.139557,45.140314,45.142267,45.142428,45.144024,45.144321,45.143845,45.144461,45.145745,45.149272,45.150189,45.153147,45.155435,45.156511,45.157141,45.158737,45.160367,45.162337,45.162694,45.162405,45.163256,45.162708,45.164184,45.163077,45.163302,45.164828,45.165086,45.164483,45.165388,45.165421,45.166442,45.167929,45.168318,45.167194,45.170074,45.170973,45.172641,45.172219,45.172811,45.175916,45.17698,45.175965,45.176743,45.178981,45.179206,45.180176,45.181246,45.184218,45.185869,45.1877,45.189509,45.190206,45.189711,45.193073,45.193862,45.195112,45.19465,45.196764,45.198991,45.198138,45.199481,45.200624,45.199802,45.202305,45.202158,45.201016,45.200704,45.202121,45.203031,45.203406,45.202794,45.203096,45.200337,45.199614,45.199505,45.198189,45.197811,45.198744,45.201804,45.20288,45.201783,45.20033,45.199781,45.200555,45.203523,45.203315,45.201543,45.200106,45.2006,45.199612,45.198147,45.198131,45.200084,45.200797,45.200171,45.200435,45.201916,45.201454,45.200533,45.199129,45.196589,45.196232,45.197026,45.198343,45.198167,45.200064,45.199855,45.200423,45.19887,45.198832,45.200164,45.20007,45.197788,45.198917,45.200376,45.204264,45.204362,45.203313,45.204881,45.206422,45.208369,45.20892,45.20822,45.209422,45.211071,45.211051,45.208977,45.210143,45.21213,45.212996,45.213307,45.212389,45.212678,45.215473,45.216733,45.217611,45.217972,45.218455,45.219531,45.220811,45.22145,45.222909,45.22377,45.225219,45.227813,45.229872,45.23038,45.232197,45.235346,45.236331,45.237762,45.23835,45.239548,45.241133,45.241928,45.245501,45.246643,45.249845,45.251226,45.261002,45.264107,45.264793,45.266282,45.268668,45.270476,45.271766,45.275176,45.27644,45.278573,45.281969,45.284738,45.28618,45.284328,45.28481,45.285857]}]],[[{"lng":[-123.260791,-123.260251,-123.256178,-123.254317,-123.253373,-123.25212,-123.251831,-123.251209,-123.232606,-123.227875,-123.221793,-123.214573,-123.206301,-123.203044,-123.195441,-123.19195,-123.18564,-123.185375,-123.183011,-123.183202,-123.184161,-123.18719,-123.191431,-123.19701,-123.198355,-123.198645,-123.198028,-123.19519,-123.187849,-123.18392,-123.18291,-123.182812,-123.183449,-123.183175,-123.181816,-123.179922,-123.174226,-123.171626,-123.17011,-123.169674,-123.171855,-123.172124,-123.171739,-123.17088,-123.164428,-123.16132,-123.15707,-123.150434,-123.14252,-123.136988,-123.133623,-123.126206,-123.121978,-123.119519,-123.112528,-123.110063,-123.108685,-123.105836,-123.105311,-123.101193,-123.09675,-123.095339,-123.088313,-123.078206,-123.074291,-123.073132,-123.073643,-123.074838,-123.07836,-123.084184,-123.086173,-123.087313,-123.089254,-123.092509,-123.100643,-123.105532,-123.111736,-123.114522,-123.116892,-123.117517,-123.119212,-123.119339,-123.121299,-123.12453,-123.126206,-123.133244,-123.1366,-123.143316,-123.145982,-123.147489,-123.147507,-123.149025,-123.150297,-123.150763,-123.150429,-123.146582,-123.137819,-123.133529,-123.132445,-123.1327,-123.135106,-123.137757,-123.140884,-123.143843,-123.142191,-123.139759,-123.13696,-123.133831,-123.12769,-123.123007,-123.120155,-123.119733,-123.120253,-123.118721,-123.113025,-123.111578,-123.107712,-123.106032,-123.105377,-123.100881,-123.099242,-123.095772,-123.092658,-123.089503,-123.086457,-123.081389,-123.078903,-123.076375,-123.07173,-123.066818,-123.062154,-123.061117,-123.060721,-123.061431,-123.061853,-123.060106,-123.055342,-123.053026,-123.050025,-123.044987,-123.043527,-123.042037,-123.041354,-123.040809,-123.039988,-123.039828,-123.039451,-123.041897,-123.042756,-123.041567,-123.03941,-123.035804,-123.034095,-123.031884,-123.027127,-123.024002,-123.019999,-123.018153,-123.016667,-123.015825,-123.015148,-123.01509,-123.01474,-123.013866,-123.013824,-123.014433,-123.015049,-123.015765,-123.016551,-123.017345,-123.018679,-123.018747,-123.018734,-123.018598,-123.018367,-123.018107,-123.015982,-123.014599,-123.01383,-123.013065,-123.012491,-123.01133,-123.010604,-123.007595,-123.006847,-123.005477,-123.004903,-123.001831,-123.000013,-122.998717,-122.996297,-122.996025,-122.997623,-122.998293,-122.996175,-122.993648,-122.991695,-122.990027,-122.988675,-122.986746,-122.985042,-122.979769,-122.975862,-122.974427,-122.973649,-122.973993,-122.97364,-122.97265,-122.971694,-122.969086,-122.964661,-122.962703,-122.957256,-122.955481,-122.949349,-122.947659,-122.943228,-122.937846,-122.93408,-122.931922,-122.929381,-122.929887,-122.928097,-122.925638,-122.922578,-122.919464,-122.919518,-122.916886,-122.913298,-122.909888,-122.909232,-122.906842,-122.90538,-122.902456,-122.900612,-122.899397,-122.897648,-122.895184,-122.892398,-122.891829,-122.890258,-122.884958,-122.882731,-122.87453,-122.873245,-122.873219,-122.871689,-122.868847,-122.864965,-122.861237,-122.856157,-122.852323,-122.849696,-122.8471,-122.846935,-122.848492,-122.847178,-122.845145,-122.842851,-122.839763,-122.839136,-122.832797,-122.828925,-122.825426,-122.821487,-122.819465,-122.815899,-122.813769,-122.813636,-122.812321,-122.807949,-122.805408,-122.803195,-122.804166,-122.800709,-122.794418,-122.793327,-122.787691,-122.783465,-122.779831,-122.778248,-122.773998,-122.768613,-122.765303,-122.763398,-122.762124,-122.759186,-122.757763,-122.753221,-122.748027,-122.743446,-122.737302,-122.732714,-122.729355,-122.727945,-122.726418,-122.724795,-122.721705,-122.719631,-122.715588,-122.713778,-122.705411,-122.700531,-122.696463,-122.694844,-122.690864,-122.683555,-122.680574,-122.677492,-122.670774,-122.66985,-122.660327,-122.653472,-122.65029,-122.645826,-122.64073,-122.639144,-122.634129,-122.627139,-122.621327,-122.620463,-122.618014,-122.61524,-122.607766,-122.603458,-122.599469,-122.597363,-122.582836,-122.576929,-122.572269,-122.5701,-122.569953,-122.568548,-122.568195,-122.56693,-122.564402,-122.56151,-122.553888,-122.546669,-122.542407,-122.541561,-122.538944,-122.536666,-122.532911,-122.531042,-122.521912,-122.52029,-122.522561,-122.52245,-122.520625,-122.520605,-122.519439,-122.511612,-122.50559,-122.503151,-122.496565,-122.487637,-122.484798,-122.480122,-122.477499,-122.475677,-122.475968,-122.475835,-122.473551,-122.469302,-122.46124,-122.457333,-122.454774,-122.443897,-122.443103,-122.442151,-122.441817,-122.44036,-122.436918,-122.435041,-122.431319,-122.428316,-122.423287,-122.419433,-122.412346,-122.411213,-122.410988,-122.410944,-122.411198,-122.41099,-122.41,-122.408208,-122.406298,-122.4027,-122.400882,-122.397991,-122.394416,-122.39138,-122.38863,-122.382079,-122.378629,-122.372462,-122.370076,-122.362732,-122.35614,-122.354329,-122.34955,-122.343213,-122.340708,-122.334685,-122.333374,-122.328534,-122.325742,-122.32137,-122.318858,-122.317447,-122.311568,-122.308786,-122.306909,-122.302935,-122.300164,-122.292897,-122.288569,-122.282872,-122.278591,-122.276675,-122.27376,-122.274,-122.273067,-122.271886,-122.269612,-122.264381,-122.261423,-122.259394,-122.255448,-122.255066,-122.253592,-122.250044,-122.247582,-122.246528,-122.245971,-122.242203,-122.23706,-122.237408,-122.23292,-122.231438,-122.23037,-122.22769,-122.224659,-122.222145,-122.220719,-122.218413,-122.21445,-122.210663,-122.207421,-122.204021,-122.199334,-122.198685,-122.198046,-122.196732,-122.193924,-122.189405,-122.184557,-122.179739,-122.178684,-122.174251,-122.171843,-122.166572,-122.164191,-122.161118,-122.156292,-122.154325,-122.152774,-122.149224,-122.14237,-122.138702,-122.132685,-122.130972,-122.128698,-122.124247,-122.122466,-122.121442,-122.119821,-122.119828,-122.118702,-122.11344,-122.110688,-122.108719,-122.107563,-122.103815,-122.100326,-122.096559,-122.09404,-122.088617,-122.086244,-122.08412,-122.081091,-122.077104,-122.075401,-122.074393,-122.071823,-122.069796,-122.068144,-122.065765,-122.063939,-122.060621,-122.058813,-122.056484,-122.054415,-122.050762,-122.047028,-122.046094,-122.045304,-122.040875,-122.03598,-122.034171,-122.033006,-122.030498,-122.028916,-122.026339,-122.024106,-122.020851,-122.01847,-122.016709,-122.015715,-122.011684,-122.008804,-122.005291,-122.003216,-122.001009,-121.999761,-121.996208,-121.992926,-121.984527,-121.981681,-121.980176,-121.977179,-121.974303,-121.973503,-121.971604,-121.967345,-121.966375,-121.964997,-121.963805,-121.799562,-121.800402,-121.800929,-121.799675,-121.799241,-121.800345,-121.800936,-121.800563,-121.801611,-121.801092,-121.798296,-121.798435,-121.798805,-121.799036,-121.798969,-121.79865,-121.797993,-121.797622,-121.797991,-121.799566,-121.799432,-121.797945,-121.800054,-121.801352,-121.80273,-121.802244,-121.80419,-121.805488,-121.805763,-121.808206,-121.807491,-121.80941,-121.810189,-121.811566,-121.81069,-121.806559,-121.804756,-121.802325,-121.802162,-121.800331,-121.798646,-121.800926,-121.800216,-121.795192,-121.795273,-121.793895,-121.79518,-121.796859,-121.798363,-121.799965,-121.799081,-121.800051,-121.79921,-121.800617,-121.801265,-121.800708,-121.801798,-121.803133,-121.802093,-121.802801,-121.803286,-121.804825,-121.807092,-121.806817,-121.807657,-121.811331,-121.813604,-121.8138,-121.815832,-121.816317,-121.816073,-121.813482,-121.812509,-121.813074,-121.811212,-121.809419,-121.809382,-121.809865,-121.814698,-121.815638,-121.818283,-121.819453,-121.823104,-121.824155,-121.82561,-121.829007,-121.832405,-121.834668,-121.839796,-121.843914,-121.844861,-121.84688,-121.847359,-121.848875,-121.84938,-121.847034,-121.845971,-121.844366,-121.843049,-121.844256,-121.844453,-121.843955,-121.847093,-121.849512,-121.849462,-121.847634,-121.847291,-121.848791,-121.848139,-121.848677,-121.847502,-121.844408,-121.84291,-121.841128,-121.841535,-121.844711,-121.846615,-121.846191,-121.847578,-121.847561,-121.845745,-121.84552,-121.845334,-121.844403,-121.845531,-121.843146,-121.843244,-121.841332,-121.842528,-121.845745,-121.845128,-121.846519,-121.846756,-121.846123,-121.843218,-121.843138,-121.843906,-121.843159,-121.845488,-121.846471,-121.843678,-121.845412,-121.844616,-121.843342,-121.841952,-121.843679,-121.844914,-121.845989,-121.843458,-121.842406,-121.839822,-121.83738,-121.836875,-121.837076,-121.839415,-121.84041,-121.8439,-121.843443,-121.841828,-121.840536,-121.838253,-121.837607,-121.838718,-121.838718,-121.83956,-121.838263,-121.839298,-121.840783,-121.840443,-121.838989,-121.838745,-121.840333,-121.840437,-121.838501,-121.83719,-121.838672,-121.838296,-121.838676,-121.839829,-121.840178,-121.841105,-121.840588,-121.841346,-121.837029,-121.832349,-121.829123,-121.825631,-121.824693,-121.824493,-121.825031,-121.824508,-121.822017,-121.820794,-121.820058,-121.818602,-121.819172,-121.814002,-121.812668,-121.807791,-121.80525,-121.800871,-121.799426,-121.960126,-121.964517,-122.028016,-122.027996,-122.228368,-122.264527,-122.264527,-122.32715,-122.32949,-122.332446,-122.331478,-122.328531,-122.325744,-122.328729,-122.327313,-122.330673,-122.331857,-122.334249,-122.336791,-122.339923,-122.340612,-122.347714,-122.352623,-122.354488,-122.355447,-122.35689,-122.358069,-122.361244,-122.363745,-122.364257,-122.367197,-122.371128,-122.373799,-122.379589,-122.38457,-122.384561,-122.404781,-122.404748,-122.425089,-122.425081,-122.426446,-122.430218,-122.434885,-122.438796,-122.442879,-122.445272,-122.448436,-122.451074,-122.456337,-122.457892,-122.463518,-122.465628,-122.468798,-122.470829,-122.47368,-122.478045,-122.479635,-122.484305,-122.488381,-122.492272,-122.497,-122.499506,-122.503182,-122.507203,-122.510561,-122.511964,-122.512251,-122.513425,-122.519391,-122.522442,-122.528191,-122.529542,-122.531171,-122.532942,-122.532614,-122.533745,-122.535382,-122.539632,-122.543711,-122.545794,-122.548543,-122.549707,-122.551917,-122.554953,-122.558723,-122.562413,-122.565493,-122.567339,-122.570153,-122.573085,-122.577232,-122.57778,-122.575169,-122.5754,-122.57677,-122.579831,-122.582028,-122.585624,-122.588363,-122.591986,-122.593471,-122.599071,-122.604621,-122.608342,-122.611738,-122.617391,-122.622312,-122.624857,-122.631432,-122.637437,-122.639699,-122.640716,-122.644082,-122.64493,-122.645763,-122.644542,-122.64679,-122.646853,-122.651583,-122.652553,-122.655773,-122.657909,-122.663697,-122.665931,-122.668915,-122.670787,-122.674283,-122.676247,-122.678543,-122.680863,-122.683333,-122.686703,-122.689353,-122.692063,-122.693973,-122.696412,-122.696076,-122.700224,-122.704483,-122.706473,-122.710473,-122.71472,-122.717134,-122.721184,-122.722692,-122.724937,-122.725089,-122.725697,-122.727574,-122.731121,-122.738128,-122.742034,-122.744584,-122.746347,-122.749834,-122.753255,-122.758014,-122.758905,-122.762735,-122.768734,-122.771265,-122.774074,-122.776319,-122.779134,-122.781625,-122.784205,-122.788615,-122.791085,-122.795605,-122.798259,-122.802825,-122.804727,-122.807156,-122.811705,-122.814416,-122.817065,-122.819352,-122.823015,-122.82527,-122.829074,-122.828717,-122.830352,-122.830451,-122.833148,-122.835135,-122.837442,-122.839919,-122.843403,-122.845096,-122.846854,-122.849343,-122.852796,-122.856452,-122.860134,-122.861992,-122.865465,-122.865545,-122.872923,-122.884125,-122.903999,-122.905755,-122.979199,-122.97952,-122.985827,-123.038121,-123.038427,-123.040799,-123.060853,-123.07167,-123.127696,-123.165428,-123.166002,-123.164226,-123.160434,-123.15787,-123.15911,-123.155708,-123.152389,-123.150627,-123.15034,-123.1512,-123.153386,-123.156542,-123.159533,-123.163604,-123.166868,-123.169341,-123.171308,-123.174204,-123.175342,-123.17878,-123.178903,-123.177701,-123.17501,-123.174938,-123.174054,-123.174174,-123.175133,-123.175977,-123.179931,-123.180388,-123.183671,-123.187851,-123.191102,-123.193575,-123.193657,-123.190365,-123.18975,-123.190897,-123.193752,-123.193097,-123.193766,-123.197359,-123.200105,-123.204394,-123.211304,-123.214125,-123.216178,-123.217302,-123.216802,-123.217585,-123.21691,-123.220295,-123.224557,-123.229862,-123.236564,-123.239365,-123.244844,-123.245678,-123.245334,-123.240744,-123.237425,-123.232316,-123.229898,-123.228518,-123.228599,-123.229399,-123.230581,-123.233245,-123.235102,-123.235048,-123.23319,-123.229529,-123.226797,-123.222699,-123.219661,-123.219011,-123.221167,-123.223754,-123.22595,-123.230813,-123.23416,-123.239283,-123.242288,-123.244701,-123.245157,-123.244952,-123.242821,-123.238668,-123.235868,-123.233258,-123.229297,-123.223614,-123.22345,-123.225099,-123.227668,-123.22896,-123.229146,-123.229324,-123.229331,-123.229311,-123.226797,-123.222904,-123.220377,-123.219345,-123.21938,-123.222195,-123.225841,-123.227685,-123.228054,-123.227466,-123.224857,-123.21886,-123.215459,-123.212903,-123.209194,-123.207587,-123.205287,-123.206317,-123.208492,-123.209831,-123.211306,-123.211866,-123.211785,-123.213822,-123.216462,-123.216169,-123.213992,-123.213426,-123.214276,-123.219144,-123.220156,-123.221019,-123.219354,-123.214778,-123.214409,-123.215082,-123.214343,-123.211967,-123.212619,-123.214683,-123.218023,-123.222672,-123.22581,-123.228001,-123.231079,-123.233093,-123.238067,-123.240081,-123.245055,-123.250029,-123.251728,-123.253376,-123.250254,-123.248391,-123.24579,-123.241754,-123.242113,-123.24292,-123.247404,-123.250991,-123.260151,-123.260739,-123.260791],"lat":[44.557491,44.559351,44.566167,44.571477,44.572781,44.573848,44.574095,44.574626,44.581496,44.583056,44.584597,44.585376,44.586028,44.586063,44.585615,44.585814,44.587179,44.587298,44.590002,44.593077,44.594289,44.595583,44.595896,44.59756,44.599046,44.60042,44.602857,44.604953,44.60723,44.609246,44.611036,44.613029,44.616087,44.61745,44.619,44.619901,44.620036,44.621011,44.622674,44.624542,44.62779,44.628866,44.632428,44.634245,44.637507,44.637619,44.637269,44.637507,44.63787,44.637775,44.638056,44.639291,44.640363,44.640896,44.640594,44.639801,44.639262,44.63915,44.639202,44.639818,44.640814,44.641107,44.643195,44.646585,44.649613,44.652359,44.657331,44.659373,44.662326,44.665294,44.66814,44.672546,44.674727,44.675887,44.675959,44.674763,44.674826,44.675549,44.676966,44.678592,44.682083,44.684493,44.691353,44.693903,44.696014,44.700002,44.702178,44.70831,44.711407,44.714848,44.717047,44.720225,44.722689,44.72578,44.727611,44.731585,44.736145,44.738662,44.741157,44.743363,44.745741,44.747062,44.747632,44.748914,44.7488,44.749592,44.751258,44.752109,44.751372,44.751272,44.752475,44.753731,44.756922,44.758445,44.759483,44.759049,44.752966,44.751034,44.748844,44.746553,44.746215,44.746539,44.747551,44.747011,44.745997,44.743343,44.743073,44.743504,44.74615,44.748094,44.748042,44.747124,44.744883,44.743405,44.738869,44.737684,44.737034,44.737627,44.73849,44.738451,44.73808,44.737595,44.73726,44.736823,44.735833,44.735417,44.733589,44.731045,44.728972,44.725243,44.723498,44.721804,44.720551,44.72107,44.723951,44.725578,44.725376,44.723642,44.72213,44.721154,44.719877,44.71976,44.717341,44.714894,44.712904,44.710897,44.709128,44.707409,44.705776,44.704244,44.700354,44.699592,44.699336,44.698774,44.69816,44.697591,44.694116,44.69276,44.691887,44.691194,44.690794,44.690091,44.689732,44.68794,44.686898,44.687041,44.68809,44.688924,44.686916,44.687233,44.689016,44.690286,44.69212,44.694101,44.695699,44.696058,44.693872,44.693479,44.694026,44.695985,44.696526,44.696492,44.697578,44.698606,44.700518,44.702888,44.705845,44.707984,44.709874,44.713103,44.714277,44.715557,44.721094,44.720937,44.718634,44.717986,44.715479,44.714889,44.71578,44.716995,44.719301,44.720663,44.72222,44.721852,44.723703,44.724935,44.726906,44.728611,44.729806,44.732507,44.736472,44.737503,44.739187,44.739819,44.741044,44.743794,44.744958,44.743985,44.745129,44.747499,44.748623,44.750569,44.751034,44.751136,44.752291,44.75506,44.757137,44.758216,44.7583,44.758055,44.759186,44.760755,44.76229,44.767536,44.769308,44.772644,44.774063,44.77468,44.774362,44.770896,44.770616,44.770298,44.77072,44.771708,44.775523,44.778194,44.777942,44.779591,44.783213,44.785209,44.785434,44.786855,44.78903,44.789678,44.791578,44.791537,44.791563,44.793666,44.794422,44.79278,44.792603,44.793463,44.792765,44.793174,44.792586,44.791419,44.790249,44.790451,44.789642,44.787738,44.787808,44.789479,44.789109,44.789677,44.792106,44.793214,44.792929,44.791364,44.789338,44.781647,44.780196,44.778523,44.777245,44.777267,44.77602,44.775417,44.776088,44.777371,44.777923,44.777574,44.777719,44.780277,44.781136,44.781976,44.782401,44.784738,44.787054,44.787861,44.787851,44.789107,44.789213,44.788863,44.788271,44.784075,44.782461,44.778181,44.777804,44.777214,44.776476,44.775558,44.774732,44.774716,44.774001,44.771258,44.769646,44.768072,44.767942,44.768217,44.767362,44.766239,44.765619,44.764863,44.766226,44.766867,44.766805,44.764031,44.762046,44.760641,44.758945,44.755686,44.754101,44.753486,44.752692,44.750074,44.749763,44.751043,44.754001,44.755009,44.755819,44.75489,44.753934,44.752567,44.752096,44.752139,44.753742,44.755564,44.755633,44.755259,44.755009,44.754725,44.753858,44.753404,44.753528,44.755458,44.756134,44.754761,44.752751,44.751448,44.753528,44.752011,44.752512,44.752753,44.753124,44.753908,44.754134,44.754428,44.754739,44.755006,44.755047,44.753697,44.752316,44.753131,44.755029,44.754362,44.752082,44.752014,44.754975,44.756511,44.757428,44.757225,44.75766,44.75804,44.756864,44.755972,44.755412,44.756323,44.756705,44.758759,44.758822,44.759289,44.758914,44.75621,44.75611,44.75549,44.75525,44.754257,44.753979,44.753062,44.750634,44.747099,44.746135,44.741007,44.738496,44.735506,44.734203,44.732929,44.73179,44.729275,44.728796,44.725706,44.723565,44.722504,44.722005,44.720745,44.719361,44.717246,44.713068,44.706416,44.705106,44.70099,44.698465,44.697668,44.697071,44.696937,44.695981,44.694399,44.693239,44.694456,44.696236,44.695977,44.697184,44.69617,44.696784,44.700798,44.703218,44.703152,44.703685,44.705819,44.707001,44.708729,44.710244,44.713151,44.71368,44.715565,44.717039,44.717671,44.719643,44.724254,44.726127,44.7261,44.725179,44.721143,44.718005,44.718001,44.717151,44.715879,44.714143,44.713165,44.71193,44.710977,44.710107,44.708855,44.707172,44.706996,44.707611,44.707154,44.705825,44.704358,44.702552,44.702147,44.699471,44.698712,44.700608,44.700734,44.700448,44.698365,44.697478,44.697193,44.696426,44.696384,44.697513,44.697043,44.693644,44.692955,44.692841,44.692286,44.688731,44.688263,44.688084,44.687338,44.685799,44.685691,44.687201,44.688861,44.689948,44.690218,44.689988,44.690819,44.690836,44.690576,44.687317,44.686724,44.688618,44.68911,44.687445,44.687755,44.690406,44.689704,44.69226,44.693787,44.693635,44.691065,44.692141,44.691926,44.689168,44.685483,44.685564,44.684129,44.683888,44.683915,44.683013,44.67856,44.676467,44.672991,44.671413,44.665891,44.663489,44.660301,44.657456,44.654228,44.653849,44.653385,44.652762,44.652275,44.651538,44.650642,44.649507,44.64721,44.646223,44.643578,44.640313,44.639156,44.637365,44.63719,44.636033,44.633771,44.63302,44.631081,44.628211,44.623723,44.622239,44.617967,44.615767,44.61439,44.613731,44.611599,44.610439,44.608412,44.606225,44.605198,44.603152,44.600249,44.597702,44.596546,44.594056,44.592814,44.588985,44.582152,44.581321,44.579193,44.576399,44.573115,44.572228,44.570839,44.567833,44.566362,44.564929,44.562017,44.559782,44.555321,44.553353,44.551851,44.548444,44.546928,44.545235,44.54353,44.541745,44.539172,44.537376,44.534596,44.531585,44.527784,44.525157,44.519831,44.517546,44.514425,44.513812,44.513325,44.512108,44.512981,44.512045,44.511203,44.510048,44.50698,44.504256,44.502985,44.499335,44.495385,44.492775,44.491746,44.49109,44.488942,44.486706,44.484523,44.483275,44.483372,44.481512,44.479035,44.475957,44.473565,44.471833,44.470459,44.468364,44.466672,44.464364,44.462899,44.461925,44.459549,44.458411,44.454743,44.451388,44.447288,44.444912,44.441974,44.437707,44.433879,44.431791,44.430542,44.428753,44.426582,44.424733,44.420456,44.417873,44.414634,44.413395,44.4118,44.41103,44.409387,44.408824,44.407373,44.404103,44.4022,44.398504,44.395459,44.39263,44.390962,44.389094,44.387299,44.385609,44.383067,44.380153,44.376556,44.37563,44.372889,44.372037,44.370509,44.366867,44.365129,44.361769,44.359568,44.358276,44.357319,44.355981,44.35436,44.351721,44.346432,44.342144,44.340291,44.33971,44.336549,44.334022,44.331492,44.329789,44.327522,44.325139,44.322279,44.320984,44.318174,44.31418,44.312483,44.310141,44.308217,44.307229,44.303011,44.300168,44.299044,44.29663,44.293641,44.291095,44.289461,44.287955,44.285652,44.286844,44.285323,44.28498,44.283437,44.282624,44.280192,44.274814,44.273641,44.271389,44.26845,44.267804,44.263933,44.26195,44.260241,44.260656,44.260147,44.259495,44.25955,44.25828,44.257313,44.257238,44.256164,44.253818,44.253847,44.253847,44.25263,44.252841,44.249537,44.243382,44.240603,44.238506,44.237579,44.234719,44.231189,44.229606,44.227653,44.226938,44.227001,44.224454,44.221577,44.221659,44.220742,44.219183,44.217265,44.216311,44.213326,44.211748,44.211945,44.21102,44.20938,44.209667,44.210413,44.20944,44.211013,44.217063,44.216938,44.22058,44.220657,44.218198,44.218544,44.220296,44.221306,44.21871,44.218543,44.217388,44.216748,44.21805,44.219036,44.220805,44.222209,44.223039,44.222599,44.222878,44.222406,44.219196,44.219132,44.22148,44.221927,44.219967,44.222308,44.222611,44.22167,44.223448,44.2262,44.227819,44.22982,44.231535,44.230717,44.228581,44.226498,44.226715,44.228633,44.22987,44.231511,44.233706,44.23486,44.23431,44.235184,44.235022,44.235588,44.235344,44.232295,44.231089,44.230568,44.231617,44.230575,44.229347,44.228689,44.229146,44.228044,44.22979,44.234628,44.235358,44.236587,44.237819,44.238046,44.239178,44.24123,44.242953,44.244427,44.24447,44.244228,44.245298,44.246867,44.247801,44.249852,44.25002,44.249189,44.249458,44.249263,44.251096,44.252551,44.253458,44.25681,44.260088,44.264246,44.266384,44.267078,44.26881,44.269688,44.271093,44.270062,44.269093,44.268902,44.270633,44.271849,44.273535,44.27327,44.274128,44.274459,44.27373,44.273948,44.275387,44.275771,44.277019,44.278893,44.279938,44.27822,44.279319,44.27937,44.281603,44.280931,44.281778,44.282775,44.283162,44.285639,44.286668,44.286529,44.28823,44.285828,44.287467,44.286051,44.285909,44.28473,44.28724,44.289137,44.290066,44.290537,44.288119,44.286729,44.284609,44.283816,44.283909,44.2834,44.283459,44.28565,44.285866,44.285708,44.284724,44.284435,44.283952,44.284171,44.27983,44.276269,44.27639,44.275804,44.27432,44.276858,44.277106,44.278525,44.28097,44.282166,44.282285,44.283455,44.282129,44.281352,44.281187,44.283601,44.284282,44.284298,44.285539,44.285373,44.285586,44.286662,44.287317,44.25898,44.258952,44.258894,44.259129,44.200736,44.200616,44.200613,44.200572,44.200129,44.200745,44.200136,44.200077,44.200024,44.200016,44.200071,44.201877,44.204725,44.207989,44.211612,44.214094,44.219947,44.222689,44.2252,44.226627,44.228779,44.231343,44.233269,44.233078,44.235315,44.240113,44.245854,44.247537,44.248114,44.248645,44.251601,44.253056,44.255751,44.259514,44.261582,44.266608,44.267131,44.275152,44.277606,44.283431,44.283725,44.28493,44.285562,44.287587,44.290742,44.292272,44.294963,44.295892,44.29984,44.303354,44.305646,44.306974,44.308573,44.308829,44.308716,44.309222,44.309747,44.310808,44.313726,44.317272,44.32066,44.324952,44.32943,44.331266,44.330779,44.328999,44.329186,44.330984,44.332099,44.33363,44.337789,44.338879,44.339869,44.340852,44.342591,44.344606,44.345995,44.348468,44.352618,44.354622,44.356979,44.358396,44.359847,44.360124,44.359588,44.35993,44.362497,44.366149,44.36901,44.370322,44.371131,44.37205,44.374888,44.377715,44.380821,44.382254,44.384143,44.385352,44.384887,44.385229,44.386089,44.388135,44.393452,44.395505,44.39935,44.406912,44.41221,44.41312,44.414127,44.414213,44.415073,44.417256,44.416941,44.415712,44.416461,44.419436,44.422371,44.426664,44.42996,44.431889,44.433293,44.434126,44.434205,44.434638,44.434572,44.435239,44.437074,44.443038,44.445745,44.447397,44.448576,44.450269,44.452756,44.457143,44.460622,44.468473,44.471695,44.473803,44.476371,44.479649,44.481805,44.482585,44.484751,44.486962,44.488627,44.491014,44.494188,44.495079,44.501218,44.504978,44.507681,44.51022,44.510982,44.513286,44.516608,44.522623,44.524644,44.527969,44.528059,44.526172,44.525947,44.526486,44.52887,44.532434,44.536969,44.539654,44.544575,44.547324,44.548154,44.550583,44.551983,44.555148,44.556365,44.557491]}]],[[{"lng":[-123.664749,-123.648969,-123.645909,-123.64362,-123.642355,-123.64134,-123.641389,-123.64295,-123.644987,-123.650637,-123.65773,-123.659517,-123.663013,-123.664993,-123.664749],"lat":[46.24431,46.248461,46.248494,46.248936,46.248754,46.247981,46.247204,46.246304,46.246071,46.244072,46.243367,46.243493,46.242576,46.242691,46.24431]}],[{"lng":[-124.012634,-124.005028,-124.000212,-123.999324,-123.996234,-123.988866,-123.988429,-123.991718,-123.995997,-123.995521,-123.989817,-123.986252,-123.98031,-123.972942,-123.961739,-123.953971,-123.950506,-123.950413615329,-123.947417,-123.927038,-123.924050837444,-123.923582,-123.905277,-123.903064,-123.900449,-123.902501,-123.891762,-123.883336,-123.878821,-123.87478,-123.860943,-123.859272926153,-123.859049388323,-123.857591219399,-123.85574673717,-123.854801,-123.847572098271,-123.847209,-123.845341184316,-123.842849,-123.839603,-123.838415,-123.838415,-123.838415,-123.838415,-123.838415,-123.838415,-123.843644,-123.851904098175,-123.859911,-123.861859819695,-123.862896,-123.866643,-123.864209,-123.85776,-123.854941,-123.849652258608,-123.846209,-123.838801,-123.824412679777,-123.821834,-123.798702737971,-123.793936,-123.787774156994,-123.783204,-123.771027240351,-123.770201,-123.766873,-123.763308,-123.757589,-123.750569859726,-123.748097,-123.744294,-123.735733,-123.725279,-123.718149,-123.69343,-123.693131268615,-123.67865639816,-123.674178,-123.67538,-123.672039,-123.666751,-123.660868,-123.6535,-123.644231,-123.632347,-123.626436257279,-123.619512,-123.614521,-123.60196,-123.595982,-123.582434,-123.559617,-123.548156,-123.547659,-123.538092,-123.526391,-123.516188,-123.501245,-123.479644,-123.474844,-123.468743,-123.46455181596,-123.447592,-123.436254852847,-123.427629,-123.428054143685,-123.430987,-123.422645419531,-123.390404,-123.379541,-123.371433,-123.363743140809,-123.36375,-123.364023,-123.364329,-123.364652,-123.365152,-123.365677,-123.365373,-123.365968,-123.366516,-123.367438,-123.359614,-123.359489,-123.360303,-123.360564,-123.360427,-123.360365,-123.360627,-123.358826,-123.360794,-123.361003,-123.361622,-123.48513,-123.485086,-123.54582,-123.56717,-123.644355,-123.653642,-123.662297,-123.682896,-123.703567,-123.720001,-123.71984,-123.84338,-123.86475,-123.957356,-123.969078621366,-123.968018,-123.968984,-123.965982,-123.961544,-123.962232,-123.964606,-123.963968585885,-123.962515,-123.962736,-123.964284,-123.965946886424,-123.967231,-123.966477037815,-123.965629,-123.965756551586,-123.967625694786,-123.96763,-123.969864540348,-123.971516,-123.971831,-123.97413,-123.978446,-123.978286,-123.977933,-123.980423,-123.983825,-123.983734,-123.985063,-123.988716,-123.99304,-123.991272,-123.993703,-123.988391,-123.98571,-123.980835,-123.974998,-123.973854,-123.975067,-123.974074,-123.972927,-123.969991,-123.957438,-123.956212174103,-123.952063,-123.941831,-123.937578073856,-123.937471,-123.936976303464,-123.936393232754,-123.933810595383,-123.927891,-123.927931398902,-123.927973474601,-123.928928749063,-123.92933,-123.929984556436,-123.933366,-123.941611463287,-123.941929939178,-123.947531,-123.95919,-123.961625301618,-123.963419924031,-123.96377569977,-123.974124,-123.977403593384,-123.986469758432,-123.996766,-124.010344,-124.021428,-124.012634],"lat":[46.23685,46.23833,46.236416,46.233726,46.22978,46.22715,46.224132,46.220408,46.219092,46.216461,46.209224,46.208237,46.206921,46.212678,46.207916,46.207159,46.20577,46.2056637980039,46.202219,46.191617,46.1907284574343,46.190589,46.18069,46.176812,46.174343,46.168704,46.164978,46.168747,46.168089,46.162821,46.158597,46.1582557524132,46.1582100767413,46.1579121278649,46.1575352432675,46.157342,46.1586398125733,46.158705,46.1594863981209,46.160529,46.162163,46.166607,46.168457353916,46.168498,46.170013,46.1700320231959,46.171051,46.171545,46.1760307507397,46.180379,46.1823480586939,46.183395,46.187674,46.189527,46.190757,46.188465,46.1910179139907,46.19268,46.192211,46.1905845016097,46.190293,46.1952595302013,46.196283,46.1975788702633,46.19854,46.2040782109177,46.204454,46.206263,46.211033,46.213001,46.2078971118656,46.206099,46.203961,46.201257,46.195077,46.188989,46.189812,46.1899422023193,46.1962510864866,46.198203,46.212401,46.215474,46.218228,46.216296,46.214652,46.213172,46.213172,46.2141565865164,46.21531,46.217612,46.224749,46.226328,46.230525,46.243426,46.249018,46.259109,46.26061,46.263404,46.266153,46.271004,46.269131,46.267831,46.264531,46.2616183143491,46.249832,46.2381989727856,46.229348,46.2232991346567,46.181571,46.1759919270221,46.154428,46.150998,46.146372,46.1463246103232,46.135489,46.127255,46.125069,46.120724,46.111274,46.099071,46.08312,46.069546,46.058442,46.039528,46.039372,46.011211,45.953538,45.953402,45.879307,45.874827,45.866592,45.836657,45.808172,45.786853,45.779579,45.780021,45.775657,45.775055,45.775411,45.774548,45.77503,45.774656,45.77367,45.773735,45.77308,45.783218,45.783518,45.782754,45.783121,45.7830789476988,45.798472,45.802941,45.80642,45.837101,45.847203,45.856809,45.8589678554596,45.863891,45.869974,45.881946,45.8835462531041,45.884782,45.8883409650687,45.892344,45.8933296722535,45.9077737308722,45.907807,45.9091893558919,45.910211,45.915345,45.917156,45.918179,45.923825,45.928564,45.930863,45.931092,45.933217,45.935011,45.93575,45.938842,45.942494,45.946431,45.94906,45.951157,45.952828,45.956129,45.959261,45.961683,45.962858,45.966328,45.969139,45.974469,45.9747292171811,45.97561,45.97566,45.9772655771636,45.977306,45.978971753744,45.9809350830733,45.9896314000151,46.009564,46.010474,46.0114217704711,46.032939676254,46.041978,46.0467937578809,46.071672,46.0975516365884,46.0985512214542,46.116131,46.141675,46.1460979734688,46.1493573509761,46.1500035077577,46.168798,46.173895405281,46.1879867611841,46.20399,46.223514,46.230109,46.23685]}],[{"lng":[-124.035223,-124.032609,-124.031183,-124.025439,-124.025607,-124.02402,-124.021516,-124.020328,-124.016684,-124.013832,-124.008841,-124.008929,-124.011218,-124.018586,-124.025003,-124.028331,-124.036174,-124.035223],"lat":[46.285137,46.284973,46.28333,46.284567,46.290697,46.290834,46.286917,46.282975,46.279388,46.27331,46.26723,46.26557,46.265752,46.271995,46.274131,46.273967,46.281523,46.285137]}]],[[{"lng":[-121.805269,-121.804426,-121.80044,-121.798154,-121.793219,-121.788805,-121.784556,-121.781958,-121.781098,-121.781588,-121.781121,-121.778803,-121.779132,-121.779672,-121.78183,-121.781727,-121.779906,-121.778672,-121.770738,-121.766495,-121.755915,-121.752152,-121.751454,-121.749443,-121.744103,-121.740994,-121.737791,-121.735545,-121.730625,-121.725175,-121.720814,-121.717652,-121.716996,-121.718681,-121.718977,-121.722407,-121.722584,-121.715266,-121.714462,-121.710813,-121.707639,-121.699939,-121.698143,-121.697656,-121.696035,-121.693396,-121.691214,-121.688164,-121.683277,-121.680346,-121.672405,-121.660852,-121.65871,-121.66043,-121.660419,-121.660828,-121.659639,-121.656909,-121.653593,-121.652018,-121.651394,-121.652732,-121.653315,-121.652581,-121.652638,-121.653866,-121.657245,-121.660444,-121.661656,-121.662415,-121.662382,-121.662881,-121.664694,-121.665717,-121.667021,-121.677722,-121.682723,-121.685005,-121.687776,-121.69088,-121.693387,-121.695074,-121.696085,-121.699675,-121.69865,-121.700208,-121.702383,-121.706179,-121.70805,-121.708402,-121.710291,-121.71065,-121.710201,-121.710503,-121.711596,-121.712219,-121.715716,-121.718675,-121.723999,-121.725283,-121.727194,-121.728533,-121.729226,-121.730168,-121.731438,-121.732018,-121.733403,-121.736506,-121.738794,-121.740329,-121.743454,-121.746454,-121.747973,-121.748649,-121.749061,-121.748245,-121.74687,-121.741175,-121.738512,-121.736292,-121.73492,-121.73048,-121.727341,-121.719697,-121.715592,-121.714469,-121.712953,-121.711275,-121.710517,-121.709251,-121.705971,-121.703592,-121.69945,-121.698375,-121.697685,-121.691112,-121.689772,-121.685082,-121.682607,-121.684475,-121.686262,-121.685304,-121.684793,-121.681537,-121.682463,-121.680898,-121.689261,-121.691878,-121.696411,-121.696479,-121.635917,-121.614577,-121.481888,-121.480617,-121.480361,-121.480879,-121.480159,-121.481441,-121.481798,-121.481719,-121.482056,-121.481813,-121.481753,-121.482168,-121.440646,-121.440551,-121.441224595532,-121.423592,-121.401739,-121.383451776795,-121.372574,-121.365470443381,-121.351267011354,-121.33777,-121.312198,-121.294453886635,-121.287323,-121.251183,-121.215779,-121.204808148559,-121.200367,-121.196631142901,-121.195233,-121.196149220098,-121.196556,-121.183841,-121.170474994227,-121.167852,-121.145534,-121.140560367303,-121.139483,-121.131953,-121.129228277698,-121.123793795051,-121.123239617734,-121.1222,-121.120085996729,-121.117052,-121.120064,-121.084933,-121.071453407883,-121.06437,-121.033582,-121.007449,-120.983478,-120.977978,-120.953077,-120.943977,-120.915876,-120.915795173154,-120.914976,-120.914281,-120.912191,-120.909223,-120.907361,-120.904775,-120.903975,-120.904375,-120.906375,-120.911282,-120.911675,-120.909275,-120.906075,-120.901176,-120.898788,-120.896478,-120.895397,-120.895674,-120.896872,-120.903013,-120.904815,-120.905899,-120.905657,-120.906528,-120.908205,-120.909382,-120.908459,-120.903006,-120.899356,-120.898438,-120.896833,-120.890264,-120.884983,-120.884644,-120.884777,-120.884318,-120.882656,-120.877966,-120.874893,-120.869928,-120.865268,-120.864073,-120.854473,-120.853673,-120.841972,-120.838772,-120.833877,-120.827084,-120.825731,-120.82629,-120.828587,-120.834585,-120.836184,-120.837783,-120.838881,-120.838981,-120.83458,-120.833178,-120.833377,-120.838172,-120.839071,-120.839171,-120.837471,-120.837371,-120.835571,-120.836073,-120.837971,-120.845671,-120.847671,-120.856571,-120.859072,-120.860972,-120.861471,-120.861871,-120.862871,-120.865371,-120.865771,-120.865071,-120.863971,-120.859571,-120.856371,-120.851771,-120.84947,-120.84987,-120.852271,-120.854872,-120.85917,-120.86209,-120.86287,-120.86267,-120.86157,-120.86657,-120.86607,-120.868569,-120.868235,-120.866075,-120.865759,-120.866962,-120.868265,-120.872479,-120.877522,-120.879164,-120.881064,-120.883039,-120.883445,-120.889071,-120.89428,-120.898171,-120.899771,-120.899371,-120.901065,-120.904671,-120.909271,-120.914371,-120.918671,-120.920371,-120.920475,-120.919771,-120.920471,-120.921771,-120.923671,-120.930471,-120.934171,-120.938472,-120.939628,-120.939568,-120.935868,-120.933068,-120.932169,-120.93237,-120.93377,-120.935871,-120.938471,-120.940771,-120.946372,-120.949472,-120.953672,-120.955072,-120.955372,-120.953872,-120.946472,-120.945771,-120.946071,-120.947171,-120.954171,-120.955773,-120.956471,-120.959771,-120.963672,-120.966974,-120.969577,-120.97218,-120.973344,-120.974381,-120.97387,-120.972589,-120.973089,-120.979647,-120.982776,-120.985498,-120.986474,-120.988673,-120.990473,-120.992973,-120.997673,-121.000973,-121.005447,-121.007455,-121.01079,-121.01569,-121.017429,-121.018588,-121.018483,-121.019811,-121.022556,-121.024374,-121.026348,-121.031202,-121.03044,-121.028421,-121.020739,-121.017771,-121.017426,-121.021053,-121.024135,-121.024876,-121.023617,-121.019468,-121.018924,-121.020367,-121.022217,-121.024033,-121.022639,-121.023321,-121.022588,-121.022667,-121.0217,-121.023799,-121.023648,-121.025194,-121.025146,-121.022886,-121.022387,-121.020562,-121.024289,-121.022339,-121.020535,-121.019103,-121.02369,-121.023205,-121.020802,-121.021783,-121.023358,-121.024294,-121.024,-121.022616,-121.017866,-121.017603,-121.019213,-121.018916,-121.017818,-121.015251,-121.01339,-121.012758,-121.013426,-121.012104,-121.009205,-121.00779,-121.005607,-121.004846,-121.002122,-120.998011,-120.996341,-120.996115,-120.994305,-120.992661,-120.990604,-120.987691,-120.987364,-120.984454,-120.982904,-120.981623,-120.979915,-120.978751,-120.976906,-120.971202,-120.969286,-120.965499,-120.96269,-120.960641,-120.95377,-120.952936,-120.952541,-120.955009,-120.95345,-120.949477,-120.948817,-120.945892,-120.944643,-120.943269,-120.941741,-120.940399,-120.939568,-120.937582,-120.934796,-120.933105,-120.932135,-120.930986,-120.929924,-120.928255,-120.925671,-120.92356,-120.919952,-120.918168,-120.921218,-120.920404,-120.915516,-120.913498,-120.91103,-120.907903,-120.906598,-120.903867,-120.900336,-120.896262,-120.89586,-120.893665,-120.891826,-120.890777,-120.889357,-120.885464,-120.883252,-120.880732,-120.874104,-120.869892,-120.866917,-120.862649,-120.858274,-120.857412,-120.855029,-120.852133,-120.850241,-120.848278,-120.846485,-120.841194,-120.838408,-120.837282,-120.83473,-120.8339,-120.830944,-120.828702,-120.826779,-120.824421,-120.82114,-120.818038,-120.816572,-120.814098,-120.810337,-120.810019,-120.807057,-120.804459,-120.802598,-120.801544,-120.799513,-120.797512,-120.79614,-120.793721,-120.791689,-120.790705,-120.789015,-120.785207,-120.781447,-120.779175,-120.776469,-120.771887,-120.770957,-120.769803,-120.767269,-120.767914,-120.769379,-120.76907,-120.765987,-120.764167,-120.76099,-120.761838,-120.761281,-120.757615,-120.75508,-120.753057,-120.75116,-120.74927,-120.747881,-120.74657,-120.745747,-120.744025,-120.742358,-120.739885,-120.737715,-120.734189,-120.733197,-120.731003,-120.727515,-120.726786,-120.723166,-120.724375,-120.72332,-120.72414,-120.722779,-120.722032,-120.718645,-120.718381,-120.719022,-120.718099,-120.720072,-120.721768,-120.722581,-120.725299,-120.726605,-120.727736,-120.728455,-120.727052,-120.727391,-120.726329,-120.728574,-120.729487,-120.729292,-120.730182,-120.729792,-120.688617,-120.626232,-120.504419,-120.503733,-120.494548,-120.495748,-120.49516,-120.495548,-120.494048,-120.490647,-120.489647,-120.489347,-120.488547,-120.483347,-120.482647,-120.483647,-120.484947,-120.489047,-120.489747,-120.488046,-120.481046,-120.481346,-120.483446,-120.485646,-120.488946,-120.488946,-120.480945,-120.479545,-120.479645,-120.481745,-120.480864,-120.482573,-120.486545,-120.487646,-120.487246,-120.483767,-120.482877,-120.481248,-120.480046,-120.478688,-120.479487,-120.477168,-120.47751,-120.480902,-120.483766,-120.48367,-120.47929,-120.477712,-120.476773,-120.476778,-120.477292,-120.479707,-120.482025,-120.485982,-120.485821,-120.484919,-120.485083,-120.486572,-120.487029,-120.489133,-120.488231,-120.482655,-120.479385,-120.481685,-120.480293,-120.478641,-120.476528,-120.472884,-120.474898,-120.47708,-120.476621,-120.472776,-120.470495,-120.470127,-120.471271,-120.471074,-120.468709,-120.468899,-120.474136,-120.473566,-120.469777,-120.467323,-120.462494,-120.460798,-120.458259,-120.455771,-120.454775,-120.453485,-120.450991,-120.444521,-120.43946,-120.436328,-120.436139,-120.438784,-120.440553,-120.446918,-120.451259,-120.455737,-120.458764,-120.460126,-120.460353,-120.459592,-120.456202,-120.454706,-120.454163,-120.455204,-120.452471,-120.445746,-120.443361,-120.439561,-120.43628,-120.435567,-120.433469,-120.427549,-120.424464,-120.41846,-120.413864,-120.41258,-120.411979,-120.410794,-120.410061,-120.40829,-120.405558,-120.405045,-120.405023,-120.401587,-120.400495,-120.397282,-120.394199,-120.390315,-120.387086,-120.380249,-120.378686,-120.376617,-120.372173,-120.371441,-120.68959,-120.923309,-120.989505,-121.08948,-121.090568,-121.091897,-121.210841,-121.351973,-121.725068,-121.725068,-121.752994,-121.750261,-121.746671,-121.745258,-121.742441,-121.741864,-121.742406,-121.748587,-121.751069,-121.753182,-121.750034,-121.747874,-121.747741,-121.746221,-121.739922,-121.736936,-121.733528,-121.734223,-121.735253,-121.734396,-121.730737,-121.728208,-121.726138,-121.724519,-121.723013,-121.71822,-121.715592,-121.714854,-121.71456,-121.723005,-121.728994,-121.732821,-121.735372,-121.738297,-121.742614,-121.747297,-121.747324,-121.744585,-121.744453,-121.745436,-121.748452,-121.752417,-121.754124,-121.760379,-121.76256,-121.764083,-121.766527,-121.772236,-121.773775,-121.777156,-121.77977,-121.78285,-121.787028,-121.789703,-121.79511,-121.796127,-121.790661,-121.786735,-121.785612,-121.785593,-121.786147,-121.787787,-121.791112,-121.792162,-121.792475,-121.794783,-121.79603,-121.798502,-121.798684,-121.800131,-121.803345,-121.802626,-121.801623,-121.802935,-121.803471,-121.802547,-121.803163,-121.804406,-121.805667,-121.805269],"lat":[45.011496,45.012877,45.015183,45.01615,45.017471,45.016028,45.015132,45.015214,45.016312,45.018144,45.021486,45.026237,45.030126,45.031646,45.033698,45.034399,45.035136,45.037277,45.039837,45.03958,45.037218,45.036162,45.034836,45.034098,45.03385,45.034428,45.033616,45.034668,45.036182,45.036784,45.036915,45.037566,45.038037,45.039285,45.042325,45.044095,45.045432,45.051756,45.053214,45.055912,45.057054,45.05852,45.059579,45.061626,45.062866,45.06365,45.065692,45.067109,45.068012,45.068111,45.067683,45.066362,45.066355,45.069473,45.073623,45.075258,45.079635,45.082515,45.084943,45.086706,45.088803,45.097111,45.098582,45.099886,45.101992,45.102852,45.103177,45.104415,45.105425,45.107592,45.11335,45.114456,45.115172,45.11972,45.120519,45.12236,45.123572,45.12369,45.122474,45.11806,45.116934,45.117392,45.118883,45.12179,45.123789,45.127066,45.129102,45.131594,45.134055,45.137271,45.14039,45.143283,45.148733,45.150597,45.152824,45.153424,45.154039,45.156838,45.158354,45.159339,45.161556,45.164721,45.168594,45.170314,45.170633,45.170913,45.174913,45.176313,45.180374,45.182227,45.183795,45.18635,45.188995,45.1918,45.197559,45.2051,45.205997,45.206788,45.206156,45.206919,45.208963,45.211543,45.212044,45.211691,45.210941,45.21133,45.212368,45.215347,45.21847,45.21998,45.221466,45.2233,45.224054,45.226448,45.227391,45.229558,45.22965,45.228409,45.228988,45.230368,45.233301,45.235873,45.240067,45.243495,45.247204,45.250581,45.251348,45.254141,45.255359,45.25792,45.258059,45.257377,45.258128,45.272711,45.286679,45.294275,45.315542,45.34583,45.403625,45.435496,45.482753,45.490679,45.505055,45.519604,45.519394,45.53276,45.6973034385521,45.69399,45.692887,45.6992977172998,45.703111,45.7034861389801,45.7042362225356,45.704949,45.699925,45.6907187476547,45.687019,45.67839,45.671238,45.6559982544447,45.649829,45.6350456589765,45.629513,45.6206319670926,45.616689,45.606441,45.6061542691238,45.606098,45.607886,45.6112362771232,45.611962,45.609762,45.6115234451054,45.6150366628937,45.6153949206591,45.616067,45.6169088233693,45.618117,45.623134,45.647893,45.6509451315419,45.652549,45.650998,45.653217,45.648344,45.649345,45.656745,45.656445,45.641345,45.641301218792,45.636345,45.634693,45.632496,45.627939,45.626731,45.621645,45.617145,45.615745,45.613245,45.608839,45.605245,45.602445,45.600345,45.598387,45.596399,45.592333,45.589342,45.586685,45.585914,45.579033,45.576068,45.571842,45.568928,45.565662,45.564497,45.561148,45.558241,45.553406,45.549261,45.543979,45.54268,45.541614,45.539326,45.538782,45.531695,45.529435,45.527564,45.526771,45.526944,45.528391,45.528848,45.528746,45.523446,45.521846,45.517546,45.515946,45.515968,45.515307,45.514077,45.511466,45.509945,45.507742,45.506742,45.504841,45.502441,45.501841,45.497345,45.494646,45.493046,45.485645,45.483245,45.479546,45.475646,45.474546,45.471246,45.469146,45.467346,45.462746,45.461946,45.461546,45.459946,45.456246,45.454546,45.450346,45.448446,45.446046,45.445046,45.440546,45.439046,45.435846,45.434645,45.433645,45.431445,45.428545,45.427145,45.426945,45.428645,45.428414,45.427346,45.425346,45.422746,45.412746,45.409346,45.401146,45.397879,45.393451,45.391231,45.389224,45.38852,45.388216,45.391687,45.392414,45.392552,45.390457,45.387278,45.383145,45.378322,45.374445,45.370245,45.364245,45.361596,45.360745,45.362145,45.362645,45.361345,45.359344,45.356144,45.351645,45.349245,45.348045,45.347345,45.347745,45.347745,45.346845,45.345588,45.342046,45.340244,45.337843,45.336443,45.332443,45.331343,45.330844,45.331345,45.332645,45.336745,45.337645,45.337245,45.335645,45.334445,45.333445,45.331345,45.327145,45.325045,45.323445,45.316745,45.313445,45.310345,45.307945,45.306845,45.30694,45.307437,45.308635,45.309899,45.312945,45.316643,45.319027,45.320315,45.322652,45.321963,45.320256,45.318543,45.312644,45.309344,45.307444,45.306544,45.307644,45.309698,45.31006,45.309269,45.307148,45.30514,45.301504,45.297022,45.294684,45.291386,45.289725,45.288917,45.285857,45.28481,45.284328,45.28618,45.284738,45.281969,45.278573,45.27644,45.275176,45.271766,45.270476,45.268668,45.266282,45.264793,45.264107,45.261002,45.251226,45.249845,45.246643,45.245501,45.241928,45.241133,45.239548,45.23835,45.237762,45.236331,45.235346,45.232197,45.23038,45.229872,45.227813,45.225219,45.22377,45.222909,45.22145,45.220811,45.219531,45.218455,45.217972,45.217611,45.216733,45.215473,45.212678,45.212389,45.213307,45.212996,45.21213,45.210143,45.208977,45.211051,45.211071,45.209422,45.20822,45.20892,45.208369,45.206422,45.204881,45.203313,45.204362,45.204264,45.200376,45.198917,45.197788,45.20007,45.200164,45.198832,45.19887,45.200423,45.199855,45.200064,45.198167,45.198343,45.197026,45.196232,45.196589,45.199129,45.200533,45.201454,45.201916,45.200435,45.200171,45.200797,45.200084,45.198131,45.198147,45.199612,45.2006,45.200106,45.201543,45.203315,45.203523,45.200555,45.199781,45.20033,45.201783,45.20288,45.201804,45.198744,45.197811,45.198189,45.199505,45.199614,45.200337,45.203096,45.202794,45.203406,45.203031,45.202121,45.200704,45.201016,45.202158,45.202305,45.199802,45.200624,45.199481,45.198138,45.198991,45.196764,45.19465,45.195112,45.193862,45.193073,45.189711,45.190206,45.189509,45.1877,45.185869,45.184218,45.181246,45.180176,45.179206,45.178981,45.176743,45.175965,45.17698,45.175916,45.172811,45.172219,45.172641,45.170973,45.170074,45.167194,45.168318,45.167929,45.166442,45.165421,45.165388,45.164483,45.165086,45.164828,45.163302,45.163077,45.164184,45.162708,45.163256,45.162405,45.162694,45.162337,45.160367,45.158737,45.157141,45.156511,45.155435,45.153147,45.150189,45.149272,45.145745,45.144461,45.143845,45.144321,45.144024,45.142428,45.142267,45.140314,45.139557,45.137567,45.136322,45.136159,45.134805,45.1344,45.134533,45.135077,45.133054,45.132358,45.131673,45.130522,45.129578,45.127872,45.126089,45.124848,45.121757,45.119629,45.117583,45.114616,45.111056,45.106596,45.106348,45.105245,45.103616,45.100225,45.099715,45.097334,45.095639,45.093143,45.091092,45.089885,45.088765,45.086873,45.085907,45.083731,45.083695,45.083589,45.083477,45.083477,45.07465,45.07005,45.068279,45.06355,45.06295,45.06315,45.06095,45.05855,45.05785,45.05695,45.05635,45.05345,45.05195,45.04855,45.04715,45.04315,45.03895,45.03705,45.03415,45.03255,45.02915,45.02705,45.02115,45.01895,45.01525,45.01105,45.009024,45.007686,45.00615,45.002949,45.00165,45.000113,44.998224,44.992758,44.989763,44.988537,44.984596,44.981876,44.980374,44.978676,44.975432,44.972849,44.972941,44.972278,44.970088,44.967456,44.966344,44.965188,44.965194,44.962749,44.960692,44.959686,44.956472,44.955769,44.954047,44.951299,44.950682,44.949244,44.947337,44.945507,44.943142,44.942458,44.940262,44.935458,44.933343,44.932197,44.929493,44.927367,44.924502,44.922126,44.919343,44.916909,44.913847,44.913388,44.909661,44.908162,44.907436,44.907439,44.905528,44.903973,44.903736,44.905132,44.907264,44.908317,44.908663,44.904258,44.899629,44.894791,44.894064,44.888013,44.886701,44.884591,44.884215,44.88281,44.881199,44.878216,44.876113,44.874285,44.873867,44.872612,44.869667,44.865607,44.8644,44.863058,44.863812,44.863607,44.862316,44.860148,44.85675,44.853686,44.853468,44.853762,44.852907,44.852174,44.848417,44.845693,44.840381,44.839552,44.839274,44.838678,44.833779,44.830843,44.830109,44.829377,44.829201,44.829733,44.829257,44.826872,44.826877,44.825007,44.822846,44.821769,44.822491,44.822996,44.823135,44.823272,44.824093,44.825098,44.825067,44.8247,44.825519,44.829919,44.829919,44.832677,44.837387,44.841401,44.845514,44.847398,44.853292,44.855163,44.856706,44.86124,44.864573,44.869565,44.872298,44.875394,44.876673,44.879812,44.882059,44.88572,44.888473,44.88931,44.890799,44.891348,44.893142,44.895375,44.896167,44.89745,44.900018,44.90277,44.90613,44.906315,44.904814,44.906819,44.907761,44.910179,44.912122,44.914636,44.917166,44.91983,44.920925,44.923042,44.927539,44.93057,44.932036,44.938447,44.941233,44.941952,44.941721,44.93984,44.938213,44.936857,44.935153,44.935654,44.935457,44.934682,44.935668,44.937426,44.941371,44.945223,44.947412,44.950377,44.952248,44.95477,44.956569,44.95786,44.959666,44.964926,44.970487,44.973167,44.974963,44.976452,44.977103,44.981021,44.982743,44.987321,44.992173,44.995386,44.999614,45.002217,45.006124,45.011496]}]],[[{"lng":[-122.001944,-122.001623,-122.000095,-121.997755,-121.995526,-121.99214,-121.98666,-121.981146,-121.977014,-121.968364,-121.964918,-121.9657,-121.967951,-121.969516,-121.972147,-121.973742,-121.974541,-121.978135,-121.980509,-121.980619,-121.982442,-121.985633,-121.98691,-121.985717,-121.986267,-121.985716,-121.984519,-121.98475,-121.983119,-121.981099,-121.980832,-121.979319,-121.979573,-121.978224,-121.976117,-121.973488,-121.972889,-121.973084,-121.972422,-121.967826,-121.966917,-121.967179,-121.971795,-121.973498,-121.974607,-121.975179,-121.974629,-121.973125,-121.973588,-121.975842,-121.977,-121.978262,-121.977949,-121.975456,-121.973689,-121.975571,-121.975173,-121.978289,-121.979648,-121.981007,-121.981248,-121.975677,-121.974351,-121.974141,-121.970437,-121.971991,-121.970119,-121.968164,-121.967095,-121.963562,-121.961437,-121.965522,-121.969048,-121.969609,-121.968894,-121.96538,-121.962544,-121.960507,-121.964026,-121.966186,-121.96739,-121.967844,-121.967157,-121.967348,-121.968382,-121.966654,-121.964404,-121.964924,-121.964537,-121.963754,-121.967767,-121.97073,-121.974371,-121.97546,-121.975565,-121.974278,-121.974756,-121.973495,-121.973657,-121.975264,-121.976611,-121.977799,-121.976763,-121.976052,-121.975226,-121.974803,-121.975192,-121.9744,-121.974401,-121.976081,-121.976173,-121.974896,-121.97542,-121.975358,-121.975113,-121.972875,-121.972931,-121.968548,-121.965431,-121.962046,-121.961483,-121.959462,-121.9575,-121.956466,-121.95296,-121.95134,-121.951391,-121.952638,-121.952256,-121.947402,-121.94521,-121.943782,-121.94233,-121.937524,-121.932415,-121.931269,-121.931479,-121.93656,-121.939333,-121.936964,-121.934322,-121.931438,-121.929404,-121.928213,-121.923578,-121.920359,-121.916801,-121.916265,-121.913613,-121.911588,-121.907868,-121.905856,-121.904318,-121.901482,-121.899743,-121.898393,-121.893921,-121.892574,-121.891442,-121.888545,-121.884325,-121.876903,-121.871602,-121.869385,-121.868029,-121.86838,-121.866636,-121.865553,-121.865855,-121.869966,-121.868366,-121.86649,-121.864863,-121.865338,-121.861553,-121.862399,-121.861353,-121.861569,-121.860927,-121.858364,-121.858102,-121.859205,-121.858174,-121.858124,-121.859497,-121.859435,-121.858022,-121.85998,-121.859711,-121.857063,-121.853218,-121.851462,-121.848898,-121.84539,-121.841387,-121.836722,-121.841469,-121.84356,-121.84511,-121.845087,-121.843135,-121.837282,-121.835963,-121.83679,-121.835458,-121.832449,-121.828402,-121.830273,-121.831355,-121.833384,-121.829239,-121.829103,-121.827099,-121.825663,-121.824533,-121.824299,-121.822384,-121.822016,-121.823599,-121.825381,-121.825042,-121.825487,-121.827324,-121.828042,-121.82955,-121.832623,-121.832785,-121.835193,-121.834472,-121.832225,-121.830059,-121.825726,-121.821394,-121.820056,-121.817468,-121.815895,-121.814176,-121.81219,-121.805421,-121.802225,-121.801513,-121.799227,-121.796501,-121.793616,-121.790365,-121.789458,-121.789211,-121.787098,-121.784547,-121.779748,-121.779395,-121.777087,-121.776779,-121.773384,-121.772481,-121.771755,-121.772156,-121.771349,-121.769259,-121.769874,-121.769311,-121.770003,-121.769573,-121.768446,-121.76807,-121.769381,-121.771345,-121.770604,-121.771649,-121.771473,-121.773003,-121.772532,-121.773339,-121.772735,-121.779553,-121.782676,-121.78402,-121.783142,-121.78342,-121.781069,-121.781132,-121.782017,-121.77888,-121.776708,-121.772426,-121.772913,-121.771647,-121.773196,-121.777229,-121.778813,-121.779738,-121.777556,-121.776464,-121.77429,-121.773407,-121.774429,-121.774047,-121.774525,-121.777485,-121.7791,-121.781511,-121.78121,-121.782174,-121.781334,-121.780652,-121.782576,-121.78161,-121.78366,-121.785631,-121.785536,-121.783458,-121.785251,-121.78406,-121.779552,-121.777905,-121.778226,-121.780239,-121.783459,-121.785753,-121.785421,-121.786562,-121.78766,-121.787806,-121.789792,-121.790457,-121.78928,-121.789648,-121.793299,-121.794053,-121.797461,-121.799426,-121.800871,-121.80525,-121.807791,-121.812668,-121.814002,-121.819172,-121.818602,-121.820058,-121.820794,-121.822017,-121.824508,-121.825031,-121.824493,-121.824693,-121.825631,-121.829123,-121.832349,-121.837029,-121.841346,-121.840588,-121.841105,-121.840178,-121.839829,-121.838676,-121.838296,-121.838672,-121.83719,-121.838501,-121.840437,-121.840333,-121.838745,-121.838989,-121.840443,-121.840783,-121.839298,-121.838263,-121.83956,-121.838718,-121.838718,-121.837607,-121.838253,-121.840536,-121.841828,-121.843443,-121.8439,-121.84041,-121.839415,-121.837076,-121.836875,-121.83738,-121.839822,-121.842406,-121.843458,-121.845989,-121.844914,-121.843679,-121.841952,-121.843342,-121.844616,-121.845412,-121.843678,-121.846471,-121.845488,-121.843159,-121.843906,-121.843138,-121.776324,-121.776324,-121.674928,-121.673699,-121.636001,-121.596883,-121.59326,-121.533117,-121.473293,-121.405495,-121.291112,-121.242113,-121.2293,-121.229289,-121.199971,-121.189792,-121.149644,-121.130934,-121.107534,-121.108065,-121.108335,-121.108537,-121.102938,-121.102883,-121.102791,-121.102781,-121.102773,-121.09243,-121.028358,-120.987271,-120.987084,-120.986955,-120.986587,-120.918109,-120.748249,-120.747848,-120.37874,-120.378107,-120.298364,-120.258386,-120.257777,-120.237934,-119.897434,-119.896581,-120.225273,-120.37771,-120.377752,-120.871802,-120.87349,-120.974959,-120.974975,-121.332969,-121.39767,-121.398498,-121.464437,-121.547864,-121.600018,-121.642987,-122.002362,-122.001944],"lat":[43.616414,43.622528,43.626357,43.62704,43.626937,43.625893,43.625632,43.625894,43.625796,43.626385,43.627045,43.62779,43.627549,43.629837,43.631689,43.633715,43.635627,43.637181,43.639685,43.64254,43.644379,43.652527,43.653858,43.656292,43.661708,43.66425,43.665708,43.667019,43.670143,43.673038,43.676079,43.680825,43.683766,43.688021,43.690301,43.691409,43.692868,43.695848,43.69714,43.701406,43.702821,43.704254,43.705008,43.706227,43.708584,43.710661,43.714027,43.715821,43.7176,43.721911,43.722386,43.724446,43.725444,43.729102,43.730635,43.733585,43.735841,43.737692,43.739082,43.741516,43.742964,43.746965,43.748549,43.750364,43.750748,43.752983,43.756832,43.757767,43.759699,43.762525,43.763745,43.765176,43.76734,43.769542,43.774753,43.777706,43.77872,43.78124,43.782628,43.784709,43.78699,43.791207,43.793313,43.795743,43.800984,43.801924,43.803954,43.805798,43.808235,43.809736,43.812761,43.813036,43.811555,43.811768,43.812541,43.817418,43.821219,43.827147,43.829345,43.827875,43.827615,43.828526,43.830226,43.834914,43.83585,43.838518,43.83999,43.84128,43.843043,43.846044,43.848478,43.851243,43.851773,43.855444,43.85757,43.859351,43.861156,43.864554,43.865763,43.865003,43.866226,43.868195,43.868549,43.870083,43.871681,43.873938,43.875554,43.876552,43.878063,43.881049,43.882058,43.884603,43.886262,43.890663,43.894213,43.897504,43.898992,43.900588,43.900866,43.903343,43.904908,43.905543,43.907347,43.909181,43.908566,43.911171,43.911488,43.912347,43.912917,43.912326,43.913876,43.913363,43.914863,43.9159,43.914537,43.912269,43.910784,43.9109,43.908658,43.90867,43.907985,43.907841,43.911681,43.911859,43.914504,43.915837,43.917106,43.919789,43.920959,43.923286,43.923898,43.925795,43.930281,43.932315,43.935837,43.937103,43.939036,43.941197,43.943048,43.944787,43.945593,43.947384,43.948783,43.951404,43.952781,43.953806,43.954542,43.958507,43.961526,43.965248,43.966596,43.966335,43.967269,43.967175,43.969574,43.971232,43.972587,43.973445,43.975021,43.976239,43.979073,43.982647,43.984745,43.985983,43.987284,43.987296,43.988727,43.989247,43.990573,43.991094,43.994496,43.995395,43.99759,44.002135,44.004224,44.008066,44.010777,44.012359,44.016406,44.019426,44.021567,44.023129,44.024752,44.029158,44.03106,44.033319,44.035576,44.037024,44.039744,44.041599,44.041365,44.044147,44.047911,44.050905,44.051832,44.051201,44.052956,44.053164,44.052251,44.052691,44.05684,44.060089,44.061662,44.067131,44.071873,44.072607,44.075019,44.076541,44.077214,44.080121,44.082353,44.085138,44.088537,44.089686,44.091034,44.094858,44.095897,44.099603,44.10134,44.10395,44.106409,44.108132,44.110428,44.11205,44.115245,44.118178,44.123916,44.125254,44.12676,44.131314,44.133307,44.134981,44.137039,44.139831,44.145276,44.14625,44.148462,44.151746,44.154322,44.155202,44.158315,44.159765,44.160744,44.159933,44.16353,44.164798,44.167583,44.169488,44.171595,44.173127,44.17565,44.178687,44.181082,44.183762,44.185623,44.187627,44.190156,44.190792,44.192042,44.194255,44.194809,44.196545,44.198499,44.199392,44.201958,44.203014,44.205326,44.20542,44.207811,44.208394,44.209599,44.212595,44.215751,44.216985,44.218877,44.221483,44.224606,44.225653,44.229239,44.230903,44.233215,44.234981,44.240762,44.243505,44.245463,44.247071,44.249326,44.25152,44.252707,44.254613,44.25828,44.25955,44.259495,44.260147,44.260656,44.260241,44.26195,44.263933,44.267804,44.26845,44.271389,44.273641,44.274814,44.280192,44.282624,44.283437,44.28498,44.285323,44.286844,44.285652,44.287955,44.289461,44.291095,44.293641,44.29663,44.299044,44.300168,44.303011,44.307229,44.308217,44.310141,44.312483,44.31418,44.318174,44.320984,44.322279,44.325139,44.327522,44.329789,44.331492,44.334022,44.336549,44.33971,44.340291,44.342144,44.346432,44.351721,44.35436,44.355981,44.357319,44.358276,44.359568,44.361769,44.365129,44.366867,44.370509,44.372037,44.372889,44.37563,44.376556,44.380153,44.383067,44.385609,44.387299,44.389094,44.390962,44.39263,44.392829,44.393402,44.393387,44.393383,44.392413,44.392578,44.392612,44.393184,44.393464,44.393153,44.392893,44.392954,44.393036,44.390646,44.390631,44.390621,44.390647,44.390635,44.3906,44.32718,44.26204,44.218519,44.218487,44.20241,44.17139,44.169238,44.138125,44.137751,44.135452,44.134026,44.076292,44.047637,43.960852,43.959365,43.95731,43.871331,43.872362,43.785429,43.785545,43.785297,43.698762,43.697376,43.6982,43.611164,43.611656,43.611489,43.615946,43.615538,43.615535,43.615384,43.617437,43.616645,43.616295,43.616218,43.616607,43.616497,43.616443,43.616648,43.615498,43.616414]}]],[[{"lng":[-123.485441,-123.463883,-123.461962,-123.461849,-123.461575,-123.461181,-123.441119,-123.440737,-123.442721,-123.421968,-123.421935,-123.402146,-123.40205,-123.361147,-123.361194,-123.361131,-123.319997,-123.320211,-123.299258,-123.299438,-123.340332,-123.340499,-123.360373,-123.376916,-123.380663,-123.380216,-123.400895,-123.423273,-123.423002,-123.443849,-123.443752,-123.464087,-123.464329,-123.464357,-123.485124,-123.484725,-123.484726,-123.361028,-123.36141,-123.361046,-123.361657,-123.361225,-123.361622,-123.34041,-123.215543,-123.195899,-123.122083,-123.115179,-123.051181,-123.050674,-123.030873,-123.0317,-123.031837,-123.011137,-122.990344,-122.990368,-122.928901,-122.929146,-122.929122,-122.929145,-122.928956,-122.929193,-122.929128,-122.918725,-122.909078,-122.908992,-122.887837,-122.887963,-122.868303,-122.867495,-122.867592,-122.866745,-122.846849,-122.846905,-122.846978,-122.826342,-122.826222,-122.826005,-122.805481,-122.805432,-122.804585,-122.803132,-122.796057,-122.795914,-122.792699,-122.795111,-122.784771,-122.78477,-122.784769,-122.784768,-122.784864,-122.784232,-122.783624,-122.78234,-122.779838,-122.774659,-122.77215,-122.76609,-122.765076,-122.764412,-122.764436,-122.764439,-122.764458,-122.764459,-122.764472,-122.764486,-122.764464,-122.743862,-122.743859,-122.743859,-122.743856,-122.743847,-122.743828,-122.743815,-122.743813,-122.743805,-122.743803,-122.743785,-122.743809,-122.743799,-122.743798,-122.743758,-122.743746,-122.743745,-122.743711,-122.743681,-122.743671,-122.743626,-122.743654,-122.743663,-122.743672,-122.743667,-122.743659,-122.743649,-122.743668,-122.743673,-122.743691,-122.743703,-122.743718,-122.743721,-122.743991,-122.744006,-122.74406,-122.744029,-122.743974,-122.743963,-122.743956,-122.743942,-122.743941,-122.743848,-122.743939,-122.743942,-122.743926,-122.743921,-122.743919,-122.743915,-122.743922,-122.743933,-122.743923,-122.743923,-122.743856,-122.743798,-122.743811,-122.743868,-122.743741,-122.746817,-122.75407,-122.764942,-122.769123,-122.784896,-122.786266,-122.787507,-122.80547,-122.805556,-122.807188,-122.82066,-122.825967,-122.842499,-122.843407,-122.846494,-122.846485,-122.846503,-122.851912,-122.857175,-122.867891,-122.904945,-122.908867,-122.908861,-122.908796,-122.92113,-122.928873,-122.939204,-122.962566,-122.970229,-122.97024,-122.970294,-122.970523,-122.970332,-122.9703,-122.976592,-122.979806,-122.991396,-122.99139,-122.991393,-122.991388,-123.011653,-123.011645,-123.01129,-123.014476,-123.027879,-123.032294,-123.032161,-123.05267,-123.062894,-123.063593,-123.072998,-123.083758,-123.103125,-123.112032,-123.114641,-123.114696,-123.134658,-123.135231,-123.135427,-123.137607,-123.138987,-123.142683,-123.151954,-123.156018,-123.176888,-123.180951,-123.196977,-123.209265,-123.46488,-123.48608,-123.485441],"lat":[45.447136,45.44726,45.462109,45.466555,45.47729,45.49156,45.491273,45.50533,45.521115,45.521408,45.535376,45.535646,45.550068,45.549902,45.558462,45.578779,45.578684,45.592984,45.593017,45.607247,45.607455,45.622201,45.622502,45.622077,45.621985,45.635752,45.636083,45.636176,45.65062,45.650678,45.665126,45.66514,45.669573,45.679274,45.67925,45.694472,45.708764,45.708696,45.737128,45.743418,45.757741,45.76493,45.779579,45.779849,45.77994,45.779909,45.780154,45.780131,45.779371,45.779362,45.779159,45.765779,45.75142,45.751458,45.750835,45.736459,45.735688,45.721482,45.698697,45.69381,45.67835,45.671015,45.635313,45.635399,45.635228,45.620763,45.620466,45.606352,45.606223,45.606226,45.591878,45.591881,45.591836,45.581018,45.577516,45.577521,45.568063,45.563041,45.562911,45.555687,45.556182,45.555689,45.555695,45.552082,45.54935,45.548433,45.5484,45.545158,45.543979,45.54232,45.533994,45.533982,45.533971,45.533946,45.533897,45.533809,45.533815,45.533852,45.533858,45.533822,45.531344,45.531184,45.529727,45.529634,45.528166,45.526737,45.519562,45.519509,45.516665,45.515754,45.5144,45.512509,45.509582,45.508181,45.507886,45.507374,45.506834,45.505017,45.497618,45.494665,45.494401,45.488258,45.48725,45.487084,45.484201,45.477961,45.476442,45.476439,45.469466,45.467532,45.465576,45.458486,45.456685,45.454892,45.447693,45.447284,45.444663,45.442944,45.435079,45.433294,45.426072,45.421046,45.418855,45.415311,45.407918,45.406149,45.404972,45.402702,45.402592,45.396544,45.393033,45.391704,45.387483,45.386845,45.386122,45.381513,45.377431,45.375538,45.372181,45.371751,45.359577,45.355871,45.353992,45.346587,45.332067,45.332045,45.331994,45.331928,45.331909,45.331825,45.33182,45.33182,45.331772,45.34566,45.346276,45.346233,45.346249,45.346133,45.346154,45.34595,45.328151,45.317192,45.317228,45.317273,45.317345,45.317457,45.317476,45.338071,45.346185,45.346241,45.34628,45.346332,45.346415,45.346454,45.346919,45.348862,45.353193,45.353774,45.36077,45.360932,45.361013,45.361096,45.364991,45.368009,45.375468,45.376348,45.382183,45.390905,45.390993,45.390902,45.390891,45.404962,45.404727,45.404898,45.404896,45.405082,45.404517,45.404421,45.404393,45.404383,45.418957,45.418937,45.424348,45.433459,45.433468,45.433473,45.433489,45.433528,45.433541,45.433584,45.433599,45.433667,45.433707,45.433332,45.433199,45.447136]}]],[[{"lng":[-123.785332,-123.784207,-123.784134,-123.784497,-123.78454,-123.761994,-123.741719,-123.65482,-123.644356,-123.613925,-123.606416,-123.507617,-123.483026,-123.463518,-123.463051,-123.463132,-123.463101,-123.462321,-123.463692,-123.464112,-123.465734,-123.46488,-123.209265,-123.196977,-123.180951,-123.176888,-123.156018,-123.151954,-123.142683,-123.138987,-123.137607,-123.135427,-123.135231,-123.134658,-123.114696,-123.114641,-123.112032,-123.103125,-123.083758,-123.072998,-123.063593,-123.062894,-123.05267,-123.032161,-123.032294,-123.027879,-123.014476,-123.01129,-123.011645,-123.011653,-122.991388,-122.991393,-122.99139,-122.991396,-122.979806,-122.976592,-122.9703,-122.970332,-122.970523,-122.970294,-122.97024,-122.970229,-122.962566,-122.939204,-122.928873,-122.92113,-122.908796,-122.908861,-122.908867,-122.904945,-122.867891,-122.868073,-122.849925,-122.854691,-122.858823,-122.86352,-122.867179,-122.872906,-122.879136,-122.881015,-122.882494,-122.886812,-122.889006,-122.893198,-122.898048,-122.899528,-122.904219,-122.908708,-122.912621,-122.916561,-122.919112,-122.922836,-122.92513,-122.928984,-122.932081,-122.943419,-122.947317,-122.949691,-122.952144,-122.954429,-122.957273,-122.958818,-122.959922,-122.961195,-122.9623,-122.964021,-122.967579,-122.971659,-122.974699,-122.974911,-122.974957,-122.974937,-122.975052,-122.977037,-122.981086,-122.98831,-122.99097,-122.996046,-122.999265,-122.999811,-123.000788,-123.001497,-123.001527,-122.998984,-122.998455,-122.997702,-122.996469,-122.996087,-122.995576,-122.995366,-122.996221,-122.997737,-122.999659,-123.003867,-123.007632,-123.02609,-123.035667,-123.038475,-123.04117,-123.044146,-123.046867,-123.049012,-123.051106,-123.050918,-123.049662,-123.047009,-123.045896,-123.043892,-123.041321,-123.036649,-123.028675,-123.024949,-123.022219,-123.020521,-123.018777,-123.019124,-123.018862,-123.01624,-123.015382,-123.014505,-123.011189,-123.007746,-123.001883,-123.000726,-123.003569,-123.007346,-123.011513,-123.01801,-123.023019,-123.02705,-123.028875,-123.031407,-123.033173,-123.033292,-123.032467,-123.032027,-123.031676,-123.031177,-123.028136,-123.025303,-123.022368,-123.020187,-123.015037,-123.012235,-123.009878,-123.007494,-123.001054,-122.998002,-122.996444,-122.999042,-123.002309,-123.005564,-123.008255,-123.009998,-123.014574,-123.018118,-123.027643,-123.033439,-123.036121,-123.041478,-123.044916,-123.046115,-123.051936,-123.059397,-123.062251,-123.067619,-123.068627,-123.068271,-123.068667,-123.092128,-123.186276,-123.209454,-123.249322,-123.321413,-123.339945,-123.396679,-123.412698,-123.448934,-123.468746,-123.477905,-123.478264,-123.49442,-123.495414,-123.50222,-123.550602,-123.551215,-123.561352,-123.568496,-123.57142,-123.576563,-123.599208,-123.601657,-123.622159,-123.627081,-123.657202,-123.724368,-123.724362,-123.784016,-123.784135,-123.784487,-123.784259,-123.784192,-123.784157,-123.785567,-123.785332],"lat":[45.166922,45.173379,45.202101,45.202095,45.216294,45.216283,45.216266,45.216607,45.2171,45.217103,45.216555,45.216264,45.216134,45.216312,45.259918,45.274549,45.280192,45.338244,45.367548,45.374535,45.417388,45.433332,45.433707,45.433667,45.433599,45.433584,45.433541,45.433528,45.433489,45.433473,45.433468,45.433459,45.424348,45.418937,45.418957,45.404383,45.404393,45.404421,45.404517,45.405082,45.404896,45.404898,45.404727,45.404962,45.390891,45.390902,45.390993,45.390905,45.382183,45.376348,45.375468,45.368009,45.364991,45.361096,45.361013,45.360932,45.36077,45.353774,45.353193,45.348862,45.346919,45.346454,45.346415,45.346332,45.34628,45.346241,45.346185,45.338071,45.317476,45.317457,45.317345,45.259695,45.259697,45.257252,45.254719,45.253084,45.252972,45.253827,45.254425,45.254827,45.255211,45.256531,45.257491,45.257798,45.256622,45.256719,45.259435,45.262835,45.266203,45.267445,45.268065,45.268509,45.268635,45.268621,45.268499,45.267586,45.267485,45.26826,45.270488,45.273639,45.278695,45.280509,45.281837,45.282982,45.28388,45.284894,45.285083,45.283041,45.279979,45.279143,45.278081,45.276928,45.276226,45.273321,45.271011,45.268761,45.267714,45.264811,45.261554,45.26085,45.259347,45.257284,45.254877,45.242731,45.241311,45.239953,45.238752,45.238305,45.237426,45.233981,45.230698,45.226947,45.223696,45.22217,45.222137,45.223224,45.222789,45.222272,45.220788,45.21828,45.216583,45.214705,45.211305,45.209391,45.207266,45.204744,45.201105,45.199481,45.198918,45.199434,45.201943,45.202051,45.201121,45.199841,45.19584,45.191003,45.189247,45.181566,45.177017,45.175796,45.173053,45.170955,45.167365,45.16452,45.161321,45.159498,45.160252,45.162765,45.162905,45.161894,45.160852,45.15794,45.153831,45.150825,45.146614,45.145564,45.144999,45.144303,45.141313,45.140185,45.139431,45.138747,45.136757,45.133769,45.129273,45.127319,45.123249,45.120604,45.117631,45.114694,45.11311,45.111091,45.107235,45.105444,45.101967,45.100961,45.100555,45.098953,45.097729,45.094073,45.090273,45.089197,45.086332,45.083942,45.082673,45.078925,45.076586,45.074864,45.07486,45.074932,45.075013,45.074982,45.075073,45.075527,45.075495,45.075389,45.075365,45.075293,45.0752,45.075176,45.075175,45.075138,45.07513,45.075115,45.075553,45.075568,45.075733,45.075848,45.075899,45.075976,45.076016,45.07602,45.076056,45.076067,45.076118,45.076226,45.076777,45.076657,45.087581,45.08866,45.104049,45.130885,45.144694,45.159712,45.166922]}]],[[{"lng":[-117.977663335055,-117.717852,-117.62359560026,-117.60342451872,-117.603163,-117.504833,-117.480103,-117.479935132756,-117.47536,-117.475148,-117.439943,-117.390738,-117.382131203034,-117.353928,-117.337668,-117.280513327856,-117.216731,-117.214534,-117.212616,-117.090186778506,-117.070047,-117.051304,-116.985882,-116.940681,-116.915989,-116.911409,-116.900497,-116.892861,-116.894652,-116.89091,-116.886843,-116.880506,-116.87598,-116.874869,-116.875706,-116.873933,-116.870484,-116.869655,-116.866544,-116.859795,-116.857254,-116.84355,-116.830003,-116.819182,-116.814142,-116.796555004061,-116.796051,-116.794454975327,-116.790151,-116.787792,-116.78752,-116.788923,-116.789066,-116.788329,-116.782676,-116.7634,-116.759787,-116.755288,-116.750978,-116.745219,-116.740486,-116.736268,-116.715527,-116.711822,-116.70845,-116.698079,-116.697192,-116.687007,-116.680139,-116.665344,-116.659629,-116.646342,-116.639641,-116.635814,-116.632032,-116.60504,-116.593004,-116.577422,-116.559444,-116.553548,-116.549085,-116.546643,-116.543862684798,-116.537173,-116.535698,-116.538014,-116.536395,-116.535396,-116.528272,-116.523961,-116.512326,-116.49451,-116.487894,-116.487274,-116.487835,-116.487447,-116.484219,-116.483286,-116.482495,-116.48282653917,-116.482899,-116.482806,-116.481018,-116.475803,-116.472346,-116.471241,-116.472882,-116.469813,-116.46517,-116.463504,-116.463635,-116.471646,-116.474702,-116.476521,-116.480788,-116.483105,-116.483412,-116.481208,-116.481943,-116.48297,-116.490279,-116.502756,-116.503728,-116.503156,-116.503957,-116.506967,-116.510342,-116.513931,-116.517468,-116.522233,-116.525888,-116.527723,-116.528558,-116.52828,-116.526201,-116.523947,-116.523638,-116.527492979455,-116.535482,-116.543837,-116.548676,-116.5525,-116.554634,-116.556587,-116.557587,-116.556575,-116.554549,-116.553473,-116.553171,-116.558804,-116.558803,-116.55498,-116.554829,-116.561744,-116.563985,-116.575949,-116.581382,-116.588195,-116.592416,-116.597447,-116.619057,-116.626633,-116.653252,-116.673793,-116.674648,-116.672594,-116.672163,-116.672733,-116.674493,-116.675587,-116.681013,-116.687027,-116.687174152113,-116.695619,-116.698661,-116.703181,-116.704217,-116.708003,-116.70975,-116.708546,-116.709536,-116.724205,-116.724192007616,-116.724188,-116.725137,-116.727452,-116.728757,-116.729607,-116.731216,-116.734021,-116.742962,-116.745535,-116.746607,-116.748564,-116.752839,-116.754643,-116.774847,-116.782492,-116.783537,-116.784244,-116.783771926572,-117.022673,-117.022673,-117.091719,-117.266005,-117.266006,-117.266006,-117.320193,-117.373361,-117.476684,-117.476762,-117.496311,-117.501432,-117.520941,-117.520674,-117.522313,-117.522249,-117.542216,-117.542058,-117.561969,-117.562208,-117.582166,-117.582674,-117.582344,-117.622801,-117.622777,-117.643494,-117.643485,-117.663391,-117.664146,-117.68379,-117.683951,-117.683794,-117.683986,-117.727235,-117.727225,-117.730633,-117.745959,-117.746137,-117.767063,-117.766865,-117.787623,-117.788395,-117.74765,-117.747464,-117.747405,-117.747327,-117.97298,-117.977639,-117.977663335055],"lat":[46.0007234754428,45.999866,45.999061415294,45.9988892323573,45.998887,45.998317,45.99787,45.9978694691105,45.997855,45.997893,45.998633,45.998598,45.9980721459827,45.996349,45.998662,45.9985173847898,45.998356,45.99832,45.998321,45.9976245645994,45.99751,45.996849,45.996974,45.996274,45.995413,45.988912,45.982801,45.976373,45.969686,45.96001,45.958617,45.958508,45.95441,45.950253,45.945008,45.939894,45.932408,45.923799,45.916958,45.907264,45.904159,45.892273,45.886405,45.880938,45.877551,45.8590045012698,45.858473,45.8561406398762,45.849851,45.844267,45.840204,45.836741,45.833471,45.831928,45.825376,45.81658,45.816167,45.817061,45.818537,45.821394,45.82446,45.826179,45.826773,45.826267,45.825117,45.820852,45.820135,45.806319,45.79359,45.781998,45.780016,45.779815,45.781274,45.783642,45.784979,45.781018,45.778541,45.76753,45.755189,45.753388,45.752735,45.750972,45.7469544885719,45.737288,45.734231,45.714929,45.69665,45.691734,45.681473,45.677639,45.670224,45.655679,45.649769,45.647675,45.644302,45.643682,45.642322,45.641529,45.639916,45.6367721223766,45.636085,45.633595,45.632152,45.6317,45.629409,45.627669,45.624884,45.620604,45.617986,45.615785,45.602785,45.593647,45.59179,45.589673,45.587942,45.58516,45.582615,45.580597,45.577898,45.577008,45.574499,45.566608,45.565102,45.562754,45.560953,45.558427,45.556809,45.556281,45.55679,45.555626,45.553734,45.551818,45.551078,45.54989,45.549482,45.548234,45.54661,45.539602100419,45.525079,45.514193,45.510385,45.508311,45.507856,45.506232,45.503217,45.501388,45.500154,45.499107,45.495932,45.481188,45.480076,45.472801,45.46293,45.461213,45.460169,45.452522,45.448984,45.44292,45.427356,45.41277,45.39821,45.388037,45.351084,45.321511,45.314342,45.298023,45.288938,45.283183,45.276349,45.274867,45.27072,45.267857,45.2676428484611,45.255353,45.245552,45.2408,45.227972,45.222317,45.217243,45.207356,45.203015,45.171501,45.164945960344,45.162924,45.159072,45.156023,45.144381,45.142091,45.139934,45.138289,45.134898,45.133038,45.124878,45.122945,45.121768,45.113972,45.105536,45.09579,45.093605,45.088128,45.078265731912,45.079167,45.079734,45.080158,45.08057,45.152442,45.166539,45.166537,45.16654,45.166539,45.209973,45.209977,45.210148,45.209768,45.223598,45.253458,45.267731,45.267424,45.295956,45.295879,45.310219,45.310184,45.324359,45.338096,45.338171,45.336789,45.33687,45.365322,45.365749,45.428344,45.428365,45.441917,45.506771,45.51523,45.51478,45.61699,45.61692,45.616635,45.660736,45.660227,45.689605,45.689567,45.773515,45.773625,45.833238,45.850523,45.861072,45.860595,45.860602,46.0007234754428]}]],[[{"lng":[-120.005565,-120.005124,-120.004752,-120.004859,-120.004783,-119.999242,-119.998172,-119.998161,-119.999501176112,-119.965744,-119.908917240841,-119.907461,-119.876144,-119.868272037091,-119.868135,-119.802655,-119.772927,-119.729909361077,-119.672199870904,-119.669877,-119.623393,-119.600549,-119.571584,-119.536946521092,-119.524632,-119.487829,-119.456238441501,-119.450256,-119.432149953782,-119.432128,-119.432181,-119.432054,-119.434665,-119.434772,-119.435024,-119.434695,-119.434788,-119.434603,-119.434622,-119.43455,-119.434644,-119.434606,-119.43464,-119.248547,-119.248444,-119.248214,-119.145144,-119.14561,-119.148243,-119.147264,-119.146789,-119.146424,-119.163037,-119.162966,-119.306043,-119.306611,-119.544565,-119.552894,-119.593374,-119.603647,-119.667065,-119.672228,-119.770244,-119.781719,-119.791162,-119.790961,-119.790699,-119.790831,-119.760731,-119.759759,-119.883914,-119.882356,-119.882346,-119.897751,-120.006555,-120.005565],"lat":[45.350553,45.385771,45.501959,45.502468,45.517157,45.517539,45.68439,45.687968,45.8124817188485,45.824365,45.8280408039571,45.828135,45.834718,45.8359407146783,45.835962,45.84753,45.845578,45.8502905291199,45.8566125323665,45.856867,45.905639,45.919581,45.925456,45.913024662526,45.908605,45.906307,45.9155950765374,45.917354,45.918250445405,45.90729,45.879312,45.865421,45.864893,45.828536,45.826207,45.805961,45.802167,45.756429,45.746143,45.704977,45.704411,45.621409,45.602985,45.601935,45.573187,45.516076,45.515909,45.428579,45.255939,45.255936,45.171034,45.08294,45.082943,44.996241,44.995696,44.995993,44.995689,44.995311,44.99531,44.994539,44.994664,44.995117,44.995193,44.994816,44.994755,45.023517,45.067823,45.081253,45.081278,45.169211,45.169152,45.25596,45.256916,45.257017,45.257706,45.350553]}]],[[{"lng":[-121.3513,-121.349315,-121.349247,-121.348471,-121.332413,-121.332609,-121.332969,-120.974975,-120.974959,-120.87349,-120.871802,-120.377752,-120.37771,-120.225273,-119.896581,-119.895163,-119.895056,-119.896465,-119.896969,-119.932611,-119.931944,-119.931595,-119.943504,-119.943441,-119.943779,-119.706005,-119.705858,-119.365337,-119.365156,-119.363896,-119.363648,-119.363579,-119.359446,-119.360121480893,-119.360177,-119.444598,-119.72573,-119.790087,-119.848907,-119.872929,-119.876054,-119.986801,-119.999234,-120.046745935305,-120.088176,-120.159409852771,-120.160711,-120.188026,-120.272095999129,-120.276920753459,-120.284045,-120.325751,-120.326387,-120.328538964699,-120.328540043301,-120.413985011427,-120.489013,-120.508434445763,-120.564863,-120.61589,-120.680984,-120.786166,-120.819216277206,-120.878231,-120.879925977229,-120.879805,-120.880501,-120.880436,-120.882106,-120.882106,-120.883327,-120.899236,-120.996696,-120.996685,-121.131887,-121.349679,-121.350007,-121.35053,-121.35055,-121.3513],"lat":[42.919989,43.089928,43.111683,43.356753,43.356663,43.473058,43.616645,43.617437,43.615384,43.615535,43.615538,43.615946,43.611489,43.611656,43.611164,43.592745,43.568127,43.353816,43.179017,43.178963,42.976439,42.917005,42.917079,42.753671,42.746371,42.746605,42.748791,42.748958,42.661822,42.487079,42.220094,42.137231,42.13723,41.9943837248054,41.994384,41.995478,41.996296,41.997544,41.997281,41.997641,41.997199,41.995709,41.994944,41.9948937861312,41.99485,41.994566063361,41.9945608770155,41.994452,41.9929801905817,41.9928957238404,41.992771,41.993143,41.992586,41.9925995898795,41.992599596691,41.9931391904968,41.993613,41.9935136523275,41.993225,41.993029,41.99357,41.993809,41.9937957174251,41.993772,41.9937643415584,41.996882,42.428587,42.483263,42.483262,42.486559,42.744214,42.743806,42.743688,42.746349,42.746775,42.746644,42.833905,42.91669,42.919989,42.919989]}]],[[{"lng":[-124.015851,-124.012163,-124.006057,-124.004863,-123.996836,-123.989529,-123.987671142877,-123.97734943563,-123.976188590439,-123.975425,-123.972855462376,-123.970461,-123.968660474861,-123.968232789041,-123.968187,-123.968560618402,-123.972529,-123.976507,-123.971328,-123.970173135164,-123.964276,-123.958061,-123.962607,-123.963217724763,-123.964127353106,-123.964169,-123.964380552095,-123.968982320543,-123.972899,-123.978671,-124.007756,-124.007494,-123.979715,-123.978955013993,-123.973398,-123.965728,-123.960557,-123.961131916315,-123.962035,-123.962528536153,-123.964074,-123.974665,-123.974302867085,-123.971997014932,-123.971892,-123.970804752809,-123.970154,-123.970139671867,-123.970121,-123.973381,-123.97409492245,-123.976647761464,-123.97865,-123.978534795427,-123.976544,-123.970794,-123.96634,-123.962095,-123.957568,-123.94944,-123.949468,-123.951155,-123.951567332492,-123.95319628028,-123.956711,-123.952264,-123.949998649289,-123.949787395219,-123.947632127365,-123.944234559771,-123.942805782962,-123.941981614177,-123.941433103909,-123.939964,-123.937358469373,-123.937272,-123.940394,-123.939653,-123.940874071402,-123.941568,-123.942219645651,-123.942937192789,-123.943121,-123.943567208808,-123.946027,-123.952045022158,-123.954899774688,-123.957689,-123.962908,-123.967425,-123.967841,-123.964335,-123.965567651763,-123.970272,-123.978679,-123.981732,-123.983029,-123.979597,-123.978804,-123.974456,-123.973555,-123.969302,-123.969078621366,-123.957356,-123.86475,-123.84338,-123.71984,-123.720001,-123.703567,-123.682896,-123.662297,-123.653642,-123.644355,-123.56717,-123.54582,-123.485086,-123.48513,-123.361622,-123.361225,-123.361657,-123.361046,-123.36141,-123.361028,-123.484726,-123.484725,-123.485124,-123.464357,-123.464329,-123.464087,-123.443752,-123.443849,-123.423002,-123.423273,-123.400895,-123.380216,-123.380663,-123.376916,-123.360373,-123.340499,-123.340332,-123.299438,-123.299258,-123.320211,-123.319997,-123.361131,-123.361194,-123.361147,-123.40205,-123.402146,-123.421935,-123.421968,-123.442721,-123.440737,-123.441119,-123.461181,-123.461575,-123.461849,-123.461962,-123.463883,-123.485441,-123.48608,-123.46488,-123.465734,-123.464112,-123.463692,-123.462321,-123.463101,-123.463132,-123.463051,-123.463518,-123.483026,-123.507617,-123.606416,-123.613925,-123.644356,-123.65482,-123.741719,-123.761994,-123.78454,-123.784497,-123.784134,-123.784207,-123.785332,-123.785567,-123.784157,-123.784192,-123.784259,-123.784487,-123.784135,-123.784016,-123.724362,-123.724368,-123.724663,-123.784759,-123.801472,-123.895988,-123.911026,-123.955007,-123.967184,-123.967191,-123.986688,-124.008880714497,-124.009069,-124.00977,-124.015011,-124.017991,-124.015851],"lat":[45.064759,45.076921,45.084736,45.084232,45.090167,45.094045,45.1008197766356,45.1384584412288,45.1426915261005,45.145476,45.159582575209,45.172728,45.1952852386477,45.2006433482882,45.201217,45.2025015176212,45.216145,45.21933,45.226849,45.2341520625869,45.271444,45.278013,45.281073,45.2951302262423,45.3160674015395,45.317026,45.3175073597732,45.3279780961366,45.33689,45.338854,45.336813,45.33974,45.347724,45.3485742170505,45.354791,45.386242,45.430778,45.4356126650042,45.443207,45.4446362942545,45.449112,45.467333,45.4678668620106,45.4712661853439,45.471421,45.4724857265356,45.473123,45.476818355795,45.481634,45.482538,45.4831227958426,45.4852139048169,45.486854,45.4870114900121,45.489733,45.493507,45.493417,45.497175,45.510399,45.545389,45.564829,45.565544,45.5659713979159,45.5676598626949,45.571303,45.586296,45.5986233755376,45.5997729583602,45.6115012952122,45.6299898636449,45.6377648488614,45.6422497341726,45.6452345665112,45.653229,45.6562826586659,45.656384,45.662926,45.688975,45.7035959750661,45.711905,45.7182519363268,45.7252407438024,45.727031,45.7279857578689,45.733249,45.737627056936,45.7397038636989,45.741733,45.74362,45.751041,45.755753,45.758296,45.7595095505395,45.764141,45.762156,45.76251,45.768044,45.768968,45.772913,45.774836,45.777508,45.779837,45.7830789476988,45.783121,45.782754,45.783518,45.783218,45.77308,45.773735,45.77367,45.774656,45.77503,45.774548,45.775411,45.775055,45.775657,45.780021,45.779579,45.76493,45.757741,45.743418,45.737128,45.708696,45.708764,45.694472,45.67925,45.679274,45.669573,45.66514,45.665126,45.650678,45.65062,45.636176,45.636083,45.635752,45.621985,45.622077,45.622502,45.622201,45.607455,45.607247,45.593017,45.592984,45.578684,45.578779,45.558462,45.549902,45.550068,45.535646,45.535376,45.521408,45.521115,45.50533,45.491273,45.49156,45.47729,45.466555,45.462109,45.44726,45.447136,45.433199,45.433332,45.417388,45.374535,45.367548,45.338244,45.280192,45.274549,45.259918,45.216312,45.216134,45.216264,45.216555,45.217103,45.2171,45.216607,45.216266,45.216283,45.216294,45.202095,45.202101,45.173379,45.166922,45.159712,45.144694,45.130885,45.104049,45.08866,45.087581,45.076657,45.076777,45.076226,45.044432,45.04473,45.044913,45.045552,45.045679,45.04572,45.045727,45.044843,45.044634,45.0449987048377,45.045114,45.047266,45.047969,45.049808,45.064759]}]],[[{"lng":[-121.919685,-121.911695,-121.908793,-121.901879,-121.902678,-121.903291,-121.902915,-121.906325,-121.907176,-121.908329,-121.907326,-121.910309,-121.912619,-121.913911,-121.913019,-121.911443,-121.910516,-121.910547,-121.91549,-121.918386,-121.918095,-121.915803,-121.915913,-121.914551,-121.915527,-121.915184,-121.913115,-121.915478,-121.916509,-121.918698,-121.922051,-121.922028852172,-121.908267,-121.904448014441,-121.900858,-121.900897392331,-121.901855,-121.877908566384,-121.875695401271,-121.867167,-121.858205244407,-121.838112759325,-121.811304,-121.735104,-121.711711588727,-121.707358,-121.675958711965,-121.668362,-121.638119011462,-121.631167,-121.609320387848,-121.562727136099,-121.534252432855,-121.533106,-121.531983021128,-121.523685853632,-121.522392,-121.511087960406,-121.499153,-121.494687797672,-121.494686798243,-121.483672986716,-121.481489451388,-121.467065281238,-121.462849,-121.441224595532,-121.440551,-121.440646,-121.482168,-121.481753,-121.481813,-121.482056,-121.481719,-121.481798,-121.481441,-121.480159,-121.480879,-121.480361,-121.480617,-121.481888,-121.614577,-121.635917,-121.696479,-121.695032,-121.692134,-121.690732,-121.690481,-121.689008,-121.687532,-121.685033,-121.68505,-121.684562,-121.681973,-121.68,-121.679888,-121.680813,-121.679232,-121.679081,-121.68159,-121.683547,-121.685262,-121.687945,-121.687276,-121.688772,-121.689975,-121.691752,-121.693809,-121.697615,-121.698691,-121.700932,-121.702476,-121.70326,-121.702846,-121.703592,-121.704567,-121.704223,-121.70326,-121.703546,-121.701957,-121.70123,-121.702141,-121.700918,-121.700709,-121.699231,-121.700209,-121.69756,-121.696925,-121.698113,-121.699988,-121.700473,-121.704123,-121.705532,-121.708575,-121.714579,-121.716979,-121.720904,-121.723201,-121.72419,-121.726508,-121.730946,-121.732298,-121.735074,-121.738405,-121.744622,-121.756938,-121.762165,-121.766144,-121.773181,-121.776204,-121.780122,-121.783928,-121.785633,-121.790802,-121.792696,-121.793651,-121.794539,-121.796434,-121.799679,-121.802589,-121.80456,-121.806916,-121.806939,-121.807908,-121.805791,-121.80559,-121.807583,-121.807559,-121.805977,-121.806845,-121.810726,-121.814319,-121.815501,-121.819587,-121.821485,-121.824922,-121.828898,-121.831765,-121.83527,-121.836809,-121.842521,-121.844301,-121.846764,-121.846821,-121.847872,-121.850403,-121.854653,-121.85882,-121.860323,-121.86337,-121.861111,-121.860137,-121.859828,-121.860873,-121.864656,-121.866919,-121.868187,-121.869342,-121.870166,-121.874665,-121.878538,-121.881862,-121.885605,-121.888674,-121.891749,-121.89392,-121.895902,-121.902817,-121.906688,-121.906924,-121.909746,-121.911443,-121.911614,-121.913087,-121.913761,-121.913216,-121.91644,-121.922136,-121.919685],"lat":[45.547614,45.548941,45.549992,45.55619,45.55686,45.559517,45.561121,45.561935,45.56255,45.564983,45.566723,45.566826,45.568211,45.571163,45.575168,45.576484,45.579733,45.581241,45.582447,45.585484,45.587287,45.589685,45.591609,45.593684,45.597109,45.598698,45.601297,45.605163,45.607635,45.608288,45.610761,45.6491618990508,45.654399,45.6583215914573,45.662009,45.662353021086,45.670716,45.6862907085108,45.6877301463022,45.693277,45.6954401547252,45.7002900029046,45.706761,45.694039,45.6946881803028,45.694809,45.7030807428963,45.705082,45.7047364355389,45.704657,45.7095324475309,45.7199305336331,45.7262851537756,45.726541,45.7263456264124,45.7249021020319,45.724677,45.7228135043382,45.720846,45.7184501847691,45.718449648523,45.7125401610082,45.7113685797871,45.7036292560113,45.701367,45.6973034385521,45.53276,45.519394,45.519604,45.505055,45.490679,45.482753,45.435496,45.403625,45.34583,45.315542,45.294275,45.286679,45.272711,45.258128,45.257377,45.258059,45.25792,45.263859,45.268412,45.271641,45.275625,45.276153,45.279234,45.281798,45.283681,45.286259,45.287942,45.290025,45.292672,45.294816,45.295895,45.297177,45.299775,45.300714,45.30306,45.30503,45.306251,45.309477,45.316379,45.319453,45.321348,45.322947,45.323929,45.327889,45.329188,45.331267,45.334258,45.338957,45.339223,45.344448,45.346629,45.349016,45.35187,45.356172,45.363389,45.364545,45.366277,45.368338,45.369899,45.371963,45.373564,45.373838,45.376309,45.378531,45.381733,45.383545,45.383619,45.386754,45.387131,45.3894,45.39177,45.393648,45.393784,45.394798,45.395593,45.395664,45.397131,45.397261,45.401105,45.402844,45.403433,45.402457,45.402672,45.407275,45.4101,45.412164,45.415202,45.415174,45.418572,45.424228,45.427171,45.427854,45.431927,45.432929,45.435494,45.440485,45.442561,45.443096,45.444307,45.448983,45.450143,45.451832,45.454649,45.455518,45.457968,45.459678,45.461675,45.46333,45.465469,45.467466,45.470184,45.472492,45.474619,45.476109,45.476188,45.47907,45.481329,45.483377,45.486502,45.486638,45.489006,45.489377,45.492844,45.495096,45.496923,45.499168,45.501814,45.504495,45.506786,45.508715,45.514103,45.514598,45.515751,45.514295,45.513125,45.512408,45.512252,45.512631,45.513388,45.514896,45.51853,45.520828,45.524655,45.526749,45.529082,45.530303,45.532567,45.535329,45.537275,45.543205,45.546673,45.547614]}]],[[{"lng":[-119.434772,-119.434665,-119.432054,-119.432181,-119.432128,-119.432149953782,-119.364396,-119.356927874882,-119.322509,-119.312779611952,-119.265781460289,-119.25715,-119.225745,-119.204349373269,-119.19553,-119.169496,-119.141390171444,-119.12612,-119.093221,-119.061462,-119.027056,-119.008558,-118.987196090377,-118.987129,-118.977787096598,-118.941242,-118.86812798659,-118.788694725992,-118.785765634062,-118.725242193351,-118.67787,-118.658717,-118.639332,-118.637725,-118.606789334728,-118.590497392025,-118.579906,-118.57571,-118.569392,-118.554902302619,-118.537119,-118.497027,-118.470756,-118.424027212824,-118.415326658626,-118.403817114887,-118.387301768013,-118.387293095034,-118.37836,-118.36779,-118.36716827519,-118.340494051998,-118.314982,-118.283526,-118.256368,-118.25253,-118.23666752911,-118.236584,-118.228941,-118.146028,-118.131019,-118.126197,-117.99694971271,-117.996911,-117.977663335055,-117.977639,-117.97298,-117.972948,-118.045003,-118.045102,-118.054666,-118.066506,-118.066465,-118.066513,-118.066383,-118.117194,-118.117121,-118.116844,-118.11836,-118.116309,-118.116355,-118.116362,-118.116461,-118.117464,-118.197955,-118.197876,-118.241668,-118.241665,-118.267614,-118.366326,-118.366522,-118.384117,-118.38422,-118.392817,-118.404849,-118.404806,-118.428539,-118.428539,-118.428329,-118.469471,-118.506172,-118.506296,-118.536194,-118.572271,-118.577354,-118.613107,-118.613254,-118.613243,-118.633925,-118.656266,-118.656251,-118.697766,-118.697013,-118.696986,-118.656102,-118.655992,-118.546632,-118.547652,-118.518687,-118.519022,-118.518689,-118.675353,-118.946612,-119.002263,-119.162966,-119.163037,-119.146424,-119.146789,-119.147264,-119.148243,-119.14561,-119.145144,-119.248214,-119.248444,-119.248547,-119.43464,-119.434606,-119.434644,-119.43455,-119.434622,-119.434603,-119.434788,-119.434695,-119.435024,-119.434772],"lat":[45.828536,45.864893,45.865421,45.879312,45.90729,45.918250445405,45.921605,45.9236692670188,45.933183,45.9341867678607,45.9390355038675,45.939926,45.932725,45.9292871126004,45.92787,45.927603,45.9310086675325,45.932859,45.942745,45.958527,45.969134,45.97927,45.9997905520367,45.999855,46.0000013775916,46.000574,46.0006742162676,46.0007830942314,46.0007871090932,46.0008700676541,46.000935,46.000955,46.000994,46.00097,46.0008886734271,46.0008458436429,46.000818,46.000718,46.000773,46.0008030811739,46.00084,46.00062,46.000632,46.0006026668075,46.0005972051842,46.0005899802661,46.0005796130411,46.0005796075968,46.000574,46.000622,46.0006200103111,46.0005346455232,46.000453,46.000787,46.000439,46.000459,46.0004182147682,46.000418,46.000421,46.000701,46.00028,46.000282,46.0007868487855,46.000787,46.0007234754428,45.860602,45.860595,45.816896,45.817073,45.773538,45.773563,45.77346,45.769522,45.737574,45.688395,45.688607,45.673797,45.600729,45.514664,45.514652,45.498842,45.49282,45.470732,45.470702,45.4704,45.427204,45.427391,45.428841,45.429103,45.428951,45.43531,45.435246,45.44258,45.442554,45.44255,45.429013,45.429076,45.428951,45.35519,45.355164,45.354867,45.354632,45.354518,45.354767,45.354773,45.354951,45.345788,45.339884,45.340006,45.340337,45.345146,45.345647,45.259928,45.257715,45.257729,45.196928,45.196898,45.080753,45.08069,45.010173,44.995877,44.997662,44.997439,44.996558,44.996241,45.082943,45.08294,45.171034,45.255936,45.255939,45.428579,45.515909,45.516076,45.573187,45.601935,45.602985,45.621409,45.704411,45.704977,45.746143,45.756429,45.802167,45.805961,45.826207,45.828536]}]],[[{"lng":[-124.1152,-124.110793224148,-124.10907,-124.109042455264,-124.108102657969,-124.108088,-124.109556,-124.109059,-124.106518,-124.104537939304,-124.100587,-124.098696003703,-124.092633,-124.09257772478,-124.092463110466,-124.086872,-124.084686,-124.084403674725,-124.0837,-124.083714,-124.083554722423,-124.083475419185,-124.08331,-124.084429,-124.083601,-124.077996,-124.077599366608,-124.076387,-124.075399,-124.071469543556,-124.070986189155,-124.070659499243,-124.069662181446,-124.067223499261,-124.06635,-124.066510728242,-124.066565382567,-124.067251,-124.06914,-124.068732391746,-124.068382456744,-124.068251,-124.066393894948,-124.06635,-124.067045,-124.065008,-124.063293560589,-124.062121498473,-124.058312330843,-124.058281,-124.060043,-124.063498,-124.066467,-124.07409,-124.078026,-124.079249,-124.072012,-124.068445,-124.065315427968,-124.063406,-124.059857,-124.057901,-124.058181453278,-124.058539,-124.06017,-124.064816,-124.064279,-124.06429,-124.068112,-124.066325,-124.069158,-124.075473,-124.074586244664,-124.073235024702,-124.073012,-124.073077,-124.074049344185,-124.074066,-124.067760724008,-124.067437,-124.063735,-124.063592299854,-124.063589011661,-124.063498,-124.063770144253,-124.067883,-124.067772,-124.067730713109,-124.067712670147,-124.06756,-124.067345158107,-124.066622,-124.061048,-124.059095250869,-124.054151,-124.053756784081,-124.048814,-124.045903377286,-124.037694989725,-124.032296,-124.025447618374,-124.025427720548,-124.025136,-124.025416882061,-124.025678,-124.024993086351,-124.024981927707,-124.024189142756,-124.023943285941,-124.023834,-124.02050369952,-124.017168554748,-124.017091597529,-124.016595443995,-124.016305243106,-124.015243,-124.014452951513,-124.013141309957,-124.012547595484,-124.012053555073,-124.011979123524,-124.0105900194,-124.009462791521,-124.009179,-124.010183,-124.012184,-124.011662,-124.00627,-124.005504,-124.008880714497,-123.986688,-123.967191,-123.967184,-123.955007,-123.911026,-123.895988,-123.801472,-123.784759,-123.724663,-123.725337,-123.725396,-123.725771,-123.724599,-123.724659,-123.724782,-123.724231,-123.724858,-123.724842,-123.725394,-123.725188,-123.725079,-123.725001,-123.716062,-123.704578,-123.704467,-123.602609,-123.603143,-123.602794,-123.602817,-123.596929,-123.596919,-123.596674,-123.596134,-123.597233,-123.59763,-123.597677,-123.608115,-123.648669,-123.66875,-123.679097,-123.68952,-123.699976,-123.720071,-123.720065,-123.72014,-123.715866,-123.715675,-123.715538,-123.735153,-123.734996,-123.816709,-123.816525,-123.775789,-123.775598,-123.798955,-123.941075,-123.941072,-124.063259,-124.063303,-124.083717,-124.114043752426,-124.113261,-124.113139093471,-124.111747,-124.1152],"lat":[44.286486,44.2988659489304,44.303707,44.3038814406453,44.3098331711722,44.309926,44.314545,44.318391,44.321848,44.3252125340905,44.331926,44.3411180393286,44.37059,44.3709219295689,44.371610192405,44.405185,44.420221,44.423136738616,44.430404,44.440011,44.4549692934339,44.4624169275216,44.477952,44.486927,44.501123,44.521985,44.5242600339205,44.531214,44.531606,44.5596389307304,44.5630872042146,44.5654178257118,44.5725327387105,44.589930414375,44.596162,44.59828090129,44.599001416354,44.60804,44.612979,44.615277011887,44.6172498737895,44.617991,44.6221223504817,44.62222,44.627851,44.632504,44.6392226043931,44.6438157219045,44.658743219609,44.658866,44.669361,44.672442,44.673061,44.673183,44.67565,44.6772,44.677917,44.683094,44.6955669500131,44.703177,44.716027,44.735163,44.7377481813923,44.741044,44.745076,44.746081,44.748465,44.753678,44.760618,44.762671,44.767806,44.771403,44.778483350406,44.7892722460794,44.791053,44.794318,44.7980431891997,44.798107,44.8043190617745,44.804638,44.80531,44.8094729907543,44.8095689172014,44.812224,44.8123385053927,44.814069,44.817815,44.8191507867329,44.8197345446305,44.824674,44.8260228314602,44.830563,44.834438,44.8355124791867,44.838233,44.839102683012,44.850007,44.8589587771585,44.8842041158734,44.900809,44.9269839736841,44.9270600245102,44.928175,44.9325110520331,44.936542,44.9414756811252,44.9415560608816,44.9472667780803,44.9490377737797,44.949825,44.9626480717717,44.9754897961224,44.9757861141132,44.977696516016,44.9788139127335,44.982904,44.9873098492237,44.9946244571541,44.9979354140053,45.0006905203016,45.0011056013856,45.0088521934298,45.0151383849173,45.016721,45.023823,45.026111,45.033485,45.038214,45.042931,45.0449987048377,45.044634,45.044843,45.045727,45.04572,45.045679,45.045552,45.044913,45.04473,45.044432,45.025068,45.023601,45.000746,45.00076,44.984273,44.962958,44.955493,44.94753,44.911745,44.88599,44.764328,44.753939,44.739046,44.739018,44.73898,44.721154,44.721154,44.709242,44.702125,44.651159,44.651139,44.545624,44.541804,44.477454,44.477454,44.46932,44.433109,44.433671,44.43342,44.432935,44.433928,44.433582,44.433788,44.433374,44.432329,44.389506,44.389495,44.379969,44.360458,44.36035,44.345778,44.344622,44.315303,44.316167,44.283547,44.283304,44.282951,44.277375,44.277178,44.275094,44.276117,44.2769899702691,44.277953,44.2783783845383,44.283236,44.286486]}]],[[{"lng":[-123.366516,-123.365968,-123.365373,-123.365677,-123.365152,-123.364652,-123.364329,-123.364023,-123.36375,-123.363743140809,-123.360561,-123.346252,-123.340655,-123.332335,-123.302588994244,-123.301034,-123.280166,-123.251233,-123.242026,-123.230813,-123.22243,-123.213054,-123.166414,-123.119730298412,-123.115904,-123.105021,-123.072955001104,-123.051064,-123.041297,-123.03382,-123.022885224802,-123.022147,-123.009436,-123.004233,-122.966694913215,-122.962681,-122.939676274918,-122.937415175285,-122.930461538264,-122.904119,-122.902954826569,-122.885933339972,-122.884478,-122.88307501286,-122.881327583221,-122.878092,-122.87766154657,-122.864284541462,-122.856158,-122.850300357308,-122.845875047125,-122.838578021636,-122.837638,-122.833420843631,-122.813998,-122.812215297032,-122.811841461838,-122.806193,-122.811204257205,-122.81151,-122.81006272961,-122.808350897773,-122.799082951662,-122.798091,-122.796820712691,-122.794675088814,-122.785026,-122.785121333263,-122.785299579417,-122.785515,-122.785696,-122.795963,-122.79572928967,-122.795605,-122.778983853061,-122.77064606136,-122.769532,-122.761451,-122.760974137953,-122.760108,-122.762189526428,-122.762437,-122.784663,-122.784735,-122.863423,-122.87539,-122.885463,-122.929146,-122.928901,-122.990368,-122.990344,-123.011137,-123.031837,-123.0317,-123.030873,-123.050674,-123.051181,-123.115179,-123.122083,-123.195899,-123.215543,-123.34041,-123.361622,-123.361003,-123.360794,-123.358826,-123.360627,-123.360365,-123.360427,-123.360564,-123.360303,-123.359489,-123.359614,-123.367438,-123.366516],"lat":[46.058442,46.069546,46.08312,46.099071,46.111274,46.120724,46.125069,46.127255,46.135489,46.1463246103232,46.146305,46.145065,46.146183,46.146132,46.1447065181102,46.144632,46.144843,46.156452,46.160968,46.164287,46.167682,46.172541,46.188973,46.1855486659199,46.185268,46.177676,46.1633673272527,46.153599,46.146351,46.144336,46.1394405031111,46.13911,46.136043,46.133823,46.1076189726297,46.104817,46.0965350318481,46.0957210097251,46.0932176196546,46.083734,46.0823438200884,46.0620178719878,46.06028,46.0539089971682,46.0459738715663,46.031281,46.0309510655119,46.0206978417551,46.014469,46.0038262451976,45.9957858962594,45.9825279259201,45.98082,45.9772814418892,45.960984,45.9544589188486,45.9530906006144,45.932416,45.9138572891451,45.912725,45.9096628567015,45.9060409527215,45.8864317772246,45.884333,45.8827157050054,45.8799839554795,45.867699,45.8643529779321,45.8580968659956,45.850536,45.844216,45.825024,45.815216,45.81,45.7912471031523,45.7818399456152,45.780583,45.759163,45.7503749615244,45.734413,45.7285767375573,45.728665,45.72865,45.720946,45.721416,45.721418,45.721378,45.721482,45.735688,45.736459,45.750835,45.751458,45.75142,45.765779,45.779159,45.779362,45.779371,45.780131,45.780154,45.779909,45.77994,45.779849,45.779579,45.786853,45.808172,45.836657,45.866592,45.874827,45.879307,45.953402,45.953538,46.011211,46.039372,46.039528,46.058442]}]],[[{"lng":[-120.49516,-120.309328,-120.131926,-120.128661,-120.086479,-120.028785,-120.005372,-120.000045,-119.91054,-119.910536,-119.876525,-119.850941,-119.790699,-119.790961,-119.791162,-119.781719,-119.770244,-119.672228,-119.671532,-119.652431,-119.653184,-119.653347,-119.653476,-119.653538,-119.653885,-119.653673,-119.653832,-119.653696,-119.655108,-119.655248,-119.655517,-119.899002,-119.899283,-119.960375,-119.970532,-120.000617,-120.010547,-120.020708,-120.021621,-120.101166,-120.143544,-120.36646,-120.386074,-120.385775,-120.387186,-120.386561,-120.385768,-120.386378,-120.385687,-120.387642,-120.388118,-120.387452,-120.387782,-120.389667,-120.393046,-120.398603,-120.399248,-120.397984,-120.394825,-120.394254,-120.394668,-120.39737,-120.400743,-120.404685,-120.404676,-120.401654,-120.399226,-120.398292,-120.395872,-120.394109,-120.393173,-120.390987,-120.385062,-120.385877,-120.381376,-120.379794,-120.379005,-120.380814,-120.384813,-120.385489,-120.386498,-120.386035,-120.38353,-120.377797,-120.377062,-120.380711,-120.379053,-120.372635,-120.371441,-120.372173,-120.376617,-120.378686,-120.380249,-120.387086,-120.390315,-120.394199,-120.397282,-120.400495,-120.401587,-120.405023,-120.405045,-120.405558,-120.40829,-120.410061,-120.410794,-120.411979,-120.41258,-120.413864,-120.41846,-120.424464,-120.427549,-120.433469,-120.435567,-120.43628,-120.439561,-120.443361,-120.445746,-120.452471,-120.455204,-120.454163,-120.454706,-120.456202,-120.459592,-120.460353,-120.460126,-120.458764,-120.455737,-120.451259,-120.446918,-120.440553,-120.438784,-120.436139,-120.436328,-120.43946,-120.444521,-120.450991,-120.453485,-120.454775,-120.455771,-120.458259,-120.460798,-120.462494,-120.467323,-120.469777,-120.473566,-120.474136,-120.468899,-120.468709,-120.471074,-120.471271,-120.470127,-120.470495,-120.472776,-120.476621,-120.47708,-120.474898,-120.472884,-120.476528,-120.478641,-120.480293,-120.481685,-120.479385,-120.482655,-120.488231,-120.489133,-120.487029,-120.486572,-120.485083,-120.484919,-120.485821,-120.485982,-120.482025,-120.479707,-120.477292,-120.476778,-120.476773,-120.477712,-120.47929,-120.48367,-120.483766,-120.480902,-120.47751,-120.477168,-120.479487,-120.478688,-120.480046,-120.481248,-120.482877,-120.483767,-120.487246,-120.487646,-120.486545,-120.482573,-120.480864,-120.481745,-120.479645,-120.479545,-120.480945,-120.488946,-120.488946,-120.485646,-120.483446,-120.481346,-120.481046,-120.488046,-120.489747,-120.489047,-120.484947,-120.483647,-120.482647,-120.483347,-120.488547,-120.489347,-120.489647,-120.490647,-120.494048,-120.495548,-120.49516],"lat":[45.068279,45.06779,45.067354,45.065453,45.065398,45.065224,45.065582,45.065591,45.066927,45.067928,45.067866,45.067783,45.067823,45.023517,44.994755,44.994816,44.995193,44.995117,44.823343,44.823299,44.762701,44.652252,44.652251,44.621785,44.534131,44.461288,44.454961,44.38917,44.389206,44.34547,44.307045,44.30662,44.389575,44.389457,44.388968,44.389104,44.389727,44.389687,44.438793,44.43821,44.437751,44.437015,44.436083,44.476624,44.476624,44.564009,44.578606,44.653068,44.761175,44.761979,44.763229,44.767886,44.769866,44.771638,44.773307,44.776973,44.778767,44.78073,44.782665,44.784272,44.786038,44.788414,44.789951,44.792695,44.794719,44.797861,44.799835,44.802357,44.803969,44.802712,44.797013,44.795784,44.796406,44.798474,44.800721,44.80298,44.806314,44.807352,44.807041,44.809674,44.809966,44.810985,44.8119,44.812034,44.814826,44.817938,44.819357,44.82037,44.821769,44.822846,44.825007,44.826877,44.826872,44.829257,44.829733,44.829201,44.829377,44.830109,44.830843,44.833779,44.838678,44.839274,44.839552,44.840381,44.845693,44.848417,44.852174,44.852907,44.853762,44.853468,44.853686,44.85675,44.860148,44.862316,44.863607,44.863812,44.863058,44.8644,44.865607,44.869667,44.872612,44.873867,44.874285,44.876113,44.878216,44.881199,44.88281,44.884215,44.884591,44.886701,44.888013,44.894064,44.894791,44.899629,44.904258,44.908663,44.908317,44.907264,44.905132,44.903736,44.903973,44.905528,44.907439,44.907436,44.908162,44.909661,44.913388,44.913847,44.916909,44.919343,44.922126,44.924502,44.927367,44.929493,44.932197,44.933343,44.935458,44.940262,44.942458,44.943142,44.945507,44.947337,44.949244,44.950682,44.951299,44.954047,44.955769,44.956472,44.959686,44.960692,44.962749,44.965194,44.965188,44.966344,44.967456,44.970088,44.972278,44.972941,44.972849,44.975432,44.978676,44.980374,44.981876,44.984596,44.988537,44.989763,44.992758,44.998224,45.000113,45.00165,45.002949,45.00615,45.007686,45.009024,45.01105,45.01525,45.01895,45.02115,45.02705,45.02915,45.03255,45.03415,45.03705,45.03895,45.04315,45.04715,45.04855,45.05195,45.05345,45.05635,45.05695,45.05785,45.05855,45.06095,45.06315,45.06295,45.06355,45.068279]}]],[[{"lng":[-123.231001,-123.230969,-123.230951,-123.231093,-123.229167,-123.229851,-123.2299,-123.229901,-123.229761,-123.229402,-123.229284,-123.229271,-123.229545,-123.229676,-123.229526,-123.229581,-123.229619,-123.229635,-123.210392,-123.209912,-123.200424,-123.200419,-123.190504,-123.190456,-123.180551,-123.180512,-123.152023,-123.152233,-123.112652,-123.112688,-123.009765,-123.009744,-122.990728,-122.990035,-122.970492,-122.970829,-122.95119,-122.951199,-122.9451,-122.93175,-122.9178,-122.911925,-122.868692,-122.852943,-122.853707,-122.833971,-122.814413,-122.794776,-122.794811,-122.785493,-122.784914,-122.775044,-122.775223,-122.756079,-122.756033,-122.736367,-122.736329,-122.716699,-122.716657,-122.69701,-122.697017,-122.677198,-122.677181,-122.637695,-122.637812,-122.621665,-122.600251,-122.600202,-122.580094,-122.580049,-122.560299,-122.560273,-122.520741,-122.520525,-122.460224,-122.46021,-122.440505,-122.440535,-122.420863,-122.420844,-122.401077,-122.401041,-122.401025,-122.40031,-122.385922,-122.28273,-122.282708,-122.283792,-122.283778,-122.283449,-122.284689,-122.287818,-122.287686,-122.28769,-122.287177,-122.287458,-122.28747,-122.289972,-122.289748006076,-122.320293,-122.368051522242,-122.378511,-122.403459336051,-122.416638,-122.493322,-122.548911,-122.61541287471,-122.634696,-122.672521,-122.713058,-122.75363522358,-122.813845,-122.867298,-122.870830789468,-122.875515469317,-122.884017334375,-122.889935,-122.893590970866,-122.961670756599,-122.963801,-122.988318483577,-123.043997,-123.062882,-123.080938,-123.102698940572,-123.125165,-123.145735,-123.183923,-123.23111258448,-123.231001],"lat":[42.004931,42.082066,42.098876,42.128069,42.128331,42.280466,42.287434,42.290816,42.312847,42.355665,42.420299,42.429362,42.495623,42.551766,42.626212,42.668065,42.70261,42.709956,42.709983,42.717161,42.717236,42.724474,42.724495,42.731703,42.731655,42.737765,42.737721,42.755835,42.75575,42.752218,42.752144,42.75941,42.759538,42.76095,42.760945,42.768116,42.767555,42.774773,42.774805,42.774874,42.774753,42.774704,42.774541,42.774603,42.781766,42.780653,42.780511,42.778221,42.792721,42.792712,42.806845,42.806831,42.8288,42.828689,42.823195,42.823496,42.837661,42.837671,42.85211,42.852099,42.866572,42.866603,42.88108,42.881141,42.89699,42.896812,42.895693,42.911073,42.9108,42.924651,42.92469,42.939185,42.939077,42.93976,42.939873,42.954373,42.95442,42.968923,42.968927,42.983439,42.983458,42.993456,42.996632,42.996632,42.996644,42.996499,42.910928,42.910926,42.901702,42.707455,42.4745,42.4745,42.395348,42.392086,42.288838,42.202994,42.127168,42.127156,42.0081011637255,42.008609,42.0093276173603,42.009485,42.0087619451744,42.00838,42.008121,42.007518,42.0055939147516,42.005036,42.004687,42.004211,42.0041828177379,42.004141,42.003945,42.0039200299812,42.0038869183156,42.0038268265009,42.003785,42.0037712404909,42.0035150173241,42.003507,42.003377680638,42.003084,42.00482,42.005064,42.0065873199631,42.00816,42.008761,42.005789,42.0039324384249,42.004931]}]],[[{"lng":[-123.725396,-123.725337,-123.724663,-123.724368,-123.657202,-123.627081,-123.622159,-123.601657,-123.599208,-123.576563,-123.57142,-123.568496,-123.561352,-123.551215,-123.550602,-123.50222,-123.495414,-123.49442,-123.478264,-123.477905,-123.468746,-123.448934,-123.412698,-123.396679,-123.339945,-123.321413,-123.249322,-123.209454,-123.186276,-123.092128,-123.068667,-123.068271,-123.068079,-123.066732,-123.06603,-123.065974,-123.067043,-123.067835,-123.068849,-123.068975,-123.070654,-123.072732,-123.073539,-123.074284,-123.075113,-123.075174,-123.075577,-123.074723,-123.071977,-123.069219,-123.068685,-123.066938,-123.065415,-123.064261,-123.058089,-123.055299,-123.05465,-123.053762,-123.051824,-123.047081,-123.042938,-123.041717,-123.040853,-123.040529,-123.040164,-123.037897,-123.037374,-123.037594,-123.037779,-123.037807,-123.037316,-123.036985,-123.037566,-123.038923,-123.037897,-123.038095,-123.039822,-123.04148,-123.042127,-123.042906,-123.043631,-123.044433,-123.0496,-123.054933,-123.060074,-123.062005,-123.067478,-123.06993,-123.071687,-123.072813,-123.076574,-123.081694,-123.082998,-123.091347,-123.093008,-123.105091,-123.109725,-123.111472,-123.112769,-123.1123,-123.110396,-123.108165,-123.107108,-123.108792,-123.11321,-123.116542,-123.120462,-123.123769,-123.125287,-123.128245,-123.13017,-123.132383,-123.13309,-123.134498,-123.13733,-123.141485,-123.144973,-123.146617,-123.147995,-123.147924,-123.149402,-123.152597,-123.155436,-123.1616,-123.16781,-123.170891,-123.174215,-123.178468,-123.180532,-123.180908,-123.180944,-123.180122,-123.179857,-123.179881,-123.180117,-123.18001,-123.179829,-123.179758,-123.179677,-123.179555,-123.179387,-123.17778,-123.173863,-123.169856,-123.166472,-123.158928,-123.154541,-123.152849,-123.151364,-123.149254,-123.143754,-123.140136,-123.131734,-123.126252,-123.118528,-123.1114,-123.109462,-123.103566,-123.101167,-123.093335,-123.091479,-123.091349,-123.09199,-123.095698,-123.097713,-123.102131,-123.110229,-123.117983,-123.122064,-123.124779,-123.125807,-123.126787,-123.128571,-123.129627,-123.131328,-123.132924,-123.133628,-123.137656,-123.140101,-123.144012,-123.145812,-123.14752,-123.148333,-123.148411,-123.147833,-123.145463,-123.143843,-123.140884,-123.137757,-123.135106,-123.1327,-123.132445,-123.133529,-123.137819,-123.146582,-123.150429,-123.150763,-123.150297,-123.149025,-123.182025,-123.201917,-123.221593,-123.23521,-123.240276,-123.301882,-123.316612,-123.339138,-123.409764,-123.414116,-123.438419,-123.47056,-123.54132,-123.580966,-123.602609,-123.704467,-123.704578,-123.716062,-123.725001,-123.725079,-123.725188,-123.725394,-123.724842,-123.724858,-123.724231,-123.724782,-123.724659,-123.724599,-123.725771,-123.725396],"lat":[45.023601,45.025068,45.044432,45.076226,45.076118,45.076067,45.076056,45.07602,45.076016,45.075976,45.075899,45.075848,45.075733,45.075568,45.075553,45.075115,45.07513,45.075138,45.075175,45.075176,45.0752,45.075293,45.075365,45.075389,45.075495,45.075527,45.075073,45.074982,45.075013,45.074932,45.07486,45.074864,45.074288,45.071438,45.069102,45.068042,45.060738,45.054188,45.046709,45.041493,45.036599,45.033397,45.031314,45.02584,45.021657,45.017489,45.014513,45.012533,45.008897,45.000505,44.998378,44.995005,44.990718,44.989778,44.989368,44.989826,44.989868,44.989928,44.990302,44.991041,44.990026,44.989381,44.98877,44.988502,44.988153,44.984421,44.981139,44.979621,44.977463,44.975841,44.972795,44.967428,44.965581,44.961154,44.958779,44.95657,44.95165,44.948114,44.947098,44.945975,44.94495,44.944231,44.942701,44.940694,44.937885,44.936207,44.932214,44.92905,44.928107,44.927686,44.926914,44.926878,44.927167,44.930297,44.930541,44.93044,44.930863,44.930161,44.928728,44.926012,44.923826,44.92249,44.920337,44.917505,44.914782,44.913242,44.912185,44.910536,44.909273,44.904764,44.90073,44.894683,44.891904,44.889368,44.887259,44.88374,44.877305,44.870722,44.866795,44.863181,44.861254,44.860059,44.860009,44.861579,44.864022,44.864462,44.863534,44.861006,44.858765,44.857553,44.855601,44.851647,44.845611,44.844667,44.841506,44.839568,44.837984,44.837131,44.836601,44.83612,44.835729,44.833332,44.83042,44.829041,44.828733,44.830236,44.830219,44.829536,44.827607,44.826506,44.825398,44.825503,44.826479,44.826079,44.822803,44.821691,44.82098,44.818847,44.817768,44.814044,44.811523,44.80953,44.806642,44.800848,44.799099,44.797542,44.796516,44.794537,44.793774,44.792666,44.791961,44.79117,44.789249,44.787897,44.785587,44.779867,44.778736,44.775272,44.773729,44.771832,44.770231,44.765404,44.760578,44.755137,44.751446,44.749516,44.748914,44.747632,44.747062,44.745741,44.743363,44.741157,44.738662,44.736145,44.731585,44.727611,44.72578,44.722689,44.720225,44.720085,44.720099,44.720125,44.720146,44.719914,44.719835,44.719994,44.720059,44.720531,44.720552,44.720622,44.720722,44.72127,44.719415,44.721154,44.721154,44.73898,44.739018,44.739046,44.753939,44.764328,44.88599,44.911745,44.94753,44.955493,44.962958,44.984273,45.00076,45.000746,45.023601]}]],[[{"lng":[-124.462619,-124.455669,-124.448625230642,-124.446875,-124.436198,-124.434655,-124.436655,-124.434312105988,-124.434213,-124.433542433297,-124.432236,-124.435157,-124.433357,-124.433641,-124.434527236125,-124.43785,-124.437373631068,-124.434451,-124.434419666916,-124.429253343926,-124.427595577081,-124.425024028606,-124.424113,-124.401726,-124.395302,-124.395338287504,-124.397382,-124.395607,-124.38246,-124.384117648066,-124.38708,-124.388891,-124.393988,-124.395536,-124.400404,-124.402814,-124.394143,-124.38972,-124.387642,-124.385296,-124.384603,-124.376997,-124.373037,-124.353332,-124.343247,-124.330671,-124.315012,-124.286896,-124.279473391428,-124.2782229273,-124.255609,-124.232025,-124.231975100174,-124.218966377223,-124.183435,-124.180894,-124.146347,-124.100765,-124.062969,-123.979004,-123.949565,-123.949573,-123.875698,-123.875628,-123.816657,-123.817154,-123.817614,-123.769016,-123.764884,-123.761528,-123.762801,-123.761983,-123.762289,-123.764496,-123.763917,-123.764339,-123.764356,-123.704752,-123.704456,-123.703862,-123.703568,-123.703417,-123.703655,-123.702167,-123.702131,-123.702139,-123.702144,-123.707059,-123.707057,-123.761333,-123.761384,-123.761594,-123.821118,-123.821121,-123.821513,-123.820515,-123.819496,-123.81915,-123.819144,-123.820439,-123.811789,-123.811553,-123.849858,-123.84989,-123.868282,-123.868491,-123.925717,-123.925942,-123.937268,-123.937288,-123.957026,-123.956985,-123.976631,-123.976677,-123.996296,-123.996291,-124.070314,-124.089872,-124.089872,-124.1192,-124.119228,-124.128073,-124.128049,-124.132918,-124.132926,-124.138748,-124.138686,-124.138655,-124.159966,-124.159895,-124.160163,-124.164887,-124.164225,-124.164889,-124.160149,-124.160658,-124.141185,-124.141475,-124.146344,-124.146377,-124.151235,-124.151209,-124.156491,-124.156629,-124.162074,-124.161288,-124.160976,-124.161308,-124.180704,-124.180706,-124.18531,-124.185291,-124.189907,-124.189984,-124.199692,-124.199717,-124.204529,-124.204851,-124.214201,-124.214393,-124.209522,-124.209708,-124.219416,-124.219623,-124.239394,-124.239129,-124.24387,-124.243779,-124.253317,-124.253467,-124.258274,-124.258388,-124.269254,-124.296347,-124.41539,-124.415423,-124.434245,-124.438676,-124.479636362958,-124.462619],"lat":[42.99143,43.008349,43.0271390597407,43.031808,43.071312,43.081469,43.085816,43.0895749921129,43.089734,43.0923284181646,43.097383,43.104678,43.108563,43.111397,43.111948449848,43.114016,43.114292094968,43.115986,43.1160189545965,43.1214526390494,43.123196196692,43.1259008249145,43.126859,43.184896,43.211101,43.2112497264283,43.219626,43.223908,43.270167,43.2727944798235,43.27749,43.290523,43.29926,43.30224,43.302121,43.305872,43.315651,43.323216,43.325968,43.32773,43.332848,43.334231,43.338953,43.342667,43.351517,43.366559,43.388389,43.436296,43.4519245921396,43.454557493182,43.502172,43.562393,43.5625784778939,43.6109319633736,43.610925,43.611445,43.611216,43.611244,43.609641,43.609363,43.609265,43.608472,43.608407,43.515947,43.516449,43.459594,43.431306,43.431695,43.431548,43.422294,43.387997,43.358748,43.351419,43.344799,43.287099,43.2636,43.258054,43.257741,43.243253,43.214139,43.186134,43.177696,43.170579,43.17059,43.113946,43.112458,43.087083,43.087067,43.083457,43.08316,43.054511,42.996318,42.996291,42.965284,42.924483,42.909675,42.909661,42.885135,42.884356,42.824112,42.824101,42.788837,42.788994,42.781821,42.781921,42.77484,42.774514,42.73971,42.739666,42.729097,42.729051,42.714569,42.714558,42.700118,42.7001,42.685651,42.685327,42.685454,42.678208,42.678339,42.671129,42.671123,42.666684,42.666697,42.671119,42.671115,42.729928,42.739956,42.739947,42.768326,42.790087,42.790006,42.804038,42.817825,42.817761,42.828288,42.828475,42.850586,42.850511,42.862081,42.862067,42.86581,42.8658,42.869642,42.86973,42.874824,42.876642,42.883499,42.88245,42.885998,42.885919,42.893047,42.893032,42.896696,42.896656,42.900275,42.900327,42.90391,42.904006,42.911141,42.911125,42.918227,42.918156,42.933782,42.933751,42.940948,42.940652,42.9443,42.943809,42.951314,42.951152,42.954946,42.954877,42.954621,42.955232,42.953769,42.95369,42.953817,42.9543325389089,42.99143]}]]],["X1","X2","X3","X4","X5","X6","X7","X8","X9","X10","X11","X12","X13","X14","X15","X16","X17","X18","X19","X20","X21","X22","X23","X24","X25","X26","X27","X28","X29","X30","X31","X32","X33","X34","X35","X36"],"cnty",{"interactive":true,"className":"","pane":"tmap401","stroke":true,"color":["#404040","#404040","#404040","#404040","#404040","#404040","#404040","#404040","#404040","#404040","#404040","#404040","#404040","#404040","#404040","#404040","#404040","#404040","#404040","#404040","#404040","#404040","#404040","#404040","#404040","#404040","#404040","#404040","#404040","#404040","#404040","#404040","#404040","#404040","#404040","#404040"],"weight":[1,1,1,1,1,1,1,1,1,1,1,1,1,1,1,1,1,1,1,1,1,1,1,1,1,1,1,1,1,1,1,1,1,1,1,1],"opacity":[1,1,1,1,1,1,1,1,1,1,1,1,1,1,1,1,1,1,1,1,1,1,1,1,1,1,1,1,1,1,1,1,1,1,1,1],"fill":true,"fillColor":["#E5F1FF","#E5F1FF","#E5F1FF","#E5F1FF","#E5F1FF","#92BAEC","#E5F1FF","#5A99D6","#92BAEC","#E5F1FF","#E5F1FF","#E5F1FF","#E5F1FF","#E5F1FF","#004C85","#E5F1FF","#E5F1FF","#E5F1FF","#E5F1FF","#E5F1FF","#E5F1FF","#C0D9FB","#0174B7","#E5F1FF","#E5F1FF","#E5F1FF","#E5F1FF","#E5F1FF","#E5F1FF","#E5F1FF","#E5F1FF","#E5F1FF","#E5F1FF","#C0D9FB","#E5F1FF","#E5F1FF"],"fillOpacity":[1,1,1,1,1,1,1,1,1,1,1,1,1,1,1,1,1,1,1,1,1,1,1,1,1,1,1,1,1,1,1,1,1,1,1,1],"dashArray":["","","","","","","","","","","","","","","","","","","","","","","","","","","","","","","","","","","",""],"smoothFactor":1,"noClip":false},["<style> div.leaflet-popup-content {width:auto !important;overflow-y:auto; overflow-x:hidden;}<\/style><div style=\"max-height:25em;padding-right:0px;\"><table>\n\t\t\t <thead><tr><th colspan=\"2\"><\/th><\/thead><\/tr><tr><td style=\"color: #888888;\"><nobr>GEOID<\/nobr><\/td><td align=\"right\"><nobr>41033<\/nobr><\/td><\/tr><tr><td style=\"color: #888888;\"><nobr>NAME<\/nobr><\/td><td align=\"right\"><nobr>Josephine County, Oregon<\/nobr><\/td><\/tr><tr><td style=\"color: #888888;\"><nobr>variable<\/nobr><\/td><td align=\"right\"><nobr>ed_attain<\/nobr><\/td><\/tr><tr><td style=\"color: #888888;\"><nobr>estimate<\/nobr><\/td><td align=\"right\"><nobr>65,703<\/nobr><\/td><\/tr><tr><td style=\"color: #888888;\"><nobr>moe<\/nobr><\/td><td align=\"right\"><nobr>186.0<\/nobr><\/td><\/tr><\/table><\/div>","<style> div.leaflet-popup-content {width:auto !important;overflow-y:auto; overflow-x:hidden;}<\/style><div style=\"max-height:25em;padding-right:0px;\"><table>\n\t\t\t <thead><tr><th colspan=\"2\"><\/th><\/thead><\/tr><tr><td style=\"color: #888888;\"><nobr>GEOID<\/nobr><\/td><td align=\"right\"><nobr>41045<\/nobr><\/td><\/tr><tr><td style=\"color: #888888;\"><nobr>NAME<\/nobr><\/td><td align=\"right\"><nobr>Malheur County, Oregon<\/nobr><\/td><\/tr><tr><td style=\"color: #888888;\"><nobr>variable<\/nobr><\/td><td align=\"right\"><nobr>ed_attain<\/nobr><\/td><\/tr><tr><td style=\"color: #888888;\"><nobr>estimate<\/nobr><\/td><td align=\"right\"><nobr>20,497<\/nobr><\/td><\/tr><tr><td style=\"color: #888888;\"><nobr>moe<\/nobr><\/td><td align=\"right\"><nobr>127.0<\/nobr><\/td><\/tr><\/table><\/div>","<style> div.leaflet-popup-content {width:auto !important;overflow-y:auto; overflow-x:hidden;}<\/style><div style=\"max-height:25em;padding-right:0px;\"><table>\n\t\t\t <thead><tr><th colspan=\"2\"><\/th><\/thead><\/tr><tr><td style=\"color: #888888;\"><nobr>GEOID<\/nobr><\/td><td align=\"right\"><nobr>41001<\/nobr><\/td><\/tr><tr><td style=\"color: #888888;\"><nobr>NAME<\/nobr><\/td><td align=\"right\"><nobr>Baker County, Oregon<\/nobr><\/td><\/tr><tr><td style=\"color: #888888;\"><nobr>variable<\/nobr><\/td><td align=\"right\"><nobr>ed_attain<\/nobr><\/td><\/tr><tr><td style=\"color: #888888;\"><nobr>estimate<\/nobr><\/td><td align=\"right\"><nobr>12,415<\/nobr><\/td><\/tr><tr><td style=\"color: #888888;\"><nobr>moe<\/nobr><\/td><td align=\"right\"><nobr>104.0<\/nobr><\/td><\/tr><\/table><\/div>","<style> div.leaflet-popup-content {width:auto !important;overflow-y:auto; overflow-x:hidden;}<\/style><div style=\"max-height:25em;padding-right:0px;\"><table>\n\t\t\t <thead><tr><th colspan=\"2\"><\/th><\/thead><\/tr><tr><td style=\"color: #888888;\"><nobr>GEOID<\/nobr><\/td><td align=\"right\"><nobr>41021<\/nobr><\/td><\/tr><tr><td style=\"color: #888888;\"><nobr>NAME<\/nobr><\/td><td align=\"right\"><nobr>Gilliam County, Oregon<\/nobr><\/td><\/tr><tr><td style=\"color: #888888;\"><nobr>variable<\/nobr><\/td><td align=\"right\"><nobr>ed_attain<\/nobr><\/td><\/tr><tr><td style=\"color: #888888;\"><nobr>estimate<\/nobr><\/td><td align=\"right\"><nobr>1,477<\/nobr><\/td><\/tr><tr><td style=\"color: #888888;\"><nobr>moe<\/nobr><\/td><td align=\"right\"><nobr>68.0<\/nobr><\/td><\/tr><\/table><\/div>","<style> div.leaflet-popup-content {width:auto !important;overflow-y:auto; overflow-x:hidden;}<\/style><div style=\"max-height:25em;padding-right:0px;\"><table>\n\t\t\t <thead><tr><th colspan=\"2\"><\/th><\/thead><\/tr><tr><td style=\"color: #888888;\"><nobr>GEOID<\/nobr><\/td><td align=\"right\"><nobr>41015<\/nobr><\/td><\/tr><tr><td style=\"color: #888888;\"><nobr>NAME<\/nobr><\/td><td align=\"right\"><nobr>Curry County, Oregon<\/nobr><\/td><\/tr><tr><td style=\"color: #888888;\"><nobr>variable<\/nobr><\/td><td align=\"right\"><nobr>ed_attain<\/nobr><\/td><\/tr><tr><td style=\"color: #888888;\"><nobr>estimate<\/nobr><\/td><td align=\"right\"><nobr>19,116<\/nobr><\/td><\/tr><tr><td style=\"color: #888888;\"><nobr>moe<\/nobr><\/td><td align=\"right\"><nobr>120.0<\/nobr><\/td><\/tr><\/table><\/div>","<style> div.leaflet-popup-content {width:auto !important;overflow-y:auto; overflow-x:hidden;}<\/style><div style=\"max-height:25em;padding-right:0px;\"><table>\n\t\t\t <thead><tr><th colspan=\"2\"><\/th><\/thead><\/tr><tr><td style=\"color: #888888;\"><nobr>GEOID<\/nobr><\/td><td align=\"right\"><nobr>41039<\/nobr><\/td><\/tr><tr><td style=\"color: #888888;\"><nobr>NAME<\/nobr><\/td><td align=\"right\"><nobr>Lane County, Oregon<\/nobr><\/td><\/tr><tr><td style=\"color: #888888;\"><nobr>variable<\/nobr><\/td><td align=\"right\"><nobr>ed_attain<\/nobr><\/td><\/tr><tr><td style=\"color: #888888;\"><nobr>estimate<\/nobr><\/td><td align=\"right\"><nobr>264,813<\/nobr><\/td><\/tr><tr><td style=\"color: #888888;\"><nobr>moe<\/nobr><\/td><td align=\"right\"><nobr>66.0<\/nobr><\/td><\/tr><\/table><\/div>","<style> div.leaflet-popup-content {width:auto !important;overflow-y:auto; overflow-x:hidden;}<\/style><div style=\"max-height:25em;padding-right:0px;\"><table>\n\t\t\t <thead><tr><th colspan=\"2\"><\/th><\/thead><\/tr><tr><td style=\"color: #888888;\"><nobr>GEOID<\/nobr><\/td><td align=\"right\"><nobr>41025<\/nobr><\/td><\/tr><tr><td style=\"color: #888888;\"><nobr>NAME<\/nobr><\/td><td align=\"right\"><nobr>Harney County, Oregon<\/nobr><\/td><\/tr><tr><td style=\"color: #888888;\"><nobr>variable<\/nobr><\/td><td align=\"right\"><nobr>ed_attain<\/nobr><\/td><\/tr><tr><td style=\"color: #888888;\"><nobr>estimate<\/nobr><\/td><td align=\"right\"><nobr>5,499<\/nobr><\/td><\/tr><tr><td style=\"color: #888888;\"><nobr>moe<\/nobr><\/td><td align=\"right\"><nobr>89.0<\/nobr><\/td><\/tr><\/table><\/div>","<style> div.leaflet-popup-content {width:auto !important;overflow-y:auto; overflow-x:hidden;}<\/style><div style=\"max-height:25em;padding-right:0px;\"><table>\n\t\t\t <thead><tr><th colspan=\"2\"><\/th><\/thead><\/tr><tr><td style=\"color: #888888;\"><nobr>GEOID<\/nobr><\/td><td align=\"right\"><nobr>41005<\/nobr><\/td><\/tr><tr><td style=\"color: #888888;\"><nobr>NAME<\/nobr><\/td><td align=\"right\"><nobr>Clackamas County, Oregon<\/nobr><\/td><\/tr><tr><td style=\"color: #888888;\"><nobr>variable<\/nobr><\/td><td align=\"right\"><nobr>ed_attain<\/nobr><\/td><\/tr><tr><td style=\"color: #888888;\"><nobr>estimate<\/nobr><\/td><td align=\"right\"><nobr>300,373<\/nobr><\/td><\/tr><tr><td style=\"color: #888888;\"><nobr>moe<\/nobr><\/td><td align=\"right\"><nobr>58.0<\/nobr><\/td><\/tr><\/table><\/div>","<style> div.leaflet-popup-content {width:auto !important;overflow-y:auto; overflow-x:hidden;}<\/style><div style=\"max-height:25em;padding-right:0px;\"><table>\n\t\t\t <thead><tr><th colspan=\"2\"><\/th><\/thead><\/tr><tr><td style=\"color: #888888;\"><nobr>GEOID<\/nobr><\/td><td align=\"right\"><nobr>41047<\/nobr><\/td><\/tr><tr><td style=\"color: #888888;\"><nobr>NAME<\/nobr><\/td><td align=\"right\"><nobr>Marion County, Oregon<\/nobr><\/td><\/tr><tr><td style=\"color: #888888;\"><nobr>variable<\/nobr><\/td><td align=\"right\"><nobr>ed_attain<\/nobr><\/td><\/tr><tr><td style=\"color: #888888;\"><nobr>estimate<\/nobr><\/td><td align=\"right\"><nobr>230,076<\/nobr><\/td><\/tr><tr><td style=\"color: #888888;\"><nobr>moe<\/nobr><\/td><td align=\"right\"><nobr>209.0<\/nobr><\/td><\/tr><\/table><\/div>","<style> div.leaflet-popup-content {width:auto !important;overflow-y:auto; overflow-x:hidden;}<\/style><div style=\"max-height:25em;padding-right:0px;\"><table>\n\t\t\t <thead><tr><th colspan=\"2\"><\/th><\/thead><\/tr><tr><td style=\"color: #888888;\"><nobr>GEOID<\/nobr><\/td><td align=\"right\"><nobr>41031<\/nobr><\/td><\/tr><tr><td style=\"color: #888888;\"><nobr>NAME<\/nobr><\/td><td align=\"right\"><nobr>Jefferson County, Oregon<\/nobr><\/td><\/tr><tr><td style=\"color: #888888;\"><nobr>variable<\/nobr><\/td><td align=\"right\"><nobr>ed_attain<\/nobr><\/td><\/tr><tr><td style=\"color: #888888;\"><nobr>estimate<\/nobr><\/td><td align=\"right\"><nobr>17,060<\/nobr><\/td><\/tr><tr><td style=\"color: #888888;\"><nobr>moe<\/nobr><\/td><td align=\"right\"><nobr>76.0<\/nobr><\/td><\/tr><\/table><\/div>","<style> div.leaflet-popup-content {width:auto !important;overflow-y:auto; overflow-x:hidden;}<\/style><div style=\"max-height:25em;padding-right:0px;\"><table>\n\t\t\t <thead><tr><th colspan=\"2\"><\/th><\/thead><\/tr><tr><td style=\"color: #888888;\"><nobr>GEOID<\/nobr><\/td><td align=\"right\"><nobr>41035<\/nobr><\/td><\/tr><tr><td style=\"color: #888888;\"><nobr>NAME<\/nobr><\/td><td align=\"right\"><nobr>Klamath County, Oregon<\/nobr><\/td><\/tr><tr><td style=\"color: #888888;\"><nobr>variable<\/nobr><\/td><td align=\"right\"><nobr>ed_attain<\/nobr><\/td><\/tr><tr><td style=\"color: #888888;\"><nobr>estimate<\/nobr><\/td><td align=\"right\"><nobr>48,771<\/nobr><\/td><\/tr><tr><td style=\"color: #888888;\"><nobr>moe<\/nobr><\/td><td align=\"right\"><nobr>140.0<\/nobr><\/td><\/tr><\/table><\/div>","<style> div.leaflet-popup-content {width:auto !important;overflow-y:auto; overflow-x:hidden;}<\/style><div style=\"max-height:25em;padding-right:0px;\"><table>\n\t\t\t <thead><tr><th colspan=\"2\"><\/th><\/thead><\/tr><tr><td style=\"color: #888888;\"><nobr>GEOID<\/nobr><\/td><td align=\"right\"><nobr>41013<\/nobr><\/td><\/tr><tr><td style=\"color: #888888;\"><nobr>NAME<\/nobr><\/td><td align=\"right\"><nobr>Crook County, Oregon<\/nobr><\/td><\/tr><tr><td style=\"color: #888888;\"><nobr>variable<\/nobr><\/td><td align=\"right\"><nobr>ed_attain<\/nobr><\/td><\/tr><tr><td style=\"color: #888888;\"><nobr>estimate<\/nobr><\/td><td align=\"right\"><nobr>18,626<\/nobr><\/td><\/tr><tr><td style=\"color: #888888;\"><nobr>moe<\/nobr><\/td><td align=\"right\"><nobr>171.0<\/nobr><\/td><\/tr><\/table><\/div>","<style> div.leaflet-popup-content {width:auto !important;overflow-y:auto; overflow-x:hidden;}<\/style><div style=\"max-height:25em;padding-right:0px;\"><table>\n\t\t\t <thead><tr><th colspan=\"2\"><\/th><\/thead><\/tr><tr><td style=\"color: #888888;\"><nobr>GEOID<\/nobr><\/td><td align=\"right\"><nobr>41061<\/nobr><\/td><\/tr><tr><td style=\"color: #888888;\"><nobr>NAME<\/nobr><\/td><td align=\"right\"><nobr>Union County, Oregon<\/nobr><\/td><\/tr><tr><td style=\"color: #888888;\"><nobr>variable<\/nobr><\/td><td align=\"right\"><nobr>ed_attain<\/nobr><\/td><\/tr><tr><td style=\"color: #888888;\"><nobr>estimate<\/nobr><\/td><td align=\"right\"><nobr>17,596<\/nobr><\/td><\/tr><tr><td style=\"color: #888888;\"><nobr>moe<\/nobr><\/td><td align=\"right\"><nobr>60.0<\/nobr><\/td><\/tr><\/table><\/div>","<style> div.leaflet-popup-content {width:auto !important;overflow-y:auto; overflow-x:hidden;}<\/style><div style=\"max-height:25em;padding-right:0px;\"><table>\n\t\t\t <thead><tr><th colspan=\"2\"><\/th><\/thead><\/tr><tr><td style=\"color: #888888;\"><nobr>GEOID<\/nobr><\/td><td align=\"right\"><nobr>41019<\/nobr><\/td><\/tr><tr><td style=\"color: #888888;\"><nobr>NAME<\/nobr><\/td><td align=\"right\"><nobr>Douglas County, Oregon<\/nobr><\/td><\/tr><tr><td style=\"color: #888888;\"><nobr>variable<\/nobr><\/td><td align=\"right\"><nobr>ed_attain<\/nobr><\/td><\/tr><tr><td style=\"color: #888888;\"><nobr>estimate<\/nobr><\/td><td align=\"right\"><nobr>82,360<\/nobr><\/td><\/tr><tr><td style=\"color: #888888;\"><nobr>moe<\/nobr><\/td><td align=\"right\"><nobr>82.0<\/nobr><\/td><\/tr><\/table><\/div>","<style> div.leaflet-popup-content {width:auto !important;overflow-y:auto; overflow-x:hidden;}<\/style><div style=\"max-height:25em;padding-right:0px;\"><table>\n\t\t\t <thead><tr><th colspan=\"2\"><\/th><\/thead><\/tr><tr><td style=\"color: #888888;\"><nobr>GEOID<\/nobr><\/td><td align=\"right\"><nobr>41051<\/nobr><\/td><\/tr><tr><td style=\"color: #888888;\"><nobr>NAME<\/nobr><\/td><td align=\"right\"><nobr>Multnomah County, Oregon<\/nobr><\/td><\/tr><tr><td style=\"color: #888888;\"><nobr>variable<\/nobr><\/td><td align=\"right\"><nobr>ed_attain<\/nobr><\/td><\/tr><tr><td style=\"color: #888888;\"><nobr>estimate<\/nobr><\/td><td align=\"right\"><nobr>598,188<\/nobr><\/td><\/tr><tr><td style=\"color: #888888;\"><nobr>moe<\/nobr><\/td><td align=\"right\"><nobr>NA<\/nobr><\/td><\/tr><\/table><\/div>","<style> div.leaflet-popup-content {width:auto !important;overflow-y:auto; overflow-x:hidden;}<\/style><div style=\"max-height:25em;padding-right:0px;\"><table>\n\t\t\t <thead><tr><th colspan=\"2\"><\/th><\/thead><\/tr><tr><td style=\"color: #888888;\"><nobr>GEOID<\/nobr><\/td><td align=\"right\"><nobr>41023<\/nobr><\/td><\/tr><tr><td style=\"color: #888888;\"><nobr>NAME<\/nobr><\/td><td align=\"right\"><nobr>Grant County, Oregon<\/nobr><\/td><\/tr><tr><td style=\"color: #888888;\"><nobr>variable<\/nobr><\/td><td align=\"right\"><nobr>ed_attain<\/nobr><\/td><\/tr><tr><td style=\"color: #888888;\"><nobr>estimate<\/nobr><\/td><td align=\"right\"><nobr>5,609<\/nobr><\/td><\/tr><tr><td style=\"color: #888888;\"><nobr>moe<\/nobr><\/td><td align=\"right\"><nobr>52.0<\/nobr><\/td><\/tr><\/table><\/div>","<style> div.leaflet-popup-content {width:auto !important;overflow-y:auto; overflow-x:hidden;}<\/style><div style=\"max-height:25em;padding-right:0px;\"><table>\n\t\t\t <thead><tr><th colspan=\"2\"><\/th><\/thead><\/tr><tr><td style=\"color: #888888;\"><nobr>GEOID<\/nobr><\/td><td align=\"right\"><nobr>41003<\/nobr><\/td><\/tr><tr><td style=\"color: #888888;\"><nobr>NAME<\/nobr><\/td><td align=\"right\"><nobr>Benton County, Oregon<\/nobr><\/td><\/tr><tr><td style=\"color: #888888;\"><nobr>variable<\/nobr><\/td><td align=\"right\"><nobr>ed_attain<\/nobr><\/td><\/tr><tr><td style=\"color: #888888;\"><nobr>estimate<\/nobr><\/td><td align=\"right\"><nobr>58,369<\/nobr><\/td><\/tr><tr><td style=\"color: #888888;\"><nobr>moe<\/nobr><\/td><td align=\"right\"><nobr>183.0<\/nobr><\/td><\/tr><\/table><\/div>","<style> div.leaflet-popup-content {width:auto !important;overflow-y:auto; overflow-x:hidden;}<\/style><div style=\"max-height:25em;padding-right:0px;\"><table>\n\t\t\t <thead><tr><th colspan=\"2\"><\/th><\/thead><\/tr><tr><td style=\"color: #888888;\"><nobr>GEOID<\/nobr><\/td><td align=\"right\"><nobr>41055<\/nobr><\/td><\/tr><tr><td style=\"color: #888888;\"><nobr>NAME<\/nobr><\/td><td align=\"right\"><nobr>Sherman County, Oregon<\/nobr><\/td><\/tr><tr><td style=\"color: #888888;\"><nobr>variable<\/nobr><\/td><td align=\"right\"><nobr>ed_attain<\/nobr><\/td><\/tr><tr><td style=\"color: #888888;\"><nobr>estimate<\/nobr><\/td><td align=\"right\"><nobr>1,368<\/nobr><\/td><\/tr><tr><td style=\"color: #888888;\"><nobr>moe<\/nobr><\/td><td align=\"right\"><nobr>98.0<\/nobr><\/td><\/tr><\/table><\/div>","<style> div.leaflet-popup-content {width:auto !important;overflow-y:auto; overflow-x:hidden;}<\/style><div style=\"max-height:25em;padding-right:0px;\"><table>\n\t\t\t <thead><tr><th colspan=\"2\"><\/th><\/thead><\/tr><tr><td style=\"color: #888888;\"><nobr>GEOID<\/nobr><\/td><td align=\"right\"><nobr>41043<\/nobr><\/td><\/tr><tr><td style=\"color: #888888;\"><nobr>NAME<\/nobr><\/td><td align=\"right\"><nobr>Linn County, Oregon<\/nobr><\/td><\/tr><tr><td style=\"color: #888888;\"><nobr>variable<\/nobr><\/td><td align=\"right\"><nobr>ed_attain<\/nobr><\/td><\/tr><tr><td style=\"color: #888888;\"><nobr>estimate<\/nobr><\/td><td align=\"right\"><nobr>89,890<\/nobr><\/td><\/tr><tr><td style=\"color: #888888;\"><nobr>moe<\/nobr><\/td><td align=\"right\"><nobr>128.0<\/nobr><\/td><\/tr><\/table><\/div>","<style> div.leaflet-popup-content {width:auto !important;overflow-y:auto; overflow-x:hidden;}<\/style><div style=\"max-height:25em;padding-right:0px;\"><table>\n\t\t\t <thead><tr><th colspan=\"2\"><\/th><\/thead><\/tr><tr><td style=\"color: #888888;\"><nobr>GEOID<\/nobr><\/td><td align=\"right\"><nobr>41007<\/nobr><\/td><\/tr><tr><td style=\"color: #888888;\"><nobr>NAME<\/nobr><\/td><td align=\"right\"><nobr>Clatsop County, Oregon<\/nobr><\/td><\/tr><tr><td style=\"color: #888888;\"><nobr>variable<\/nobr><\/td><td align=\"right\"><nobr>ed_attain<\/nobr><\/td><\/tr><tr><td style=\"color: #888888;\"><nobr>estimate<\/nobr><\/td><td align=\"right\"><nobr>30,595<\/nobr><\/td><\/tr><tr><td style=\"color: #888888;\"><nobr>moe<\/nobr><\/td><td align=\"right\"><nobr>234.0<\/nobr><\/td><\/tr><\/table><\/div>","<style> div.leaflet-popup-content {width:auto !important;overflow-y:auto; overflow-x:hidden;}<\/style><div style=\"max-height:25em;padding-right:0px;\"><table>\n\t\t\t <thead><tr><th colspan=\"2\"><\/th><\/thead><\/tr><tr><td style=\"color: #888888;\"><nobr>GEOID<\/nobr><\/td><td align=\"right\"><nobr>41065<\/nobr><\/td><\/tr><tr><td style=\"color: #888888;\"><nobr>NAME<\/nobr><\/td><td align=\"right\"><nobr>Wasco County, Oregon<\/nobr><\/td><\/tr><tr><td style=\"color: #888888;\"><nobr>variable<\/nobr><\/td><td align=\"right\"><nobr>ed_attain<\/nobr><\/td><\/tr><tr><td style=\"color: #888888;\"><nobr>estimate<\/nobr><\/td><td align=\"right\"><nobr>18,770<\/nobr><\/td><\/tr><tr><td style=\"color: #888888;\"><nobr>moe<\/nobr><\/td><td align=\"right\"><nobr>169.0<\/nobr><\/td><\/tr><\/table><\/div>","<style> div.leaflet-popup-content {width:auto !important;overflow-y:auto; overflow-x:hidden;}<\/style><div style=\"max-height:25em;padding-right:0px;\"><table>\n\t\t\t <thead><tr><th colspan=\"2\"><\/th><\/thead><\/tr><tr><td style=\"color: #888888;\"><nobr>GEOID<\/nobr><\/td><td align=\"right\"><nobr>41017<\/nobr><\/td><\/tr><tr><td style=\"color: #888888;\"><nobr>NAME<\/nobr><\/td><td align=\"right\"><nobr>Deschutes County, Oregon<\/nobr><\/td><\/tr><tr><td style=\"color: #888888;\"><nobr>variable<\/nobr><\/td><td align=\"right\"><nobr>ed_attain<\/nobr><\/td><\/tr><tr><td style=\"color: #888888;\"><nobr>estimate<\/nobr><\/td><td align=\"right\"><nobr>147,063<\/nobr><\/td><\/tr><tr><td style=\"color: #888888;\"><nobr>moe<\/nobr><\/td><td align=\"right\"><nobr>295.0<\/nobr><\/td><\/tr><\/table><\/div>","<style> div.leaflet-popup-content {width:auto !important;overflow-y:auto; overflow-x:hidden;}<\/style><div style=\"max-height:25em;padding-right:0px;\"><table>\n\t\t\t <thead><tr><th colspan=\"2\"><\/th><\/thead><\/tr><tr><td style=\"color: #888888;\"><nobr>GEOID<\/nobr><\/td><td align=\"right\"><nobr>41067<\/nobr><\/td><\/tr><tr><td style=\"color: #888888;\"><nobr>NAME<\/nobr><\/td><td align=\"right\"><nobr>Washington County, Oregon<\/nobr><\/td><\/tr><tr><td style=\"color: #888888;\"><nobr>variable<\/nobr><\/td><td align=\"right\"><nobr>ed_attain<\/nobr><\/td><\/tr><tr><td style=\"color: #888888;\"><nobr>estimate<\/nobr><\/td><td align=\"right\"><nobr>417,204<\/nobr><\/td><\/tr><tr><td style=\"color: #888888;\"><nobr>moe<\/nobr><\/td><td align=\"right\"><nobr>123.0<\/nobr><\/td><\/tr><\/table><\/div>","<style> div.leaflet-popup-content {width:auto !important;overflow-y:auto; overflow-x:hidden;}<\/style><div style=\"max-height:25em;padding-right:0px;\"><table>\n\t\t\t <thead><tr><th colspan=\"2\"><\/th><\/thead><\/tr><tr><td style=\"color: #888888;\"><nobr>GEOID<\/nobr><\/td><td align=\"right\"><nobr>41071<\/nobr><\/td><\/tr><tr><td style=\"color: #888888;\"><nobr>NAME<\/nobr><\/td><td align=\"right\"><nobr>Yamhill County, Oregon<\/nobr><\/td><\/tr><tr><td style=\"color: #888888;\"><nobr>variable<\/nobr><\/td><td align=\"right\"><nobr>ed_attain<\/nobr><\/td><\/tr><tr><td style=\"color: #888888;\"><nobr>estimate<\/nobr><\/td><td align=\"right\"><nobr>73,347<\/nobr><\/td><\/tr><tr><td style=\"color: #888888;\"><nobr>moe<\/nobr><\/td><td align=\"right\"><nobr>272.0<\/nobr><\/td><\/tr><\/table><\/div>","<style> div.leaflet-popup-content {width:auto !important;overflow-y:auto; overflow-x:hidden;}<\/style><div style=\"max-height:25em;padding-right:0px;\"><table>\n\t\t\t <thead><tr><th colspan=\"2\"><\/th><\/thead><\/tr><tr><td style=\"color: #888888;\"><nobr>GEOID<\/nobr><\/td><td align=\"right\"><nobr>41063<\/nobr><\/td><\/tr><tr><td style=\"color: #888888;\"><nobr>NAME<\/nobr><\/td><td align=\"right\"><nobr>Wallowa County, Oregon<\/nobr><\/td><\/tr><tr><td style=\"color: #888888;\"><nobr>variable<\/nobr><\/td><td align=\"right\"><nobr>ed_attain<\/nobr><\/td><\/tr><tr><td style=\"color: #888888;\"><nobr>estimate<\/nobr><\/td><td align=\"right\"><nobr>5,608<\/nobr><\/td><\/tr><tr><td style=\"color: #888888;\"><nobr>moe<\/nobr><\/td><td align=\"right\"><nobr>60.0<\/nobr><\/td><\/tr><\/table><\/div>","<style> div.leaflet-popup-content {width:auto !important;overflow-y:auto; overflow-x:hidden;}<\/style><div style=\"max-height:25em;padding-right:0px;\"><table>\n\t\t\t <thead><tr><th colspan=\"2\"><\/th><\/thead><\/tr><tr><td style=\"color: #888888;\"><nobr>GEOID<\/nobr><\/td><td align=\"right\"><nobr>41049<\/nobr><\/td><\/tr><tr><td style=\"color: #888888;\"><nobr>NAME<\/nobr><\/td><td align=\"right\"><nobr>Morrow County, Oregon<\/nobr><\/td><\/tr><tr><td style=\"color: #888888;\"><nobr>variable<\/nobr><\/td><td align=\"right\"><nobr>ed_attain<\/nobr><\/td><\/tr><tr><td style=\"color: #888888;\"><nobr>estimate<\/nobr><\/td><td align=\"right\"><nobr>7,712<\/nobr><\/td><\/tr><tr><td style=\"color: #888888;\"><nobr>moe<\/nobr><\/td><td align=\"right\"><nobr>45.0<\/nobr><\/td><\/tr><\/table><\/div>","<style> div.leaflet-popup-content {width:auto !important;overflow-y:auto; overflow-x:hidden;}<\/style><div style=\"max-height:25em;padding-right:0px;\"><table>\n\t\t\t <thead><tr><th colspan=\"2\"><\/th><\/thead><\/tr><tr><td style=\"color: #888888;\"><nobr>GEOID<\/nobr><\/td><td align=\"right\"><nobr>41037<\/nobr><\/td><\/tr><tr><td style=\"color: #888888;\"><nobr>NAME<\/nobr><\/td><td align=\"right\"><nobr>Lake County, Oregon<\/nobr><\/td><\/tr><tr><td style=\"color: #888888;\"><nobr>variable<\/nobr><\/td><td align=\"right\"><nobr>ed_attain<\/nobr><\/td><\/tr><tr><td style=\"color: #888888;\"><nobr>estimate<\/nobr><\/td><td align=\"right\"><nobr>6,130<\/nobr><\/td><\/tr><tr><td style=\"color: #888888;\"><nobr>moe<\/nobr><\/td><td align=\"right\"><nobr>108.0<\/nobr><\/td><\/tr><\/table><\/div>","<style> div.leaflet-popup-content {width:auto !important;overflow-y:auto; overflow-x:hidden;}<\/style><div style=\"max-height:25em;padding-right:0px;\"><table>\n\t\t\t <thead><tr><th colspan=\"2\"><\/th><\/thead><\/tr><tr><td style=\"color: #888888;\"><nobr>GEOID<\/nobr><\/td><td align=\"right\"><nobr>41057<\/nobr><\/td><\/tr><tr><td style=\"color: #888888;\"><nobr>NAME<\/nobr><\/td><td align=\"right\"><nobr>Tillamook County, Oregon<\/nobr><\/td><\/tr><tr><td style=\"color: #888888;\"><nobr>variable<\/nobr><\/td><td align=\"right\"><nobr>ed_attain<\/nobr><\/td><\/tr><tr><td style=\"color: #888888;\"><nobr>estimate<\/nobr><\/td><td align=\"right\"><nobr>20,699<\/nobr><\/td><\/tr><tr><td style=\"color: #888888;\"><nobr>moe<\/nobr><\/td><td align=\"right\"><nobr>136.0<\/nobr><\/td><\/tr><\/table><\/div>","<style> div.leaflet-popup-content {width:auto !important;overflow-y:auto; overflow-x:hidden;}<\/style><div style=\"max-height:25em;padding-right:0px;\"><table>\n\t\t\t <thead><tr><th colspan=\"2\"><\/th><\/thead><\/tr><tr><td style=\"color: #888888;\"><nobr>GEOID<\/nobr><\/td><td align=\"right\"><nobr>41027<\/nobr><\/td><\/tr><tr><td style=\"color: #888888;\"><nobr>NAME<\/nobr><\/td><td align=\"right\"><nobr>Hood River County, Oregon<\/nobr><\/td><\/tr><tr><td style=\"color: #888888;\"><nobr>variable<\/nobr><\/td><td align=\"right\"><nobr>ed_attain<\/nobr><\/td><\/tr><tr><td style=\"color: #888888;\"><nobr>estimate<\/nobr><\/td><td align=\"right\"><nobr>16,735<\/nobr><\/td><\/tr><tr><td style=\"color: #888888;\"><nobr>moe<\/nobr><\/td><td align=\"right\"><nobr>127.0<\/nobr><\/td><\/tr><\/table><\/div>","<style> div.leaflet-popup-content {width:auto !important;overflow-y:auto; overflow-x:hidden;}<\/style><div style=\"max-height:25em;padding-right:0px;\"><table>\n\t\t\t <thead><tr><th colspan=\"2\"><\/th><\/thead><\/tr><tr><td style=\"color: #888888;\"><nobr>GEOID<\/nobr><\/td><td align=\"right\"><nobr>41059<\/nobr><\/td><\/tr><tr><td style=\"color: #888888;\"><nobr>NAME<\/nobr><\/td><td align=\"right\"><nobr>Umatilla County, Oregon<\/nobr><\/td><\/tr><tr><td style=\"color: #888888;\"><nobr>variable<\/nobr><\/td><td align=\"right\"><nobr>ed_attain<\/nobr><\/td><\/tr><tr><td style=\"color: #888888;\"><nobr>estimate<\/nobr><\/td><td align=\"right\"><nobr>52,883<\/nobr><\/td><\/tr><tr><td style=\"color: #888888;\"><nobr>moe<\/nobr><\/td><td align=\"right\"><nobr>93.0<\/nobr><\/td><\/tr><\/table><\/div>","<style> div.leaflet-popup-content {width:auto !important;overflow-y:auto; overflow-x:hidden;}<\/style><div style=\"max-height:25em;padding-right:0px;\"><table>\n\t\t\t <thead><tr><th colspan=\"2\"><\/th><\/thead><\/tr><tr><td style=\"color: #888888;\"><nobr>GEOID<\/nobr><\/td><td align=\"right\"><nobr>41041<\/nobr><\/td><\/tr><tr><td style=\"color: #888888;\"><nobr>NAME<\/nobr><\/td><td align=\"right\"><nobr>Lincoln County, Oregon<\/nobr><\/td><\/tr><tr><td style=\"color: #888888;\"><nobr>variable<\/nobr><\/td><td align=\"right\"><nobr>ed_attain<\/nobr><\/td><\/tr><tr><td style=\"color: #888888;\"><nobr>estimate<\/nobr><\/td><td align=\"right\"><nobr>39,183<\/nobr><\/td><\/tr><tr><td style=\"color: #888888;\"><nobr>moe<\/nobr><\/td><td align=\"right\"><nobr>147.0<\/nobr><\/td><\/tr><\/table><\/div>","<style> div.leaflet-popup-content {width:auto !important;overflow-y:auto; overflow-x:hidden;}<\/style><div style=\"max-height:25em;padding-right:0px;\"><table>\n\t\t\t <thead><tr><th colspan=\"2\"><\/th><\/thead><\/tr><tr><td style=\"color: #888888;\"><nobr>GEOID<\/nobr><\/td><td align=\"right\"><nobr>41009<\/nobr><\/td><\/tr><tr><td style=\"color: #888888;\"><nobr>NAME<\/nobr><\/td><td align=\"right\"><nobr>Columbia County, Oregon<\/nobr><\/td><\/tr><tr><td style=\"color: #888888;\"><nobr>variable<\/nobr><\/td><td align=\"right\"><nobr>ed_attain<\/nobr><\/td><\/tr><tr><td style=\"color: #888888;\"><nobr>estimate<\/nobr><\/td><td align=\"right\"><nobr>38,085<\/nobr><\/td><\/tr><tr><td style=\"color: #888888;\"><nobr>moe<\/nobr><\/td><td align=\"right\"><nobr>175.0<\/nobr><\/td><\/tr><\/table><\/div>","<style> div.leaflet-popup-content {width:auto !important;overflow-y:auto; overflow-x:hidden;}<\/style><div style=\"max-height:25em;padding-right:0px;\"><table>\n\t\t\t <thead><tr><th colspan=\"2\"><\/th><\/thead><\/tr><tr><td style=\"color: #888888;\"><nobr>GEOID<\/nobr><\/td><td align=\"right\"><nobr>41069<\/nobr><\/td><\/tr><tr><td style=\"color: #888888;\"><nobr>NAME<\/nobr><\/td><td align=\"right\"><nobr>Wheeler County, Oregon<\/nobr><\/td><\/tr><tr><td style=\"color: #888888;\"><nobr>variable<\/nobr><\/td><td align=\"right\"><nobr>ed_attain<\/nobr><\/td><\/tr><tr><td style=\"color: #888888;\"><nobr>estimate<\/nobr><\/td><td align=\"right\"><nobr>1,101<\/nobr><\/td><\/tr><tr><td style=\"color: #888888;\"><nobr>moe<\/nobr><\/td><td align=\"right\"><nobr>100.0<\/nobr><\/td><\/tr><\/table><\/div>","<style> div.leaflet-popup-content {width:auto !important;overflow-y:auto; overflow-x:hidden;}<\/style><div style=\"max-height:25em;padding-right:0px;\"><table>\n\t\t\t <thead><tr><th colspan=\"2\"><\/th><\/thead><\/tr><tr><td style=\"color: #888888;\"><nobr>GEOID<\/nobr><\/td><td align=\"right\"><nobr>41029<\/nobr><\/td><\/tr><tr><td style=\"color: #888888;\"><nobr>NAME<\/nobr><\/td><td align=\"right\"><nobr>Jackson County, Oregon<\/nobr><\/td><\/tr><tr><td style=\"color: #888888;\"><nobr>variable<\/nobr><\/td><td align=\"right\"><nobr>ed_attain<\/nobr><\/td><\/tr><tr><td style=\"color: #888888;\"><nobr>estimate<\/nobr><\/td><td align=\"right\"><nobr>160,008<\/nobr><\/td><\/tr><tr><td style=\"color: #888888;\"><nobr>moe<\/nobr><\/td><td align=\"right\"><nobr>224.0<\/nobr><\/td><\/tr><\/table><\/div>","<style> div.leaflet-popup-content {width:auto !important;overflow-y:auto; overflow-x:hidden;}<\/style><div style=\"max-height:25em;padding-right:0px;\"><table>\n\t\t\t <thead><tr><th colspan=\"2\"><\/th><\/thead><\/tr><tr><td style=\"color: #888888;\"><nobr>GEOID<\/nobr><\/td><td align=\"right\"><nobr>41053<\/nobr><\/td><\/tr><tr><td style=\"color: #888888;\"><nobr>NAME<\/nobr><\/td><td align=\"right\"><nobr>Polk County, Oregon<\/nobr><\/td><\/tr><tr><td style=\"color: #888888;\"><nobr>variable<\/nobr><\/td><td align=\"right\"><nobr>ed_attain<\/nobr><\/td><\/tr><tr><td style=\"color: #888888;\"><nobr>estimate<\/nobr><\/td><td align=\"right\"><nobr>57,222<\/nobr><\/td><\/tr><tr><td style=\"color: #888888;\"><nobr>moe<\/nobr><\/td><td align=\"right\"><nobr>237.0<\/nobr><\/td><\/tr><\/table><\/div>","<style> div.leaflet-popup-content {width:auto !important;overflow-y:auto; overflow-x:hidden;}<\/style><div style=\"max-height:25em;padding-right:0px;\"><table>\n\t\t\t <thead><tr><th colspan=\"2\"><\/th><\/thead><\/tr><tr><td style=\"color: #888888;\"><nobr>GEOID<\/nobr><\/td><td align=\"right\"><nobr>41011<\/nobr><\/td><\/tr><tr><td style=\"color: #888888;\"><nobr>NAME<\/nobr><\/td><td align=\"right\"><nobr>Coos County, Oregon<\/nobr><\/td><\/tr><tr><td style=\"color: #888888;\"><nobr>variable<\/nobr><\/td><td align=\"right\"><nobr>ed_attain<\/nobr><\/td><\/tr><tr><td style=\"color: #888888;\"><nobr>estimate<\/nobr><\/td><td align=\"right\"><nobr>48,945<\/nobr><\/td><\/tr><tr><td style=\"color: #888888;\"><nobr>moe<\/nobr><\/td><td align=\"right\"><nobr>172.0<\/nobr><\/td><\/tr><\/table><\/div>"],null,null,{"interactive":false,"permanent":false,"direction":"auto","opacity":1,"offset":[0,0],"textsize":"10px","textOnly":false,"className":"","sticky":true},null]},{"method":"addMarkers","args":[[42.36497709333691,43.18627290109467,44.70917992684446,45.37771271937282,42.45668800173667,43.93952627462782,43.06010829348362,45.18800223480709,44.90363979069377,44.62985419428703,42.68369018425331,44.14213666393309,45.30982799259892,43.2793438145491,45.5471570425557,44.49077641893789,44.49155208427817,45.40480843399275,44.48898595165216,45.9948112162967,45.15945038436858,43.91521998600279,45.55996062949819,45.23265913542895,45.5793025535468,45.41819802829774,42.79107396897511,45.46309437220145,45.51884717451119,45.5910799287365,44.64135053780487,45.94364380897228,44.72554754666626,42.43149842428786,44.90349696452488,43.17350375972817],[-123.5554269899397,-117.6230438072835,-117.6764213209517,-120.2105905466286,-124.1562826523391,-122.846655042993,-118.9666075432173,-122.2206717861838,-122.5835507017098,-121.1765057018759,-121.6491826278986,-120.3556486838126,-118.0090405051374,-123.1648004755468,-122.4145795203023,-119.0074406795059,-123.4295670587434,-120.6894648209146,-122.5343634986492,-123.655767279176,-121.1675256662992,-121.2267948059207,-123.0980512194404,-123.3084206730678,-117.1802024669837,-119.5837641815531,-120.3841029804612,-123.7129134060155,-121.6509916893192,-118.7375160015953,-123.8682880476357,-123.0881104879254,-120.027118732072,-122.7289164233909,-123.4132412242663,-124.0594225392447],{"iconUrl":{"data":"data:image/png;base64,iVBORw0KGgoAAAANSUhEUgAAAAEAAAABCAQAAAC1HAwCAAAAC0lEQVR4nGP6zwAAAgcBApocMXEAAAAASUVORK5CYII=","index":0},"iconWidth":1,"iconHeight":1},["X1_1","X2_1","X3_1","X4_1","X5_1","X6_1","X7_1","X8_1","X9_1","X10_1","X11_1","X12_1","X13_1","X14_1","X15_1","X16_1","X17_1","X18_1","X19_1","X20_1","X21_1","X22_1","X23_1","X24_1","X25_1","X26_1","X27_1","X28_1","X29_1","X30_1","X31_1","X32_1","X33_1","X34_1","X35_1","X36_1"],"centroids",{"interactive":true,"draggable":false,"keyboard":true,"title":"","alt":"","zIndexOffset":0,"opacity":1,"riseOnHover":false,"riseOffset":250,"pane":"tmap402"},null,null,null,null,["Josephine","Malheur","Baker","Gilliam","Curry","Lane","Harney","Clackamas","Marion","Jefferson","Klamath","Crook","Union","Douglas","Multnomah","Grant","Benton","Sherman","Linn","Clatsop","Wasco","Deschutes","Washington","Yamhill","Wallowa","Morrow","Lake","Tillamook","Hood River","Umatilla","Lincoln","Columbia","Wheeler","Jackson","Polk","Coos"],{"interactive":false,"permanent":true,"direction":"right","opacity":1,"offset":[0,0],"textsize":"6px","textOnly":true,"style":{"color":"#000000"},"className":"","sticky":true,"pane":"tmap402"},null]},{"method":"addControl","args":["<div>\n <div style=\"font-size: 14px; text-align: left; margin-bottom: 5px; color: #000000;\">estimate<\/div>\n<\/div>\n<div>\n <img src=\"data:image/svg+xml,%3Csvg%20xmlns%3D%22http%3A%2F%2Fwww.w3.org%2F2000%2Fsvg%22%20version%3D%221.1%22%20width%3D%2216%22%20height%3D%2216%22%3E%0A%20%20%3Crect%20id%3D%22stadium%22%20x%3D%221%22%20y%3D%221%22%20height%3D%2214%22%20width%3D%2214%22%20rx%3D%2225%25%22%20stroke%3D%22%23404040%22%20fill%3D%22%23E5F1FF%22%20stroke-opacity%3D%221%22%20fill-opacity%3D%221%22%20stroke-width%3D%221%22%20stroke-dash%3D%22%22%20baseSize%3D%2220%22%3E%3C%2Frect%3E%0A%3C%2Fsvg%3E\" style=\"vertical-align: middle; margin: 5px; margin-right: 0px; margin-left: 0px\" height=\"16\" width=\"16\"/>\n <span style=\"font-size: 14px; vertical-align: middle; margin: 0px;\">0 - 99,999<\/span>\n<\/div>\n<div>\n <img src=\"data:image/svg+xml,%3Csvg%20xmlns%3D%22http%3A%2F%2Fwww.w3.org%2F2000%2Fsvg%22%20version%3D%221.1%22%20width%3D%2216%22%20height%3D%2216%22%3E%0A%20%20%3Crect%20id%3D%22stadium%22%20x%3D%221%22%20y%3D%221%22%20height%3D%2214%22%20width%3D%2214%22%20rx%3D%2225%25%22%20stroke%3D%22%23404040%22%20fill%3D%22%23C0D9FB%22%20stroke-opacity%3D%221%22%20fill-opacity%3D%221%22%20stroke-width%3D%221%22%20stroke-dash%3D%22%22%20baseSize%3D%2220%22%3E%3C%2Frect%3E%0A%3C%2Fsvg%3E\" style=\"vertical-align: middle; margin: 5px; margin-right: 0px; margin-left: 0px\" height=\"16\" width=\"16\"/>\n <span style=\"font-size: 14px; vertical-align: middle; margin: 0px;\">100,000 - 199,999<\/span>\n<\/div>\n<div>\n <img src=\"data:image/svg+xml,%3Csvg%20xmlns%3D%22http%3A%2F%2Fwww.w3.org%2F2000%2Fsvg%22%20version%3D%221.1%22%20width%3D%2216%22%20height%3D%2216%22%3E%0A%20%20%3Crect%20id%3D%22stadium%22%20x%3D%221%22%20y%3D%221%22%20height%3D%2214%22%20width%3D%2214%22%20rx%3D%2225%25%22%20stroke%3D%22%23404040%22%20fill%3D%22%2392BAEC%22%20stroke-opacity%3D%221%22%20fill-opacity%3D%221%22%20stroke-width%3D%221%22%20stroke-dash%3D%22%22%20baseSize%3D%2220%22%3E%3C%2Frect%3E%0A%3C%2Fsvg%3E\" style=\"vertical-align: middle; margin: 5px; margin-right: 0px; margin-left: 0px\" height=\"16\" width=\"16\"/>\n <span style=\"font-size: 14px; vertical-align: middle; margin: 0px;\">200,000 - 299,999<\/span>\n<\/div>\n<div>\n <img src=\"data:image/svg+xml,%3Csvg%20xmlns%3D%22http%3A%2F%2Fwww.w3.org%2F2000%2Fsvg%22%20version%3D%221.1%22%20width%3D%2216%22%20height%3D%2216%22%3E%0A%20%20%3Crect%20id%3D%22stadium%22%20x%3D%221%22%20y%3D%221%22%20height%3D%2214%22%20width%3D%2214%22%20rx%3D%2225%25%22%20stroke%3D%22%23404040%22%20fill%3D%22%235A99D6%22%20stroke-opacity%3D%221%22%20fill-opacity%3D%221%22%20stroke-width%3D%221%22%20stroke-dash%3D%22%22%20baseSize%3D%2220%22%3E%3C%2Frect%3E%0A%3C%2Fsvg%3E\" style=\"vertical-align: middle; margin: 5px; margin-right: 0px; margin-left: 0px\" height=\"16\" width=\"16\"/>\n <span style=\"font-size: 14px; vertical-align: middle; margin: 0px;\">300,000 - 399,999<\/span>\n<\/div>\n<div>\n <img src=\"data:image/svg+xml,%3Csvg%20xmlns%3D%22http%3A%2F%2Fwww.w3.org%2F2000%2Fsvg%22%20version%3D%221.1%22%20width%3D%2216%22%20height%3D%2216%22%3E%0A%20%20%3Crect%20id%3D%22stadium%22%20x%3D%221%22%20y%3D%221%22%20height%3D%2214%22%20width%3D%2214%22%20rx%3D%2225%25%22%20stroke%3D%22%23404040%22%20fill%3D%22%230174B7%22%20stroke-opacity%3D%221%22%20fill-opacity%3D%221%22%20stroke-width%3D%221%22%20stroke-dash%3D%22%22%20baseSize%3D%2220%22%3E%3C%2Frect%3E%0A%3C%2Fsvg%3E\" style=\"vertical-align: middle; margin: 5px; margin-right: 0px; margin-left: 0px\" height=\"16\" width=\"16\"/>\n <span style=\"font-size: 14px; vertical-align: middle; margin: 0px;\">400,000 - 499,999<\/span>\n<\/div>\n<div>\n <img src=\"data:image/svg+xml,%3Csvg%20xmlns%3D%22http%3A%2F%2Fwww.w3.org%2F2000%2Fsvg%22%20version%3D%221.1%22%20width%3D%2216%22%20height%3D%2216%22%3E%0A%20%20%3Crect%20id%3D%22stadium%22%20x%3D%221%22%20y%3D%221%22%20height%3D%2214%22%20width%3D%2214%22%20rx%3D%2225%25%22%20stroke%3D%22%23404040%22%20fill%3D%22%23004C85%22%20stroke-opacity%3D%221%22%20fill-opacity%3D%221%22%20stroke-width%3D%221%22%20stroke-dash%3D%22%22%20baseSize%3D%2220%22%3E%3C%2Frect%3E%0A%3C%2Fsvg%3E\" style=\"vertical-align: middle; margin: 5px; margin-right: 0px; margin-left: 0px\" height=\"16\" width=\"16\"/>\n <span style=\"font-size: 14px; vertical-align: middle; margin: 0px;\">500,000 - 600,000<\/span>\n<\/div>","bottomright","legend01","info legend cnty leaflegend-group-cnty"]}],"fitBounds":[41.9058132,-124.7282988,46.3768148,-116.3014492,[]],"limits":{"lat":[41.991794,46.290834],"lng":[-124.566244,-116.463504]}},"evals":[],"jsHooks":{"render":[{"code":"function(el, x, data) {\n return (\nfunction(el, x) {\n var updateLeafLegend = function() {\n var controlGroups = document.querySelectorAll(\n 'input.leaflet-control-layers-selector');\n controlGroups.forEach(g => {\n var groupName = g.nextSibling.innerText.substr(1);\n var className = 'leaflegend-group-' +\n groupName.replace(/[^a-zA-Z0-9]/g, '');\n var checked = g.checked;\n document.querySelectorAll('.legend.' + className).forEach(l => {\n l.hidden = !checked;\n })\n })\n }\n\n updateLeafLegend();\n this.on('baselayerchange', el => updateLeafLegend())\n this.on('overlayadd', el => updateLeafLegend());\n this.on('overlayremove', el => updateLeafLegend());\n}\n ).call(this.getMap(), el, x, data);\n}","data":null}]}}</script> --- # mapview Really quick easy interactive maps — great for exploratory work. ``` r library(mapview) mapview(cnty) ``` <div class="leaflet html-widget html-fill-item" id="htmlwidget-3ae1aa64b2c2543585e9" style="width:432px;height:360px;"></div> <script type="application/json" data-for="htmlwidget-3ae1aa64b2c2543585e9">{"x":{"options":{"minZoom":1,"maxZoom":52,"crs":{"crsClass":"L.CRS.EPSG3857","code":null,"proj4def":null,"projectedBounds":null,"options":{}},"preferCanvas":false,"bounceAtZoomLimits":false,"maxBounds":[[[-90,-370]],[[90,370]]]},"calls":[{"method":"addProviderTiles","args":["CartoDB.Positron","CartoDB.Positron","CartoDB.Positron",{"errorTileUrl":"","noWrap":false,"detectRetina":false,"pane":"tilePane"}]},{"method":"addProviderTiles","args":["CartoDB.DarkMatter","CartoDB.DarkMatter","CartoDB.DarkMatter",{"errorTileUrl":"","noWrap":false,"detectRetina":false,"pane":"tilePane"}]},{"method":"addProviderTiles","args":["OpenStreetMap","OpenStreetMap","OpenStreetMap",{"errorTileUrl":"","noWrap":false,"detectRetina":false,"pane":"tilePane"}]},{"method":"addProviderTiles","args":["Esri.WorldImagery","Esri.WorldImagery","Esri.WorldImagery",{"errorTileUrl":"","noWrap":false,"detectRetina":false,"pane":"tilePane"}]},{"method":"addProviderTiles","args":["OpenTopoMap","OpenTopoMap","OpenTopoMap",{"errorTileUrl":"","noWrap":false,"detectRetina":false,"pane":"tilePane"}]},{"method":"createMapPane","args":["polygon",420]},{"method":"addPolygons","args":[[[[{"lng":[-124.041983,-124.038842,-124.036998,-124.037333,-124.036177,-124.037047,-124.035796,-124.036828,-124.035718,-124.032309,-124.030212,-124.028557,-124.026168,-124.02306,-124.021521,-124.02036,-124.017488,-124.016251,-124.013345,-124.013057,-124.011666,-124.009651,-124.00863,-124.008668,-124.009216,-124.010968,-124.012825,-124.009457,-124.009174,-124.009677,-124.011005,-124.011699,-124.013664,-124.014611,-124.014517,-124.013606,-124.012236,-124.010703,-124.008608,-124.002891,-124.002003,-124.001625,-124.001851,-124.003591,-124.004475,-124.003935,-124.003052,-124.001535,-124.001159,-124.001334,-124.005436,-124.005753,-124.005121,-124.002827,-124.002402,-124.001225,-124.001127,-124.002893,-124.002819,-124.001629,-124.00144,-124.002248,-124.003139,-124.004173,-124.005541,-124.006863,-124.009244,-124.011544,-124.010456,-124.008695,-124.005475,-124.001195,-123.99878,-123.997493,-123.995531,-123.993419,-123.990256,-123.988482,-123.986415,-123.981442,-123.978035,-123.972758,-123.969199,-123.967916,-123.964007,-123.961176,-123.958133,-123.952541,-123.949711,-123.947539,-123.945943,-123.941841,-123.938921,-123.93669,-123.934826,-123.932984,-123.929368,-123.928109,-123.92617,-123.923228,-123.919321,-123.917355,-123.915768,-123.913158,-123.910798,-123.908023,-123.904993,-123.902759,-123.900611,-123.897998,-123.89549,-123.894213,-123.890657,-123.888662,-123.885746,-123.886257,-123.884898,-123.885552,-123.884731,-123.879821,-123.880309,-123.875256,-123.876929,-123.876055,-123.878426,-123.879224,-123.878488,-123.875677,-123.875902,-123.874554,-123.875128,-123.87338,-123.872161,-123.870714,-123.871196,-123.868406,-123.865843,-123.865356,-123.863521,-123.861708,-123.854798,-123.855219,-123.856672,-123.859311,-123.860844,-123.859671,-123.860305,-123.858754,-123.857235,-123.855639,-123.853474,-123.853456,-123.850036,-123.850134,-123.849517,-123.850178,-123.849663,-123.846549,-123.841223,-123.840861,-123.835668,-123.830315,-123.830469,-123.82926,-123.829275,-123.828393,-123.828618,-123.827067,-123.824234,-123.821583,-123.82086,-123.819403,-123.818972,-123.81985,-123.821526,-123.824264,-123.828568,-123.831689,-123.831264,-123.779962,-123.774581,-123.773716,-123.773833,-123.772341,-123.770488,-123.768483,-123.769127,-123.766875,-123.765268,-123.764535,-123.762886,-123.761074,-123.760665,-123.759135,-123.758186,-123.757263,-123.754795,-123.756231,-123.75543,-123.7545,-123.749533,-123.747579,-123.744373,-123.741852,-123.739398,-123.737502,-123.737944,-123.736506,-123.735183,-123.735421,-123.734322,-123.733021,-123.730022,-123.729321,-123.727794,-123.725276,-123.72218,-123.720119,-123.72034,-123.718719,-123.716492,-123.716505,-123.701384,-123.696843,-123.697,-123.687089,-123.687082,-123.677206,-123.677275,-123.581699,-123.581862,-123.571814,-123.571728,-123.566777,-123.567036,-123.562086,-123.562168,-123.542433,-123.542539,-123.523444,-123.494414,-123.494304,-123.484693,-123.465261,-123.465271,-123.455304,-123.455213,-123.445456,-123.444922,-123.431052,-123.425687,-123.425721,-123.406299,-123.406341,-123.4014,-123.401297,-123.400242,-123.371999,-123.371581,-123.36665,-123.366666,-123.347048,-123.328588,-123.328626,-123.309162,-123.309197,-123.274283,-123.27426,-123.249328,-123.249209,-123.229619,-123.229581,-123.229526,-123.229676,-123.229545,-123.229271,-123.229284,-123.229402,-123.229761,-123.229901,-123.2299,-123.229851,-123.229167,-123.231093,-123.230951,-123.230969,-123.231001,-123.23111258448,-123.245561,-123.344311064432,-123.346955,-123.44467,-123.474991,-123.517910995163,-123.518734,-123.530013873107,-123.569305,-123.624022,-123.631514798612,-123.657212,-123.728169,-123.787501,-123.811708,-123.822037891998,-123.820663,-123.818981,-123.818161,-123.821615,-123.824441,-123.826343,-123.828843,-123.829295,-123.827502,-123.827325,-123.830213,-123.832066,-123.833287,-123.834613,-123.83615,-123.83774,-123.838592,-123.838849,-123.839529,-123.839963,-123.840068,-123.840103,-123.837541,-123.83653,-123.837496,-123.837574,-123.836151,-123.841723,-123.844471,-123.845386,-123.845611,-123.847758,-123.848952,-123.84909,-123.848497,-123.846851,-123.843151,-123.840693,-123.840683,-123.840118,-123.838574,-123.838755,-123.840893,-123.841559,-123.840227,-123.834601,-123.834302,-123.834173,-123.830968,-123.829397,-123.827264,-123.828112,-123.826921,-123.8271,-123.825624,-123.824877,-123.82251,-123.821973,-123.82572,-123.829528,-123.829967,-123.830979,-123.831124,-123.832155,-123.835422,-123.836688,-123.838249,-123.840156,-123.840149,-123.83883,-123.839241,-123.842828,-123.846258,-123.850176,-123.854857,-123.856075,-123.858549,-123.857192,-123.85591,-123.855572,-123.853382,-123.85081,-123.849528,-123.844724,-123.842871,-123.840232,-123.836854,-123.827684,-123.826311,-123.823911,-123.822386,-123.821199,-123.820841,-123.817915,-123.815726,-123.812603,-123.814793,-123.814536,-123.815092,-123.813199,-123.813505,-123.816316,-123.81719,-123.821288,-123.820857,-123.821531,-123.820407,-123.820471,-123.818915,-123.816794,-123.813891,-123.812417,-123.811361,-123.808307,-123.805991,-123.802202,-123.799931,-123.797063,-123.796702,-123.793144,-123.790462,-123.791154,-123.792834,-123.793288,-123.793075,-123.794003,-123.79252,-123.7922,-123.796383,-123.798159,-123.79962,-123.803515,-123.805938,-123.809421,-123.812203,-123.810017,-123.811604,-123.811992,-123.813816,-123.815251,-123.814997,-123.817359,-123.820847,-123.822177,-123.823743,-123.82382,-123.826159,-123.825742,-123.825321,-123.828031,-123.829732,-123.830947,-123.832684,-123.832956,-123.835287,-123.838419,-123.836606,-123.837879,-123.83972,-123.843007,-123.843557,-123.847315,-123.847595,-123.847483,-123.845404,-123.844167,-123.841454,-123.839496,-123.8417,-123.845982,-123.84557,-123.849054,-123.851287,-123.853846,-123.856118,-123.857646,-123.859863,-123.863558,-123.864168,-123.866394,-123.869582,-123.871462,-123.871837,-123.87318,-123.875264,-123.87675,-123.876337,-123.878927,-123.878522,-123.877858,-123.877852,-123.878816,-123.884467,-123.884354,-123.888026,-123.891321,-123.892651,-123.895094,-123.897208,-123.900219,-123.903527,-123.907007,-123.910437,-123.915017,-123.916606,-123.920408,-123.923302,-123.924437,-123.925893,-123.928303,-123.930195,-123.933213,-123.93467,-123.935313,-123.936538,-123.940407,-123.944632,-123.94959,-123.953011,-123.956029,-123.962628,-123.966661,-123.970015,-123.972898,-123.978917,-123.984686,-123.986317,-123.990456,-123.992913,-123.995141,-123.998549,-124.008637,-124.010986,-124.017452,-124.01908,-124.021961,-124.026947,-124.028712,-124.030141,-124.032262,-124.033565,-124.036265,-124.036171,-124.035001,-124.035489,-124.037266,-124.03726,-124.038584,-124.039586,-124.041579,-124.041983],"lat":[42.387656,42.388837,42.392623,42.393818,42.394949,42.395766,42.396407,42.398726,42.401762,42.403283,42.402883,42.403308,42.407409,42.407621,42.408194,42.410041,42.410959,42.412176,42.412677,42.413114,42.416175,42.418034,42.419622,42.420822,42.421399,42.421801,42.423994,42.426465,42.427216,42.427851,42.428504,42.429269,42.430707,42.432342,42.434189,42.435068,42.437069,42.439908,42.441928,42.443527,42.444308,42.445291,42.44602,42.447785,42.451153,42.451543,42.451972,42.453402,42.453976,42.455054,42.458572,42.461239,42.462041,42.462667,42.46302,42.464829,42.467382,42.47166,42.473912,42.477902,42.480858,42.48466,42.485828,42.486682,42.487376,42.488828,42.489421,42.489628,42.494019,42.496147,42.496918,42.496875,42.499962,42.500694,42.500832,42.499599,42.501621,42.501979,42.498353,42.497167,42.49761,42.49535,42.496028,42.497228,42.49732,42.498816,42.498238,42.499311,42.500487,42.500474,42.501334,42.500867,42.50113,42.500293,42.497079,42.496023,42.496048,42.494563,42.494335,42.495021,42.494737,42.495798,42.495396,42.496146,42.497435,42.496903,42.499165,42.499584,42.498416,42.499058,42.498997,42.499925,42.500538,42.502978,42.504233,42.505436,42.506279,42.507625,42.508401,42.509885,42.511588,42.51372,42.516203,42.516799,42.519959,42.522047,42.524647,42.526195,42.527805,42.528675,42.530067,42.531188,42.533372,42.534203,42.535158,42.536341,42.539031,42.541989,42.542232,42.544375,42.549736,42.551791,42.553775,42.556281,42.559989,42.562393,42.563091,42.564143,42.566509,42.567228,42.569663,42.570941,42.574579,42.57809,42.579542,42.581966,42.583353,42.586258,42.587864,42.588961,42.591633,42.595067,42.598106,42.599452,42.601793,42.604497,42.606107,42.607046,42.607575,42.60913,42.611139,42.612446,42.614786,42.615779,42.619743,42.622398,42.625339,42.625798,42.632313,42.694025,42.700429,42.700834,42.702858,42.704493,42.704685,42.705989,42.708063,42.709109,42.711145,42.713543,42.715028,42.715876,42.717138,42.717906,42.720093,42.720584,42.72596,42.728067,42.731791,42.732339,42.742038,42.742576,42.746335,42.747987,42.751499,42.753118,42.757294,42.760655,42.762842,42.764575,42.765701,42.768945,42.771115,42.773041,42.773809,42.774115,42.775435,42.77747,42.780911,42.782694,42.784061,42.739658,42.739703,42.739593,42.753907,42.753789,42.750274,42.750145,42.739682,42.73992,42.732149,42.732098,42.735716,42.735693,42.72483,42.724796,42.717574,42.717122,42.709832,42.709186,42.70918,42.702248,42.702168,42.702942,42.699297,42.699406,42.702982,42.703025,42.711122,42.710928,42.711039,42.714483,42.713966,42.710288,42.710297,42.724958,42.724951,42.724955,42.739484,42.739471,42.732194,42.732226,42.73175,42.728247,42.728412,42.732055,42.73203,42.724712,42.724404,42.702421,42.70261,42.668065,42.626212,42.551766,42.495623,42.429362,42.420299,42.355665,42.312847,42.290816,42.287434,42.280466,42.128331,42.128069,42.098876,42.082066,42.004931,42.0039324384249,42.003364,41.9993825981084,41.999276,42.000608,42.000661,42.0007581373596,42.00076,42.0007301112694,42.000626,41.99977,41.998714371006,41.995094,41.997056,41.995834,41.995194,41.9956172960188,41.996727,41.998563,41.998791,41.999935,42.000564,42.00188,42.002504,42.004951,42.006535,42.008438,42.011552,42.011666,42.012042,42.012811,42.013911,42.01489,42.015304,42.016469,42.01704,42.017586,42.018098,42.018736,42.020306,42.024006,42.025558,42.02734,42.029292,42.031385,42.03336,42.036426,42.03699,42.040136,42.043009,42.045069,42.046646,42.047798,42.048965,42.051934,42.05248,42.055504,42.057618,42.057965,42.058515,42.059225,42.060507,42.063187,42.063791,42.066002,42.068955,42.069596,42.072475,42.073675,42.074796,42.077493,42.080498,42.084441,42.085321,42.086567,42.093188,42.097285,42.100377,42.101345,42.103609,42.107914,42.10885,42.109619,42.113334,42.116779,42.119291,42.122593,42.124671,42.125599,42.125204,42.126945,42.130628,42.133224,42.135116,42.137426,42.138323,42.141392,42.143597,42.144503,42.145819,42.146369,42.149668,42.152913,42.154378,42.155855,42.157509,42.157656,42.159333,42.161167,42.163027,42.16438,42.166047,42.169651,42.170464,42.172501,42.174122,42.178235,42.183987,42.185435,42.188225,42.189849,42.190924,42.193959,42.195498,42.198974,42.2036,42.203769,42.20573,42.212667,42.214644,42.217284,42.216849,42.215738,42.216388,42.218962,42.219878,42.22111,42.220457,42.222173,42.224314,42.22781,42.230098,42.231155,42.233619,42.237623,42.237497,42.238232,42.240204,42.239436,42.241176,42.241494,42.24399,42.24779,42.251246,42.253495,42.254797,42.259439,42.262603,42.264096,42.264665,42.264365,42.266983,42.268693,42.270973,42.271824,42.276123,42.279255,42.279859,42.281652,42.282991,42.285622,42.286277,42.288537,42.290556,42.294693,42.296282,42.297656,42.298507,42.299219,42.301983,42.303538,42.305638,42.307854,42.310752,42.312202,42.313281,42.316923,42.318327,42.319125,42.320577,42.320742,42.319933,42.318688,42.31854,42.32046,42.321478,42.322362,42.322796,42.324799,42.327455,42.327633,42.330071,42.330669,42.333167,42.335279,42.341049,42.342428,42.344851,42.345667,42.346072,42.347602,42.351454,42.353095,42.353293,42.351422,42.350937,42.349234,42.349314,42.347644,42.347884,42.346709,42.346592,42.346469,42.348835,42.351045,42.352008,42.352612,42.353759,42.354338,42.355761,42.35983,42.361625,42.360604,42.358058,42.356544,42.356991,42.357866,42.356714,42.35774,42.357324,42.357979,42.358505,42.358449,42.359409,42.357941,42.357659,42.358487,42.358488,42.359016,42.358541,42.35977,42.361384,42.36166,42.359199,42.361049,42.363636,42.365481,42.367455,42.3702,42.374389,42.375876,42.377858,42.380525,42.382673,42.383094,42.384751,42.385912,42.387656]}]],[[{"lng":[-118.232214,-118.193345,-118.193405,-118.152945,-118.152456,-118.132141,-118.132347,-118.112092,-118.112068,-118.092122,-118.092087,-118.087036,-118.087016,-118.071877,-118.071916,-118.051902,-118.051956,-118.031808,-118.031671,-118.011485,-118.011402,-117.971947,-117.971787,-117.87228,-117.851163,-117.749535,-117.631491,-117.608707,-117.590849,-117.590858,-117.56962,-117.569664,-117.52936,-117.529408,-117.509202,-117.509214,-117.486744,-117.487014,-117.405264,-117.30419,-117.220060553639,-117.220069,-117.222451,-117.222647,-117.216974,-117.198559149539,-117.198147,-117.193129,-117.170342,-117.15706,-117.143394,-117.138523,-117.133984,-117.133104,-117.13253,-117.130904,-117.121037,-117.118018,-117.111617,-117.107673,-117.104208,-117.102242,-117.098531,-117.09457,-117.093578,-117.090933,-117.089503,-117.07835,-117.074191882813,-117.067284,-117.059352,-117.05651,-117.05303,-117.050057,-117.047399154136,-117.047062,-117.045513,-117.042283,-117.03585,-117.031862,-117.027558,-117.025277,-117.020231,-117.016921,-117.015868756715,-117.008000996386,-117.003682330068,-117.001,-116.98687,-116.983658939347,-116.981825336926,-116.981589778363,-116.978570032446,-116.975905,-116.973542,-116.972828624351,-116.971958,-116.972110100178,-116.972537,-116.973991,-116.973945,-116.970365,-116.970219,-116.9726,-116.973701,-116.971675,-116.967259,-116.965498,-116.949516444006,-116.947591,-116.945256,-116.940534,-116.939296726739,-116.935443,-116.925392,-116.924028,-116.915738,-116.902752,-116.900103,-116.895757,-116.895028421445,-116.894083,-116.894309,-116.895931,-116.897846346997,-116.900834,-116.901737,-116.901922,-116.903327,-116.911218,-116.913239,-116.91376,-116.914236,-116.916410383599,-116.918991,-116.925642,-116.929069,-116.929442,-116.927688,-116.928306,-116.933704,-116.937750474425,-116.937835,-116.940005494001,-116.940274509534,-116.943132,-116.957009,-116.967203,-116.974253,-116.977351,-116.976979427494,-116.9745725227,-116.974016,-116.973185,-116.972504,-116.972045557891,-116.956246,-116.955741432932,-116.955694238564,-116.950573662942,-116.943361,-116.937342,-116.937261403083,-116.935696297006,-116.935592015008,-116.934719940664,-116.934485,-116.935911,-116.941458,-116.941734972941,-116.943742,-116.94321505163,-116.94242,-116.935847,-116.935584,-116.938195,-116.942757,-116.959871,-116.968743,-116.973435,-116.97618,-116.975525,-116.973807,-116.971556,-116.97088,-116.968634,-116.966314,-116.961683,-116.959206,-116.959808,-116.97049,-116.972331,-116.971574,-116.964915,-116.961264,-116.960415,-116.96177,-116.962251,-116.964292,-116.968214,-116.969028,-116.968955773782,-116.968931,-116.967641,-116.961806,-116.959993,-116.959363,-116.958752,-116.962615,-116.972362,-116.97958,-116.981919,-116.980250760831,-116.979961,-116.978564231043,-116.977332,-116.976429,-116.976694,-116.9765,-116.976114,-116.97617647824,-116.98384,-116.98371442608,-116.983199584669,-116.982214,-116.982347,-116.98294,-116.984152,-116.991415,-116.999061,-117.008691316809,-117.01077,-117.020035,-117.021604961574,-117.021721,-117.019853,-117.014828,-117.010701,-117.010383,-117.012831,-117.016826,-117.021461,-117.025156,-117.031887,-117.032881,-117.027931,-117.023577,-117.02155,-117.022110809539,-117.023049,-117.024020777413,-117.026634,-117.026651,-117.026841,-117.026725,-117.026825,-117.026696659314,-117.026586,-117.026624495654,-117.026717,-117.026661,-117.026705,-117.026905,-117.027001,-117.026937,-117.026789,-117.02676,-117.026824,-117.026889,-117.026922,-117.026774,-117.026746,-117.026745350468,-117.026743821013,-117.02674059016,-117.026719331236,-117.026701376309,-117.026652,-117.026683,-117.026253,-117.026303,-117.026331,-117.026665,-117.026631374451,-117.026575021601,-117.026551,-117.026129,-117.026195,-117.02659,-117.026098,-117.026197,-117.040906,-117.04891,-117.055402,-117.068613,-117.197798,-117.217551,-117.403613,-117.443062,-117.506681810353,-117.530197396566,-117.613207836252,-117.6171880341,-117.623731,-117.625973,-117.705780984811,-117.737792142868,-117.873467,-118.123944939374,-118.197189,-118.197369215928,-118.196857,-118.195281,-118.214698,-118.216384,-118.216832,-118.228793,-118.228673,-118.228683,-118.228618,-118.228069,-118.232011,-118.232178,-118.232171,-118.232392,-118.231731,-118.230291,-118.228107,-118.227645,-118.228541,-118.228843,-118.233908,-118.232214],"lat":[44.256129,44.2562,44.270708,44.270684,44.299509,44.299483,44.31431,44.314271,44.328754,44.328734,44.343208,44.343184,44.357646,44.357562,44.372009,44.372004,44.390032,44.389953,44.415192,44.415169,44.429615,44.429296,44.443849,44.443511,44.444045,44.444136,44.444427,44.444661,44.444573,44.43013,44.430062,44.415678,44.415722,44.401329,44.401461,44.387143,44.387246,44.300317,44.301044,44.301462,44.3014040000001,44.301382,44.298963,44.297578,44.288357,44.2741460602673,44.273828,44.270963,44.25889,44.25749,44.258262,44.25937,44.262972,44.264236,44.267045,44.269453,44.277585,44.278945,44.280667,44.280763,44.27994,44.278799,44.275533,44.270978,44.269383,44.260311,44.258234,44.249885,44.2476774328148,44.24401,44.237244,44.230874,44.229076,44.22883,44.2296393340327,44.229742,44.232005,44.242775,44.246805,44.248635,44.248881,44.248505,44.246063,44.245391,44.2453906695423,44.2453881986673,44.2453868423874,44.245386,44.245477,44.2447059354583,44.2442656367649,44.244209072634,44.2434839480557,44.242844,44.23998,44.2380420862255,44.235677,44.2349306846191,44.232836,44.229821,44.225932,44.221221,44.217493,44.2132,44.208017,44.197256,44.194581,44.194126,44.191571735564,44.191264,44.191677,44.19371,44.1937712439328,44.193962,44.191544,44.18844,44.183152,44.179467,44.176851,44.171267,44.1664463691315,44.160191,44.158114,44.154295,44.1526558411174,44.150099,44.14862,44.145931,44.144422,44.139992,44.132929,44.128381,44.127304,44.125462976158,44.123278,44.118929,44.113972,44.112621,44.109438,44.107326,44.100039,44.0970063481431,44.096943,44.0957616644886,44.0956152473123,44.09406,44.091743,44.090936,44.088295,44.085364,44.081832,44.0589530528064,44.053663,44.049425,44.048771,44.0486051115188,44.042888,44.0426043694783,44.0425778402732,44.0396994290017,44.035645,44.029376,44.0291467346366,44.0246946460507,44.0243980062902,44.0219173103878,44.021249,44.012652,44.007431,44.0069165870337,44.003189,44.0016934551559,43.999437,43.990875,43.986874,43.98459,43.984043,43.982925,43.977477,43.977085,43.974719,43.973091,43.972187,43.970112,43.968302,43.968412,43.968884,43.968168,43.96636,43.963815,43.959764,43.958357,43.956964,43.956301,43.956,43.954564,43.952149,43.948097,43.944286,43.941881,43.939921,43.9377512350526,43.937007,43.934792,43.932797,43.93065,43.927739,43.923246,43.91748,43.916453,43.915253,43.912478,43.9094192775191,43.908888,43.9072537431298,43.905812,43.901293,43.900361,43.897128,43.894759,43.8946464890304,43.880846,43.8801032140428,43.8770578606079,43.871228,43.86884,43.86771,43.866794,43.863864,43.864637,43.8626893878893,43.862269,43.858956,43.8563729196878,43.856182,43.853833,43.852172,43.849754,43.844803,43.840001,43.839962,43.841694,43.841334,43.834156,43.830025,43.826286,43.823811,43.819402,43.8173218792265,43.813842,43.8122882404094,43.80811,43.733935,43.732905,43.714815,43.706193,43.6937391205206,43.683001,43.6808035152354,43.675523,43.664385,43.631659,43.62488,43.621032,43.617614,43.610669,43.601912,43.600357,43.596033,43.593632,43.578674,43.577526,43.5737089790098,43.5647210211312,43.5457346710279,43.420805024449,43.3152915591549,43.025128,43.024876,42.807447,42.80717,42.807015,42.624878,42.5522229216117,42.4304607260049,42.378557,42.357193,42.166404,42.133258,42.117647,41.99989,41.99989,41.998983,41.99989,42.000035,42.00038,41.999887,41.99929,41.999659,41.9992392555284,41.9990841067272,41.9985364286855,41.9985101685311,41.998467,41.998102,41.9981771341869,41.9982072706744,41.998335,41.9972981831054,41.996995,41.9969940811635,42.135279,42.275813,42.275891,42.805902,42.914703,42.914625,43.042817,43.086086,43.096791,43.348964,43.348959,43.43565,43.436775,43.612266,43.779216,43.779207,43.779195,44.039862,44.183239,44.21255,44.212548,44.256129]}]],[[{"lng":[-118.51944,-118.518181,-118.516539,-118.513679,-118.509705,-118.507765,-118.505765,-118.501794,-118.499774,-118.498457,-118.498373,-118.498161,-118.497865,-118.497422,-118.496787,-118.496583,-118.496169,-118.495729,-118.495257,-118.492404,-118.491292,-118.488174,-118.483704,-118.480904,-118.476922,-118.473427,-118.470581,-118.468284,-118.464244,-118.461528,-118.460802,-118.461866,-118.460487,-118.459157,-118.45227,-118.445862,-118.443456,-118.440003,-118.437712,-118.435673,-118.433707,-118.432064,-118.43182,-118.425086,-118.422747,-118.419381,-118.419907,-118.418247,-118.418867,-118.417419,-118.413647,-118.403611,-118.40025,-118.395839,-118.393659,-118.394052,-118.391656,-118.391704,-118.387177,-118.387277,-118.385176,-118.383321,-118.383411,-118.381491,-118.379786,-118.376666,-118.372775,-118.367621,-118.365587,-118.361673,-118.358121,-118.35243,-118.350798,-118.346502,-118.343374,-118.339207,-118.336355,-118.332304,-118.329785,-118.325783,-118.321741,-118.319306,-118.316347,-118.311639,-118.306628,-118.305462,-118.302565,-118.300094,-118.29877,-118.296443,-118.294194,-118.292079,-118.289862,-118.285439,-118.286743,-118.286281,-118.286739,-118.288299,-118.289351,-118.28984,-118.287422,-118.286294,-118.28311,-118.283385,-118.284994,-118.290151,-118.292122,-118.294094,-118.294019,-118.293393,-118.294383,-118.299459,-118.298355,-118.296578,-118.2978,-118.298077,-118.296548,-118.294827,-118.295068,-118.296269,-118.300975,-118.303366,-118.304572,-118.307522,-118.307233,-118.308837,-118.311173,-118.310056,-118.30847,-118.308421,-118.313907,-118.317934,-118.3187,-118.314454,-118.312281,-118.309246,-118.306817,-118.306764,-118.302862,-118.29906,-118.293566,-118.294909,-118.294716,-118.296234,-118.295659,-118.289794,-118.2872,-118.283489,-118.279179,-118.2759,-118.267786,-118.264012,-118.261829,-118.258237,-118.253802,-118.246533,-118.242499,-118.24055,-118.236861,-118.23518,-118.228076,-118.227459,-118.22816,-118.228056,-118.224904,-118.226627,-118.229972,-118.230979,-118.232402,-118.231462,-118.235329,-118.236369,-118.235589,-118.235656,-118.234808,-118.236831,-118.237399,-118.235115,-118.232795,-118.229421,-118.227791,-118.231634,-118.232128,-118.231337,-118.22828,-118.226561,-118.226727,-118.225709,-118.223449,-118.226449,-118.227547,-118.229663,-118.233636,-118.23623,-118.237322,-118.24161,-118.244382,-118.245043,-118.24364,-118.244533,-118.243553,-118.244662,-118.245136,-118.232197,-118.232165,-118.232658,-118.231806,-118.229691,-118.228047,-118.227421,-118.225462,-118.223739,-118.223192,-118.220371,-118.220763,-118.219197,-118.217081,-118.213869,-118.213634,-118.214731,-118.212772,-118.213478,-118.213556,-118.212459,-118.21246,-118.214497,-118.214184,-118.211519,-118.209168,-118.206973,-118.203838,-118.201486,-118.200232,-118.197174,-118.194901,-118.192549,-118.184709,-118.178908,-118.17687,-118.175223,-118.172167,-118.169815,-118.166758,-118.164484,-118.161036,-118.156488,-118.155076,-118.15578,-118.154916,-118.148405,-118.142367,-118.140876,-118.140482,-118.141185,-118.139929,-118.138203,-118.137729,-118.136551,-118.130351,-118.128407,-118.126328,-118.11925,-118.115495,-118.110422,-118.108962,-118.10804,-118.102659,-118.100661,-118.098817,-118.096972,-118.094052,-118.09213,-118.091286,-118.089673,-118.088982,-118.086523,-118.080456,-118.077997,-118.074772,-118.0717,-118.06955,-118.064404,-118.063637,-118.060105,-118.057584,-118.051814,-118.046279,-118.044232,-118.041949,-118.037125,-118.032237,-118.028283,-118.022745,-118.016228,-118.009949,-118.007344,-118.006843,-118.00333,-118.000318,-117.998992,-117.993112,-117.990182,-117.985755,-117.982631,-117.977728,-117.975378,-117.97216,-117.968688,-117.965211,-117.958124,-117.956183,-117.952633,-117.950925,-117.9477,-117.946243,-117.944977,-117.942835,-117.940522,-117.937296,-117.93636,-117.933931,-117.931873,-117.928321,-117.92723,-117.925714,-117.921696,-117.922093,-117.920378,-117.918603,-117.917634,-117.917055,-117.915266,-117.914198,-117.913393,-117.912473,-117.911901,-117.906142,-117.903603,-117.901443,-117.900497,-117.896386,-117.897252,-117.894074,-117.894708,-117.890515,-117.890152,-117.886506,-117.885732,-117.888408,-117.885361,-117.88527,-117.884041,-117.881163,-117.873396,-117.873734,-117.871887,-117.870438,-117.868648,-117.862058,-117.859832,-117.858127,-117.853788,-117.850462,-117.850204,-117.84343,-117.842069,-117.84433,-117.844909,-117.841727,-117.83989,-117.83775,-117.837244,-117.840601,-117.840934,-117.838224,-117.834022,-117.828819,-117.827377,-117.827784,-117.818062,-117.814507,-117.81202,-117.810347,-117.810499,-117.812384,-117.810901,-117.813232,-117.812501,-117.809642,-117.807106,-117.805679,-117.80439,-117.803943,-117.805343,-117.803614,-117.802486,-117.804671,-117.803038,-117.801591,-117.799102,-117.798106,-117.799062,-117.797076,-117.796519,-117.795212,-117.793418,-117.794612,-117.797179,-117.795811,-117.793905,-117.793626,-117.795624,-117.794825,-117.795976,-117.793112,-117.794182,-117.791738,-117.790617,-117.786109,-117.784715,-117.781825,-117.77942,-117.778664,-117.778261,-117.780449,-117.784287,-117.784223,-117.784917,-117.78438,-117.779549,-117.777504,-117.747664,-117.564033,-117.563402,-117.563486,-117.381873,-117.379472,-117.368183,-117.313239,-117.266005,-117.091719,-117.022673,-117.022673,-116.783771926572,-116.78371,-116.797329,-116.808576,-116.814589,-116.826133,-116.842731,-116.847944,-116.845847,-116.844796,-116.844625,-116.846103,-116.856754,-116.858313,-116.856964,-116.85226,-116.848093,-116.844323,-116.841971,-116.839031,-116.834915,-116.830505,-116.826271,-116.829329,-116.836449,-116.847888,-116.850737,-116.846461,-116.835702,-116.832176,-116.833632,-116.838467,-116.842108,-116.846061,-116.850512,-116.852427,-116.857038,-116.865338,-116.871701,-116.876001,-116.878183,-116.879375,-116.883598,-116.887748,-116.889882,-116.892361,-116.895805,-116.898153,-116.898609,-116.896424,-116.896249,-116.898388,-116.899640878328,-116.900069,-116.900146,-116.901051,-116.905771,-116.920498,-116.928099,-116.931099,-116.933699,-116.933799,-116.933099,-116.9308,-116.9307,-116.9318,-116.9347,-116.9368,-116.949001,-116.966801,-116.970902,-116.972902,-116.977802,-116.986502,-116.992003,-116.998903,-117.006045,-117.013802,-117.016216,-117.018418,-117.021398,-117.02942,-117.031738,-117.03827,-117.039549,-117.044217,-117.046250547549,-117.04782,-117.048178,-117.050495,-117.05856,-117.062273,-117.060454,-117.061799,-117.063824,-117.072221,-117.074137,-117.07912,-117.07871,-117.079483004572,-117.080555,-117.080772,-117.079835603761,-117.078574,-117.079031,-117.081022,-117.081286739531,-117.086075,-117.091223,-117.095868,-117.096791,-117.094968,-117.098221,-117.108231,-117.114754,-117.117809,-117.120522,-117.125267,-117.124754,-117.126009,-117.133963,-117.138066,-117.14248,-117.146032,-117.148255,-117.147934,-117.14293,-117.144161,-117.149242,-117.152406,-117.161033,-117.167187,-117.181583,-117.185386,-117.189759,-117.19163,-117.191329,-117.192494,-117.194317,-117.200237,-117.208936,-117.211148,-117.216372,-117.221479026379,-117.224104,-117.225076,-117.225932,-117.225758,-117.224445,-117.221548,-117.217015,-117.215573,-117.214637,-117.215072,-117.218285,-117.225461,-117.22698,-117.234835,-117.242675,-117.243027,-117.235117,-117.227938,-117.216911,-117.210587,-117.206962,-117.197339,-117.196149,-117.189769,-117.189842,-117.191546,-117.192203,-117.203323,-117.2055,-117.21521,-117.216795,-117.217843,-117.220060553639,-117.30419,-117.405264,-117.487014,-117.486744,-117.509214,-117.509202,-117.529408,-117.52936,-117.569664,-117.56962,-117.590858,-117.590849,-117.608707,-117.631491,-117.749535,-117.851163,-117.87228,-117.971787,-117.971947,-118.011402,-118.011485,-118.031671,-118.031808,-118.051956,-118.051902,-118.071916,-118.071877,-118.087016,-118.087036,-118.092087,-118.092122,-118.112068,-118.112092,-118.132347,-118.132141,-118.152456,-118.152945,-118.193405,-118.193345,-118.232214,-118.23217,-118.354122,-118.354145,-118.447185,-118.497499,-118.49732,-118.500117,-118.498411,-118.497321,-118.496152,-118.49507,-118.490468,-118.488681,-118.486512,-118.484647,-118.482345,-118.481412,-118.48124,-118.478727,-118.478595,-118.474848,-118.47266,-118.467883,-118.469096,-118.46887,-118.461061,-118.458579,-118.457563,-118.456729,-118.452455,-118.447799,-118.440356,-118.436986,-118.43437,-118.435357,-118.433621,-118.432384,-118.433579,-118.433813,-118.432812,-118.430374,-118.420455,-118.413314,-118.410955,-118.407612,-118.40889,-118.409774,-118.413703,-118.417555,-118.421329,-118.422586,-118.424394,-118.428326,-118.428483,-118.427067,-118.425493,-118.431707,-118.43501,-118.434932,-118.435954,-118.434853,-118.434066,-118.431147,-118.430919,-118.428322,-118.429108,-118.42895,-118.422418,-118.422102,-118.423597,-118.420684,-118.418457,-118.420366,-118.420601,-118.421545,-118.422173,-118.421542,-118.420911,-118.419336,-118.418155,-118.41351,-118.411069,-118.408786,-118.405392,-118.402845,-118.398703,-118.394593,-118.39201,-118.388293,-118.386097,-118.383108,-118.380034,-118.378302,-118.376741,-118.375367,-118.372852,-118.36939,-118.367973,-118.36514,-118.360732,-118.36231,-118.36365,-118.367042,-118.362312,-118.357986,-118.360667,-118.363427,-118.365086,-118.364615,-118.366115,-118.367772,-118.370202,-118.372863,-118.373195,-118.374563,-118.373523,-118.374509,-118.374236,-118.371346,-118.368806,-118.371036,-118.370803,-118.372225,-118.37153,-118.369628,-118.365535,-118.364066,-118.359224,-118.358417,-118.356315,-118.354205,-118.354821,-118.352379,-118.351025,-118.349305,-118.346739,-118.347966,-118.347614,-118.346234,-118.346866,-118.345607,-118.343872,-118.343274,-118.337886,-118.337408,-118.334252,-118.332254,-118.328495,-118.327739,-118.32617,-118.323526,-118.322737,-118.31982,-118.317296,-118.31769,-118.315482,-118.316873,-118.314069,-118.315622,-118.310984,-118.311222,-118.308934,-118.306961,-118.305777,-118.305778,-118.309328,-118.311696,-118.311853,-118.309704,-118.312564,-118.314537,-118.316589,-118.319431,-118.329297,-118.333246,-118.336404,-118.337588,-118.338852,-118.338063,-118.341934,-118.342567,-118.341699,-118.341779,-118.344374,-118.342194,-118.342172,-118.343208,-118.343684,-118.353557,-118.354824,-118.355851,-118.360273,-118.362249,-118.36454,-118.368572,-118.3711,-118.372365,-118.375037,-118.377906,-118.379855,-118.386038,-118.38634,-118.388087,-118.391024,-118.393181,-118.399942,-118.402581,-118.403639,-118.404947,-118.410214,-118.41088,-118.412928,-118.414113,-118.417036,-118.41909,-118.422329,-118.425197,-118.429638,-118.432342,-118.433626,-118.436806,-118.438184,-118.441788,-118.446702,-118.451401,-118.453139,-118.456063,-118.460962,-118.463113,-118.472734,-118.473527,-118.47732,-118.48214,-118.485639,-118.488713,-118.493278,-118.497947,-118.500889,-118.504435,-118.504437,-118.507257,-118.507077,-118.50892,-118.510957,-118.511088,-118.512691,-118.513986,-118.517591,-118.518688,-118.51765,-118.51749,-118.516452,-118.519174,-118.51944],"lat":[44.705886,44.706081,44.704765,44.7061,44.706237,44.708903,44.709331,44.708664,44.709055,44.710619,44.710678,44.710958,44.711163,44.711339,44.711606,44.711729,44.712027,44.712425,44.712865,44.713621,44.712393,44.710944,44.71003,44.710035,44.709199,44.705289,44.704,44.705666,44.706374,44.707521,44.708948,44.710861,44.712657,44.715774,44.719166,44.723436,44.724173,44.722886,44.721547,44.721555,44.720729,44.721091,44.719766,44.718554,44.719488,44.718693,44.721846,44.722776,44.724884,44.726986,44.727122,44.724808,44.72647,44.726005,44.727872,44.728998,44.731398,44.734328,44.735949,44.737389,44.739093,44.738868,44.740717,44.742041,44.744357,44.745249,44.745628,44.747213,44.747126,44.745474,44.745573,44.744738,44.743996,44.743912,44.744444,44.743944,44.742609,44.742467,44.74358,44.74162,44.74151,44.742082,44.743986,44.744241,44.74528,44.746949,44.747643,44.746025,44.746248,44.74698,44.746564,44.747389,44.749868,44.750975,44.754323,44.757123,44.759278,44.762708,44.763371,44.765439,44.767165,44.767331,44.77072,44.772211,44.773003,44.77925,44.780412,44.784664,44.787259,44.787936,44.790167,44.796442,44.798705,44.799211,44.800259,44.802979,44.807807,44.809344,44.813191,44.816164,44.816426,44.81733,44.818712,44.819407,44.821148,44.821229,44.823236,44.824802,44.828794,44.830613,44.832422,44.834937,44.836274,44.838066,44.840039,44.841107,44.843855,44.846614,44.848153,44.850451,44.853018,44.856606,44.859376,44.862086,44.863043,44.866421,44.865367,44.865007,44.866271,44.866573,44.869386,44.866412,44.866013,44.863351,44.864851,44.864071,44.863165,44.862344,44.86166,44.862587,44.865544,44.867783,44.870332,44.872332,44.875568,44.878634,44.882349,44.887149,44.891028,44.894063,44.897046,44.898643,44.901367,44.902902,44.904173,44.906927,44.908385,44.91053,44.911514,44.913854,44.918361,44.921531,44.923482,44.924687,44.926032,44.930012,44.931409,44.933778,44.93691,44.939575,44.939778,44.941695,44.940104,44.941213,44.942695,44.943198,44.94431,44.945198,44.950096,44.951086,44.956525,44.958396,44.960686,44.960686,44.963285,44.966976,44.969921,44.97237,44.973481,44.976652,44.977488,44.979158,44.981549,44.983722,44.984888,44.987447,44.988505,44.989174,44.990567,44.991343,44.995073,44.996519,44.999353,45.00108,45.005306,45.006585,45.007421,45.008201,45.010094,45.010203,45.01232,45.013155,45.015104,45.015325,45.017329,45.017997,45.019389,45.017995,45.019389,45.019388,45.017105,45.017161,45.016103,45.016657,45.015711,45.017883,45.018775,45.020442,45.022278,45.026728,45.027725,45.02945,45.031677,45.033844,45.035513,45.036458,45.040018,45.040799,45.045024,45.045214,45.044444,45.044761,45.045162,45.046962,45.046801,45.046198,45.045602,45.044347,45.044892,45.04233,45.042327,45.041238,45.038568,45.036878,45.033716,45.032029,45.025648,45.024723,45.021068,45.019598,45.016873,45.015179,45.014088,45.012924,45.012569,45.012785,45.00991,45.006868,45.006961,45.004007,45.003881,45.003403,45.001635,45.000595,44.997644,44.997415,44.996376,44.99484,44.994876,44.994348,44.994448,44.99525,44.99459,44.995409,44.994951,44.995873,44.99617,44.995908,44.997626,45.000621,45.000952,45.002967,45.004881,45.006582,45.006698,45.006667,45.008418,45.009324,45.012767,45.0125,45.014081,45.013626,45.015197,45.016787,45.016939,45.019079,45.020889,45.023006,45.024485,45.024736,45.025357,45.026033,45.026847,45.027236,45.028207,45.028008,45.030232,45.033156,45.034604,45.036321,45.037917,45.039581,45.043706,45.04524,45.047569,45.048706,45.049436,45.051089,45.0571,45.056709,45.058249,45.060095,45.059622,45.060713,45.065639,45.064703,45.060146,45.05758,45.054525,45.055712,45.059753,45.060443,45.060351,45.059736,45.058477,45.057026,45.056057,45.054797,45.054096,45.055136,45.055138,45.052819,45.051643,45.050658,45.04804,45.042113,45.037596,45.035472,45.033314,45.025909,45.024491,45.024511,45.025607,45.026711,45.027532,45.028808,45.030655,45.032274,45.032445,45.031655,45.032832,45.032625,45.031851,45.029481,45.030495,45.029705,45.028184,45.02718,45.02915,45.029284,45.028164,45.026766,45.026679,45.025335,45.026273,45.025795,45.023959,45.023925,45.02278,45.023142,45.022058,45.021648,45.020454,45.018489,45.018583,45.016682,45.016317,45.014854,45.013987,45.014289,45.013583,45.01143,45.009631,45.007621,45.005572,45.003714,44.999668,44.998322,44.995675,44.995244,44.992161,44.992426,44.992866,45.036118,45.079446,45.079997,45.079993,45.080569,45.080581,45.08057,45.080158,45.079734,45.079167,45.078265731912,45.076972,45.060267,45.050652,45.048106,45.037285,45.029446,45.022602,45.01847,45.015312,45.001435,44.999878,44.984298,44.978761,44.975173,44.972527,44.971906,44.974879,44.980758,44.983992,44.985756,44.98458,44.982493,44.975173,44.969239,44.964768,44.958113,44.951521,44.940633,44.931373,44.928976,44.923601,44.914922,44.905249,44.893523,44.887577,44.880769,44.870599,44.867613,44.866684,44.864706,44.861793,44.858268,44.855799,44.855171,44.855218,44.855752,44.854319,44.851985,44.849733,44.84833,44.84228,44.8406075080495,44.840036,44.836672,44.83568,44.834794,44.81438,44.808381,44.804781,44.798781,44.796781,44.794481,44.790981,44.789881,44.787181,44.783881,44.782881,44.777981,44.775181,44.773881,44.772581,44.767981,44.762381,44.759182,44.756382,44.756024,44.756841,44.755572,44.751942,44.750785,44.751102,44.74986,44.748179,44.746483,44.74514,44.7431132252987,44.741549,44.735916,44.732477,44.730265,44.727143,44.721668,44.706654,44.703623,44.700517,44.696374,44.692175,44.690084,44.6886720621095,44.686714,44.684161,44.6825280578776,44.680328,44.677676,44.673685,44.6735859256969,44.671794,44.668807,44.664737,44.657385,44.652011,44.640689,44.62711,44.624883,44.620139,44.614658,44.593818,44.583834,44.581553,44.57524,44.572996,44.57143,44.568603,44.564371,44.562143,44.557236,44.545647,44.536151,44.531802,44.525166,44.523431,44.52296,44.519261,44.513385,44.509886,44.506784,44.503272,44.499884,44.492027,44.485661,44.485359,44.48616,44.4845576143306,44.483734,44.482346,44.479389,44.477223,44.473884,44.470146,44.459042,44.453746,44.44803,44.427162,44.420664,44.407729,44.405583,44.399669,44.396548,44.390974,44.373853,44.367975,44.360163,44.357703,44.355206,44.347406,44.346362,44.336585,44.335007,44.329621,44.32863,44.313024,44.311789,44.309116,44.308236,44.30718,44.3014040000001,44.301462,44.301044,44.300317,44.387246,44.387143,44.401461,44.401329,44.415722,44.415678,44.430062,44.43013,44.444573,44.444661,44.444427,44.444136,44.444045,44.443511,44.443849,44.429296,44.429615,44.415169,44.415192,44.389953,44.390032,44.372004,44.372009,44.357562,44.357646,44.343184,44.343208,44.328734,44.328754,44.314271,44.31431,44.299483,44.299509,44.270684,44.270708,44.2562,44.256129,44.257343,44.256824,44.255384,44.255211,44.255248,44.277036,44.277057,44.278536,44.28383,44.287046,44.288546,44.289246,44.294188,44.297932,44.302617,44.304536,44.306626,44.309518,44.313051,44.315917,44.318331,44.319045,44.322048,44.325517,44.334584,44.336551,44.340343,44.344848,44.346428,44.349406,44.350716,44.350936,44.352126,44.353977,44.356125,44.359247,44.362848,44.364889,44.368133,44.36914,44.369882,44.371744,44.373543,44.373036,44.370845,44.372909,44.378619,44.380988,44.383807,44.385782,44.388993,44.391195,44.394126,44.394828,44.397454,44.398748,44.39858,44.397508,44.399426,44.401907,44.403825,44.407153,44.4088,44.40997,44.411717,44.414309,44.416737,44.421752,44.423503,44.426207,44.428179,44.432468,44.438442,44.443008,44.444531,44.448984,44.453439,44.455072,44.456766,44.455921,44.454282,44.452872,44.452648,44.454457,44.456458,44.457777,44.457882,44.456869,44.458337,44.458504,44.45974,44.462276,44.461433,44.45958,44.459231,44.462786,44.466172,44.466621,44.469162,44.471699,44.474066,44.474856,44.478912,44.480101,44.484385,44.485906,44.488219,44.491714,44.493629,44.496334,44.498025,44.502494,44.50479,44.506397,44.507891,44.509207,44.512089,44.514035,44.519056,44.521255,44.523791,44.526215,44.528638,44.531191,44.53281,44.538112,44.537216,44.536041,44.539108,44.541274,44.542545,44.545392,44.54759,44.548037,44.548608,44.550466,44.551086,44.553654,44.554977,44.556217,44.559716,44.560056,44.562544,44.567029,44.565182,44.564453,44.565112,44.563778,44.562207,44.56119,44.562368,44.564173,44.566543,44.567896,44.569192,44.570658,44.572539,44.575043,44.577082,44.581034,44.582581,44.585317,44.58605,44.587851,44.58881,44.589939,44.591181,44.592251,44.595679,44.597549,44.601609,44.603863,44.605442,44.608771,44.608374,44.610007,44.609502,44.61098,44.61249,44.616775,44.617901,44.618969,44.621341,44.625024,44.626656,44.628403,44.631204,44.631821,44.635601,44.639263,44.639377,44.637965,44.639769,44.639823,44.643038,44.643484,44.645121,44.646102,44.645905,44.64645,44.644419,44.642928,44.641555,44.643001,44.642871,44.643539,44.643381,44.641388,44.641444,44.643025,44.644169,44.644739,44.646543,44.647164,44.648687,44.652801,44.654828,44.653966,44.652595,44.652691,44.654376,44.653206,44.652451,44.650017,44.652859,44.653084,44.655396,44.656297,44.65559,44.656632,44.658729,44.66142,44.661871,44.663639,44.664484,44.663566,44.665698,44.665925,44.665556,44.669929,44.67433,44.675417,44.677878,44.679134,44.681049,44.684021,44.688532,44.690074,44.691562,44.692755,44.695931,44.702462,44.704031,44.705886]}]],[[{"lng":[-120.6535343441,-120.634968,-120.591166,-120.559465,-120.553317424253,-120.521964,-120.505863,-120.482362,-120.45309661514,-120.40396,-120.329057,-120.288656,-120.282156,-120.211474211014,-120.210754,-120.191103256744,-120.170453,-120.141352,-120.07015,-120.0550751063,-120.001148,-119.999501176112,-119.998161,-119.998172,-119.999242,-120.004783,-120.004859,-120.004752,-120.005124,-120.005565,-120.006555,-119.897751,-119.882346,-119.882356,-119.883914,-119.759759,-119.760731,-119.790831,-119.790699,-119.850941,-119.876525,-119.910536,-119.91054,-120.000045,-120.005372,-120.028785,-120.086479,-120.128661,-120.131926,-120.309328,-120.49516,-120.495748,-120.494548,-120.503733,-120.504449,-120.508549,-120.512249,-120.51485,-120.51005,-120.506864,-120.50345,-120.50115,-120.498149,-120.494749,-120.491949,-120.486949,-120.482849,-120.479249,-120.476849,-120.470649,-120.468849,-120.468449,-120.467448,-120.464548,-120.462548,-120.463648,-120.463448,-120.461249,-120.460549,-120.461049,-120.458449,-120.458449,-120.460249,-120.463787,-120.465706,-120.46215,-120.46045,-120.45865,-120.45505,-120.453041,-120.450097,-120.44886,-120.45225,-120.457069,-120.46295,-120.464991,-120.466995,-120.475351,-120.476251,-120.476751,-120.476251,-120.474951,-120.471551,-120.468951,-120.468551,-120.469549,-120.472951,-120.476852,-120.480252,-120.483552,-120.484052,-120.482552,-120.480152,-120.476752,-120.473652,-120.472652,-120.474752,-120.480152,-120.483352,-120.485552,-120.487653,-120.487153,-120.482353,-120.481153,-120.480953,-120.481653,-120.484853,-120.48849,-120.493553,-120.497954,-120.502854,-120.506254,-120.509454,-120.516054,-120.519354,-120.521254,-120.520455,-120.521555,-120.524155,-120.529055,-120.531655,-120.532555,-120.534055,-120.536755,-120.540955,-120.541755,-120.543008,-120.542856,-120.540256,-120.537556,-120.533055,-120.529355,-120.527555,-120.524455,-120.523855,-120.524455,-120.525956,-120.528456,-120.530056,-120.534156,-120.540056,-120.541956,-120.544856,-120.545356,-120.543656,-120.541656,-120.542956,-120.544157,-120.546457,-120.550357,-120.551139,-120.550663,-120.552057,-120.556057,-120.554457,-120.550957,-120.542857,-120.540657,-120.535757,-120.534457,-120.533657,-120.535957,-120.538157,-120.541657,-120.544657,-120.547057,-120.546358,-120.545158,-120.541857,-120.540289,-120.540257,-120.541758,-120.542858,-120.547858,-120.549158,-120.553158,-120.555558,-120.553358,-120.547358,-120.544858,-120.543158,-120.542758,-120.544258,-120.546658,-120.547758,-120.548158,-120.545458,-120.542258,-120.540358,-120.538558,-120.537758,-120.536858,-120.534658,-120.531558,-120.527757,-120.524457,-120.524057,-120.524658,-120.525558,-120.531858,-120.538858,-120.540758,-120.540458,-120.538758,-120.530358,-120.527458,-120.528058,-120.527358,-120.529458,-120.535158,-120.539358,-120.541258,-120.539658,-120.534358,-120.531958,-120.530958,-120.530758,-120.531258,-120.530458,-120.531258,-120.532458,-120.533958,-120.541459,-120.543359,-120.543059,-120.540159,-120.535559,-120.533659,-120.533659,-120.530659,-120.531859,-120.534659,-120.534459,-120.532059,-120.527059,-120.524459,-120.523459,-120.524059,-120.521859,-120.516659,-120.514958,-120.513158,-120.512558,-120.513358,-120.515159,-120.522659,-120.529759,-120.532559,-120.532059,-120.530159,-120.528159,-120.525259,-120.523059,-120.518459,-120.519359,-120.528659,-120.527559,-120.525059,-120.519859,-120.514759,-120.509659,-120.507959,-120.506259,-120.502659,-120.501159,-120.498759,-120.495759,-120.492258,-120.489258,-120.484258,-120.482958,-120.484158,-120.489058,-120.494059,-120.502959,-120.506059,-120.506459,-120.505859,-120.501859,-120.501159,-120.493959,-120.492259,-120.486758,-120.483658,-120.482941,-120.484435,-120.487859,-120.492159,-120.496059,-120.496859,-120.495159,-120.493659,-120.489859,-120.483459,-120.481559,-120.482359,-120.486359,-120.489859,-120.491759,-120.493459,-120.495859,-120.490359,-120.483859,-120.481228,-120.477559,-120.472759,-120.46966,-120.462291,-120.459937,-120.45441,-120.449907,-120.446592,-120.441284,-120.438779,-120.43323,-120.429082,-120.422903,-120.421449,-120.416409,-120.409948,-120.407022,-120.407256,-120.411057,-120.412857,-120.417857,-120.420557,-120.423257,-120.424257,-120.423357,-120.426057,-120.426856,-120.422581,-120.414957,-120.409557,-120.405557,-120.399056,-120.394456,-120.386686,-120.382056,-120.377756,-120.373427,-120.367855,-120.365655,-120.364955,-120.363246,-120.360827,-120.359976,-120.360771,-120.364122,-120.365217,-120.367013,-120.370994,-120.376304,-120.377837,-120.379469,-120.380493,-120.380486,-120.376156,-120.375793,-120.372139,-120.369313,-120.365401,-120.359512,-120.357804,-120.35798,-120.359875,-120.365267,-120.372265,-120.377466,-120.381856,-120.384579,-120.385845,-120.386122,-120.388305,-120.390763,-120.392574,-120.401323,-120.402107,-120.405673,-120.407038,-120.407663,-120.407117,-120.404832,-120.402578,-120.402654,-120.404938,-120.40536,-120.408536,-120.409128,-120.408982,-120.409413,-120.410742,-120.411699,-120.416052,-120.421999,-120.426305,-120.428135,-120.432693,-120.438889,-120.444248,-120.446592,-120.446258,-120.444612,-120.439925,-120.438299,-120.440538,-120.44422,-120.449588,-120.452159,-120.453915,-120.45746,-120.459735,-120.464725,-120.46795,-120.46897,-120.47018,-120.469915,-120.472696,-120.477475,-120.478087,-120.477833,-120.479303,-120.481042,-120.484741,-120.486421,-120.485326,-120.482367,-120.480276,-120.479181,-120.47836,-120.478341,-120.479474,-120.479903,-120.48231,-120.48244,-120.485156,-120.489585,-120.491732,-120.492223,-120.492223,-120.489739,-120.488689,-120.488779,-120.490833,-120.493853,-120.496624,-120.498461,-120.499805,-120.506384,-120.508107,-120.510188,-120.513313,-120.515688,-120.517573,-120.520924,-120.524742,-120.528516,-120.531013,-120.535308,-120.539245,-120.544783,-120.547364,-120.549064,-120.551164,-120.552064,-120.553064,-120.556464,-120.558264,-120.560065,-120.566965,-120.567465,-120.569465,-120.572265,-120.574265,-120.577565,-120.583366,-120.587066,-120.593766,-120.600466,-120.602466,-120.603766,-120.603466,-120.604867,-120.606167,-120.609967,-120.612267,-120.618567,-120.624467,-120.629067,-120.631668,-120.635868,-120.638568,-120.640368,-120.643668,-120.646068,-120.646168,-120.649368,-120.649368,-120.6535343441],"lat":[45.7372486812962,45.745847,45.746547,45.738348,45.7336759670199,45.709848,45.700048,45.694449,45.6962407125498,45.699249,45.71105,45.72015,45.72125,45.725903582393,45.725951,45.7435045782538,45.761951,45.773152,45.785152,45.7909960828741,45.811902,45.8124817188485,45.687968,45.68439,45.517539,45.517157,45.502468,45.501959,45.385771,45.350553,45.257706,45.257017,45.256916,45.25596,45.169152,45.169211,45.081278,45.081253,45.067823,45.067783,45.067866,45.067928,45.066927,45.065591,45.065582,45.065224,45.065398,45.065453,45.067354,45.06779,45.068279,45.07005,45.07465,45.083477,45.08565,45.08725,45.09095,45.09465,45.10135,45.102778,45.10265,45.1041,45.10455,45.10575,45.10585,45.10435,45.10505,45.11015,45.11165,45.10855,45.10695,45.10285,45.10155,45.10015,45.10115,45.10375,45.10515,45.10865,45.11165,45.11625,45.11945,45.12065,45.12315,45.125985,45.130127,45.13505,45.13795,45.13885,45.13945,45.139253,45.140883,45.143185,45.14545,45.145483,45.14405,45.144196,45.146686,45.15105,45.15185,45.15415,45.15645,45.15775,45.15955,45.16215,45.16355,45.16494,45.16595,45.16835,45.16895,45.17025,45.17155,45.17235,45.17235,45.17325,45.17565,45.17765,45.17975,45.18015,45.17945,45.17955,45.18075,45.18365,45.18665,45.18895,45.19125,45.19335,45.19485,45.197233,45.19765,45.19575,45.19555,45.19615,45.19785,45.19925,45.20105,45.20265,45.20445,45.20535,45.20445,45.20475,45.20605,45.21065,45.21125,45.21115,45.209949,45.210349,45.212507,45.213649,45.217049,45.21785,45.21665,45.21635,45.21675,45.21885,45.22035,45.22255,45.22385,45.22465,45.22465,45.22325,45.219849,45.220249,45.222449,45.223949,45.228449,45.231949,45.235149,45.236649,45.237249,45.240849,45.242426,45.244146,45.246649,45.250449,45.252749,45.253349,45.253849,45.253255,45.25495,45.25585,45.25905,45.26185,45.262449,45.261649,45.261649,45.262949,45.267249,45.269049,45.271849,45.274864,45.276049,45.279049,45.279649,45.281049,45.281049,45.279649,45.281249,45.283249,45.284449,45.284449,45.285649,45.288049,45.291449,45.295549,45.296449,45.298349,45.302549,45.304549,45.304349,45.302749,45.297849,45.296349,45.295049,45.294749,45.295949,45.29915,45.30015,45.304049,45.305749,45.309049,45.309749,45.311549,45.314749,45.315849,45.317549,45.319149,45.320949,45.324249,45.328149,45.328449,45.327749,45.329349,45.330649,45.331449,45.331449,45.332249,45.335149,45.336549,45.339249,45.342049,45.343649,45.344149,45.345249,45.346049,45.347649,45.349949,45.351749,45.352949,45.358149,45.363849,45.366149,45.368449,45.370249,45.371249,45.371849,45.372549,45.373549,45.376849,45.377849,45.375749,45.375649,45.376849,45.378649,45.380649,45.381149,45.381849,45.380449,45.381549,45.383249,45.385449,45.386549,45.387249,45.388849,45.394649,45.396349,45.400349,45.403449,45.405249,45.405449,45.404349,45.405049,45.405749,45.407749,45.417249,45.418749,45.419049,45.418649,45.417349,45.416849,45.419249,45.420549,45.422849,45.426949,45.428249,45.427949,45.428249,45.430649,45.431749,45.433249,45.433999,45.434549,45.434249,45.434349,45.435549,45.438548,45.440716,45.442549,45.443649,45.444049,45.446949,45.450549,45.451849,45.453649,45.455349,45.456549,45.459549,45.461749,45.462449,45.462049,45.462649,45.465349,45.468949,45.470249,45.471983,45.472649,45.476149,45.476929,45.478808,45.480212,45.485194,45.485275,45.48369,45.478877,45.475768,45.472994,45.471716,45.469243,45.468017,45.468636,45.470332,45.473147,45.47445,45.48185,45.48255,45.48305,45.48285,45.48365,45.48605,45.49195,45.49395,45.49795,45.50051,45.49875,45.49825,45.49745,45.49695,45.49705,45.496787,45.49445,45.49295,45.493714,45.49525,45.49655,45.49725,45.501064,45.505691,45.508034,45.509832,45.51263,45.51424,45.515253,45.516641,45.518095,45.518166,45.519428,45.521584,45.523731,45.527588,45.528385,45.530644,45.531392,45.53113,45.530316,45.531459,45.533713,45.535359,45.537249,45.537733,45.537535,45.538808,45.541528,45.54431,45.546732,45.548723,45.549859,45.551701,45.554154,45.555641,45.556725,45.557779,45.559754,45.563101,45.565666,45.567051,45.569936,45.574605,45.576728,45.581893,45.583655,45.589052,45.592508,45.595318,45.596067,45.597026,45.597602,45.597164,45.597302,45.598438,45.602365,45.607454,45.613944,45.615692,45.618006,45.621291,45.622848,45.626112,45.627031,45.626584,45.62586,45.624286,45.622016,45.621577,45.619673,45.619321,45.620066,45.622829,45.624827,45.626368,45.627752,45.628747,45.630668,45.633047,45.634178,45.635036,45.637158,45.638269,45.639391,45.639181,45.639518,45.640653,45.642019,45.644858,45.645151,45.645166,45.645177,45.645171,45.643312,45.643504,45.648871,45.648977,45.651677,45.654794,45.654991,45.655946,45.656147,45.655522,45.655788,45.656275,45.661515,45.663944,45.665119,45.66596,45.66608,45.666867,45.667379,45.668983,45.671177,45.671899,45.671852,45.671165,45.669195,45.669048,45.670148,45.672548,45.677548,45.678348,45.679448,45.681648,45.682348,45.686048,45.690648,45.693748,45.695448,45.696048,45.698648,45.700048,45.701648,45.701548,45.702247,45.702847,45.704747,45.706647,45.713047,45.714547,45.715847,45.717847,45.721447,45.722047,45.721346,45.720646,45.721546,45.720846,45.721046,45.722346,45.723946,45.726146,45.730246,45.732947,45.7372486812962]}]],[[{"lng":[-124.323889,-124.323214,-124.322417,-124.321769,-124.321536,-124.32138,-124.321173,-124.321095,-124.321432,-124.322087,-124.322719,-124.323287,-124.323765,-124.323739,-124.32405,-124.323889],"lat":[42.066648,42.067318,42.067459,42.067305,42.066766,42.066016,42.065612,42.065034,42.064573,42.064226,42.064104,42.064124,42.064438,42.065188,42.065785,42.066648]}],[{"lng":[-124.427244,-124.426878,-124.426074,-124.425349,-124.424934,-124.42496,-124.424856,-124.425038,-124.425556,-124.426126,-124.42693,-124.427251,-124.427244],"lat":[42.314462,42.315107,42.315529,42.315299,42.314781,42.314091,42.313325,42.312826,42.312673,42.312596,42.312846,42.313704,42.314462]}],[{"lng":[-124.47709,-124.476357,-124.476278,-124.475922,-124.475545,-124.474892,-124.475088,-124.474951,-124.474793,-124.475644,-124.475862,-124.476397,-124.476971,-124.477268,-124.47709],"lat":[42.66717,42.667622,42.667957,42.668452,42.668554,42.668029,42.667505,42.666748,42.666384,42.665743,42.665495,42.665888,42.666151,42.666602,42.66717]}],[{"lng":[-124.564595,-124.560403,-124.556645,-124.552441,-124.549492,-124.548023,-124.544561,-124.545058,-124.54051,-124.53648,-124.534433,-124.536195,-124.534589,-124.530438,-124.528298,-124.525653,-124.500141,-124.480938,-124.479636362958,-124.438676,-124.434245,-124.415423,-124.41539,-124.296347,-124.269254,-124.258388,-124.258274,-124.253467,-124.253317,-124.243779,-124.24387,-124.239129,-124.239394,-124.219623,-124.219416,-124.209708,-124.209522,-124.214393,-124.214201,-124.204851,-124.204529,-124.199717,-124.199692,-124.189984,-124.189907,-124.185291,-124.18531,-124.180706,-124.180704,-124.161308,-124.160976,-124.161288,-124.162074,-124.156629,-124.156491,-124.151209,-124.151235,-124.146377,-124.146344,-124.141475,-124.141185,-124.160658,-124.160149,-124.164889,-124.164225,-124.164887,-124.160163,-124.159895,-124.159966,-124.138655,-124.138686,-124.138748,-124.132926,-124.132918,-124.128049,-124.128073,-124.119228,-124.1192,-124.089872,-124.089872,-124.070314,-123.996291,-123.996296,-123.976677,-123.976631,-123.956985,-123.957026,-123.937288,-123.937268,-123.925942,-123.925717,-123.868491,-123.868282,-123.84989,-123.849858,-123.811553,-123.808536,-123.806976,-123.803732,-123.800444,-123.800083,-123.799136,-123.796749,-123.796456,-123.795111,-123.7917,-123.789263,-123.783304,-123.780349,-123.778041,-123.773571,-123.76995,-123.766112,-123.764019,-123.761476,-123.759427,-123.756486,-123.754526,-123.752421,-123.750436,-123.746879,-123.743493,-123.741725,-123.740093,-123.739229,-123.735741,-123.734082,-123.732315,-123.726832,-123.723188,-123.720137,-123.716495,-123.716492,-123.718719,-123.72034,-123.720119,-123.72218,-123.725276,-123.727794,-123.729321,-123.730022,-123.733021,-123.734322,-123.735421,-123.735183,-123.736506,-123.737944,-123.737502,-123.739398,-123.741852,-123.744373,-123.747579,-123.749533,-123.7545,-123.75543,-123.756231,-123.754795,-123.757263,-123.758186,-123.759135,-123.760665,-123.761074,-123.762886,-123.764535,-123.765268,-123.766875,-123.769127,-123.768483,-123.770488,-123.772341,-123.773833,-123.773716,-123.774581,-123.779962,-123.831264,-123.831689,-123.828568,-123.824264,-123.821526,-123.81985,-123.818972,-123.819403,-123.82086,-123.821583,-123.824234,-123.827067,-123.828618,-123.828393,-123.829275,-123.82926,-123.830469,-123.830315,-123.835668,-123.840861,-123.841223,-123.846549,-123.849663,-123.850178,-123.849517,-123.850134,-123.850036,-123.853456,-123.853474,-123.855639,-123.857235,-123.858754,-123.860305,-123.859671,-123.860844,-123.859311,-123.856672,-123.855219,-123.854798,-123.861708,-123.863521,-123.865356,-123.865843,-123.868406,-123.871196,-123.870714,-123.872161,-123.87338,-123.875128,-123.874554,-123.875902,-123.875677,-123.878488,-123.879224,-123.878426,-123.876055,-123.876929,-123.875256,-123.880309,-123.879821,-123.884731,-123.885552,-123.884898,-123.886257,-123.885746,-123.888662,-123.890657,-123.894213,-123.89549,-123.897998,-123.900611,-123.902759,-123.904993,-123.908023,-123.910798,-123.913158,-123.915768,-123.917355,-123.919321,-123.923228,-123.92617,-123.928109,-123.929368,-123.932984,-123.934826,-123.93669,-123.938921,-123.941841,-123.945943,-123.947539,-123.949711,-123.952541,-123.958133,-123.961176,-123.964007,-123.967916,-123.969199,-123.972758,-123.978035,-123.981442,-123.986415,-123.988482,-123.990256,-123.993419,-123.995531,-123.997493,-123.99878,-124.001195,-124.005475,-124.008695,-124.010456,-124.011544,-124.009244,-124.006863,-124.005541,-124.004173,-124.003139,-124.002248,-124.00144,-124.001629,-124.002819,-124.002893,-124.001127,-124.001225,-124.002402,-124.002827,-124.005121,-124.005753,-124.005436,-124.001334,-124.001159,-124.001535,-124.003052,-124.003935,-124.004475,-124.003591,-124.001851,-124.001625,-124.002003,-124.002891,-124.008608,-124.010703,-124.012236,-124.013606,-124.014517,-124.014611,-124.013664,-124.011699,-124.011005,-124.009677,-124.009174,-124.009457,-124.012825,-124.010968,-124.009216,-124.008668,-124.00863,-124.009651,-124.011666,-124.013057,-124.013345,-124.016251,-124.017488,-124.02036,-124.021521,-124.02306,-124.026168,-124.028557,-124.030212,-124.032309,-124.035718,-124.036828,-124.035796,-124.037047,-124.036177,-124.037333,-124.036998,-124.038842,-124.041983,-124.041579,-124.039586,-124.038584,-124.03726,-124.037266,-124.035489,-124.035001,-124.036171,-124.036265,-124.033565,-124.032262,-124.030141,-124.028712,-124.026947,-124.021961,-124.01908,-124.017452,-124.010986,-124.008637,-123.998549,-123.995141,-123.992913,-123.990456,-123.986317,-123.984686,-123.978917,-123.972898,-123.970015,-123.966661,-123.962628,-123.956029,-123.953011,-123.94959,-123.944632,-123.940407,-123.936538,-123.935313,-123.93467,-123.933213,-123.930195,-123.928303,-123.925893,-123.924437,-123.923302,-123.920408,-123.916606,-123.915017,-123.910437,-123.907007,-123.903527,-123.900219,-123.897208,-123.895094,-123.892651,-123.891321,-123.888026,-123.884354,-123.884467,-123.878816,-123.877852,-123.877858,-123.878522,-123.878927,-123.876337,-123.87675,-123.875264,-123.87318,-123.871837,-123.871462,-123.869582,-123.866394,-123.864168,-123.863558,-123.859863,-123.857646,-123.856118,-123.853846,-123.851287,-123.849054,-123.84557,-123.845982,-123.8417,-123.839496,-123.841454,-123.844167,-123.845404,-123.847483,-123.847595,-123.847315,-123.843557,-123.843007,-123.83972,-123.837879,-123.836606,-123.838419,-123.835287,-123.832956,-123.832684,-123.830947,-123.829732,-123.828031,-123.825321,-123.825742,-123.826159,-123.82382,-123.823743,-123.822177,-123.820847,-123.817359,-123.814997,-123.815251,-123.813816,-123.811992,-123.811604,-123.810017,-123.812203,-123.809421,-123.805938,-123.803515,-123.79962,-123.798159,-123.796383,-123.7922,-123.79252,-123.794003,-123.793075,-123.793288,-123.792834,-123.791154,-123.790462,-123.793144,-123.796702,-123.797063,-123.799931,-123.802202,-123.805991,-123.808307,-123.811361,-123.812417,-123.813891,-123.816794,-123.818915,-123.820471,-123.820407,-123.821531,-123.820857,-123.821288,-123.81719,-123.816316,-123.813505,-123.813199,-123.815092,-123.814536,-123.814793,-123.812603,-123.815726,-123.817915,-123.820841,-123.821199,-123.822386,-123.823911,-123.826311,-123.827684,-123.836854,-123.840232,-123.842871,-123.844724,-123.849528,-123.85081,-123.853382,-123.855572,-123.85591,-123.857192,-123.858549,-123.856075,-123.854857,-123.850176,-123.846258,-123.842828,-123.839241,-123.83883,-123.840149,-123.840156,-123.838249,-123.836688,-123.835422,-123.832155,-123.831124,-123.830979,-123.829967,-123.829528,-123.82572,-123.821973,-123.82251,-123.824877,-123.825624,-123.8271,-123.826921,-123.828112,-123.827264,-123.829397,-123.830968,-123.834173,-123.834302,-123.834601,-123.840227,-123.841559,-123.840893,-123.838755,-123.838574,-123.840118,-123.840683,-123.840693,-123.843151,-123.846851,-123.848497,-123.84909,-123.848952,-123.847758,-123.845611,-123.845386,-123.844471,-123.841723,-123.836151,-123.837574,-123.837496,-123.83653,-123.837541,-123.840103,-123.840068,-123.839963,-123.839529,-123.838849,-123.838592,-123.83774,-123.83615,-123.834613,-123.833287,-123.832066,-123.830213,-123.827325,-123.827502,-123.829295,-123.828843,-123.826343,-123.824441,-123.821615,-123.818161,-123.818981,-123.820663,-123.822037891998,-123.834208,-123.967045984176,-123.999248,-124.084956,-124.102532,-124.121365,-124.211605,-124.21894,-124.227079,-124.230459,-124.231537,-124.237242,-124.239121787196,-124.239716,-124.244725,-124.245485117115,-124.248523,-124.254028,-124.255035,-124.259821,-124.263887,-124.265820787596,-124.270094423003,-124.270464,-124.270791201675,-124.277703,-124.279883,-124.281677,-124.282347205885,-124.28264,-124.286679,-124.288729760161,-124.291269,-124.290870418472,-124.289783836142,-124.289478,-124.291670598908,-124.292595,-124.295473,-124.294998,-124.296801,-124.299649,-124.30084,-124.303991,-124.308571,-124.313319,-124.313628940036,-124.316250114133,-124.316276,-124.316823741191,-124.319738,-124.319924107201,-124.320203,-124.320698,-124.323806521608,-124.324785,-124.325767444958,-124.328858,-124.329066329506,-124.332127,-124.335162,-124.34101,-124.342669,-124.342058,-124.344673,-124.348476,-124.351083,-124.354027,-124.352136,-124.350766,-124.351193,-124.352704,-124.355319,-124.356229,-124.357122,-124.356177,-124.353486,-124.354239,-124.351535,-124.351784,-124.356493,-124.356243,-124.358499,-124.361563,-124.366028,-124.366832,-124.363389,-124.360318,-124.361972,-124.364606,-124.361748,-124.362442,-124.361009,-124.363555,-124.366106,-124.368606,-124.370319,-124.373264,-124.376215,-124.375337,-124.375697,-124.377867,-124.378158,-124.37662,-124.377762,-124.382256,-124.383633,-124.386301,-124.388426,-124.389162,-124.392505,-124.392458,-124.397747,-124.400795,-124.401549,-124.404214,-124.410982,-124.414149,-124.411534,-124.411461,-124.408514,-124.408226331137,-124.408215,-124.41051,-124.412919,-124.41131,-124.411815,-124.41978,-124.418591,-124.420557,-124.425264,-124.426435,-124.427782,-124.431686,-124.433063,-124.431438,-124.431495,-124.429288,-124.427222,-124.428752,-124.426885,-124.426354,-124.424759,-124.424765038491,-124.426155,-124.426131310332,-124.426017646233,-124.425647484431,-124.425499,-124.428734,-124.42983957245,-124.431134,-124.431273499676,-124.435892,-124.43512,-124.433983499306,-124.431748,-124.423836,-124.422038,-124.42492,-124.425631,-124.422012,-124.421981,-124.422394,-124.425816,-124.425039,-124.423084,-124.421356,-124.419964,-124.421381,-124.422195,-124.420076,-124.411362,-124.410982713025,-124.406126984569,-124.405834027084,-124.399829,-124.399133,-124.397684,-124.392657,-124.391571,-124.389977,-124.392305,-124.394426,-124.394815,-124.393663,-124.395052,-124.398319,-124.400031,-124.401954,-124.404933,-124.408289,-124.403855,-124.401716,-124.40433,-124.40112,-124.401498,-124.399421,-124.401385,-124.401177,-124.405547,-124.404841,-124.406282,-124.407266509123,-124.409431,-124.411308,-124.413764,-124.409836,-124.413119,-124.416774,-124.422747,-124.429195,-124.434688,-124.438875,-124.45074,-124.451484,-124.447873851781,-124.447487,-124.449417,-124.452248,-124.455263,-124.454984,-124.459643,-124.459797,-124.461619,-124.462569,-124.46445,-124.467766,-124.467559,-124.473864,-124.478516461253,-124.482158,-124.491225646384,-124.491679,-124.498473,-124.499122,-124.503681,-124.503784994074,-124.505236,-124.508394,-124.511286,-124.513663,-124.514669,-124.514311,-124.513602,-124.516177,-124.52046,-124.524439,-124.532333828514,-124.536073,-124.544179,-124.552845,-124.559298,-124.564487,-124.566244,-124.564595],"lat":[42.840876,42.838038,42.838429,42.840568,42.843616,42.847981,42.851377,42.854086,42.856855,42.862354,42.869664,42.87227,42.875403,42.876082,42.879534,42.879986,42.917502,42.951495,42.9543325389089,42.953817,42.95369,42.953769,42.955232,42.954621,42.954877,42.954946,42.951152,42.951314,42.943809,42.9443,42.940652,42.940948,42.933751,42.933782,42.918156,42.918227,42.911125,42.911141,42.904006,42.90391,42.900327,42.900275,42.896656,42.896696,42.893032,42.893047,42.885919,42.885998,42.88245,42.883499,42.876642,42.874824,42.86973,42.869642,42.8658,42.86581,42.862067,42.862081,42.850511,42.850586,42.828475,42.828288,42.817761,42.817825,42.804038,42.790006,42.790087,42.768326,42.739947,42.739956,42.729928,42.671115,42.671119,42.666697,42.666684,42.671123,42.671129,42.678339,42.678208,42.685454,42.685327,42.685651,42.7001,42.700118,42.714558,42.714569,42.729051,42.729097,42.739666,42.73971,42.774514,42.77484,42.781921,42.781821,42.788994,42.788837,42.787868,42.786983,42.787536,42.78959,42.790094,42.790954,42.79277,42.792936,42.793699,42.797302,42.798147,42.799426,42.798915,42.797665,42.797407,42.794568,42.793468,42.792059,42.792391,42.79107,42.789808,42.789804,42.788245,42.787735,42.788228,42.787971,42.786552,42.783343,42.782865,42.782516,42.781753,42.780131,42.781526,42.783945,42.784164,42.785376,42.784061,42.782694,42.780911,42.77747,42.775435,42.774115,42.773809,42.773041,42.771115,42.768945,42.765701,42.764575,42.762842,42.760655,42.757294,42.753118,42.751499,42.747987,42.746335,42.742576,42.742038,42.732339,42.731791,42.728067,42.72596,42.720584,42.720093,42.717906,42.717138,42.715876,42.715028,42.713543,42.711145,42.709109,42.708063,42.705989,42.704685,42.704493,42.702858,42.700834,42.700429,42.694025,42.632313,42.625798,42.625339,42.622398,42.619743,42.615779,42.614786,42.612446,42.611139,42.60913,42.607575,42.607046,42.606107,42.604497,42.601793,42.599452,42.598106,42.595067,42.591633,42.588961,42.587864,42.586258,42.583353,42.581966,42.579542,42.57809,42.574579,42.570941,42.569663,42.567228,42.566509,42.564143,42.563091,42.562393,42.559989,42.556281,42.553775,42.551791,42.549736,42.544375,42.542232,42.541989,42.539031,42.536341,42.535158,42.534203,42.533372,42.531188,42.530067,42.528675,42.527805,42.526195,42.524647,42.522047,42.519959,42.516799,42.516203,42.51372,42.511588,42.509885,42.508401,42.507625,42.506279,42.505436,42.504233,42.502978,42.500538,42.499925,42.498997,42.499058,42.498416,42.499584,42.499165,42.496903,42.497435,42.496146,42.495396,42.495798,42.494737,42.495021,42.494335,42.494563,42.496048,42.496023,42.497079,42.500293,42.50113,42.500867,42.501334,42.500474,42.500487,42.499311,42.498238,42.498816,42.49732,42.497228,42.496028,42.49535,42.49761,42.497167,42.498353,42.501979,42.501621,42.499599,42.500832,42.500694,42.499962,42.496875,42.496918,42.496147,42.494019,42.489628,42.489421,42.488828,42.487376,42.486682,42.485828,42.48466,42.480858,42.477902,42.473912,42.47166,42.467382,42.464829,42.46302,42.462667,42.462041,42.461239,42.458572,42.455054,42.453976,42.453402,42.451972,42.451543,42.451153,42.447785,42.44602,42.445291,42.444308,42.443527,42.441928,42.439908,42.437069,42.435068,42.434189,42.432342,42.430707,42.429269,42.428504,42.427851,42.427216,42.426465,42.423994,42.421801,42.421399,42.420822,42.419622,42.418034,42.416175,42.413114,42.412677,42.412176,42.410959,42.410041,42.408194,42.407621,42.407409,42.403308,42.402883,42.403283,42.401762,42.398726,42.396407,42.395766,42.394949,42.393818,42.392623,42.388837,42.387656,42.385912,42.384751,42.383094,42.382673,42.380525,42.377858,42.375876,42.374389,42.3702,42.367455,42.365481,42.363636,42.361049,42.359199,42.36166,42.361384,42.35977,42.358541,42.359016,42.358488,42.358487,42.357659,42.357941,42.359409,42.358449,42.358505,42.357979,42.357324,42.35774,42.356714,42.357866,42.356991,42.356544,42.358058,42.360604,42.361625,42.35983,42.355761,42.354338,42.353759,42.352612,42.352008,42.351045,42.348835,42.346469,42.346592,42.346709,42.347884,42.347644,42.349314,42.349234,42.350937,42.351422,42.353293,42.353095,42.351454,42.347602,42.346072,42.345667,42.344851,42.342428,42.341049,42.335279,42.333167,42.330669,42.330071,42.327633,42.327455,42.324799,42.322796,42.322362,42.321478,42.32046,42.31854,42.318688,42.319933,42.320742,42.320577,42.319125,42.318327,42.316923,42.313281,42.312202,42.310752,42.307854,42.305638,42.303538,42.301983,42.299219,42.298507,42.297656,42.296282,42.294693,42.290556,42.288537,42.286277,42.285622,42.282991,42.281652,42.279859,42.279255,42.276123,42.271824,42.270973,42.268693,42.266983,42.264365,42.264665,42.264096,42.262603,42.259439,42.254797,42.253495,42.251246,42.24779,42.24399,42.241494,42.241176,42.239436,42.240204,42.238232,42.237497,42.237623,42.233619,42.231155,42.230098,42.22781,42.224314,42.222173,42.220457,42.22111,42.219878,42.218962,42.216388,42.215738,42.216849,42.217284,42.214644,42.212667,42.20573,42.203769,42.2036,42.198974,42.195498,42.193959,42.190924,42.189849,42.188225,42.185435,42.183987,42.178235,42.174122,42.172501,42.170464,42.169651,42.166047,42.16438,42.163027,42.161167,42.159333,42.157656,42.157509,42.155855,42.154378,42.152913,42.149668,42.146369,42.145819,42.144503,42.143597,42.141392,42.138323,42.137426,42.135116,42.133224,42.130628,42.126945,42.125204,42.125599,42.124671,42.122593,42.119291,42.116779,42.113334,42.109619,42.10885,42.107914,42.103609,42.101345,42.100377,42.097285,42.093188,42.086567,42.085321,42.084441,42.080498,42.077493,42.074796,42.073675,42.072475,42.069596,42.068955,42.066002,42.063791,42.063187,42.060507,42.059225,42.058515,42.057965,42.057618,42.055504,42.05248,42.051934,42.048965,42.047798,42.046646,42.045069,42.043009,42.040136,42.03699,42.036426,42.03336,42.031385,42.029292,42.02734,42.025558,42.024006,42.020306,42.018736,42.018098,42.017586,42.01704,42.016469,42.015304,42.01489,42.013911,42.012811,42.012042,42.011666,42.011552,42.008438,42.006535,42.004951,42.002504,42.00188,42.000564,41.999935,41.998791,41.998563,41.996727,41.9956172960188,41.996116,41.9961337074385,41.996138,41.996662,41.99681,41.997015,41.99846,42.007916,42.0125,42.013206,42.015156,42.018688,42.0225828218138,42.023814,42.02522,42.0253761062006,42.026,42.029218,42.031573,42.034578,42.040923,42.042284325311,42.0452928294818,42.045553,42.0455717127357,42.045967,42.044316,42.04427,42.0450543427124,42.045397,42.045346,42.0447352398387,42.043979,42.044650646595,42.0464816379254,42.046997,42.0480183838992,42.048449,42.04764,42.048876,42.051343,42.051736,42.055806,42.060886,42.064801,42.065277,42.0655839003804,42.0681793680017,42.068205,42.0688524167975,42.072297,42.0730712835003,42.07423159375,42.076291,42.0803783978765,42.081665,42.0825671223039,42.085405,42.0854402420363,42.085958,42.087445,42.092929,42.094295,42.097922,42.100039,42.100215,42.100213,42.103539,42.104692,42.108014,42.110662,42.113293,42.113635,42.114952,42.118016,42.119711,42.121595,42.124095,42.129796,42.134965,42.139691,42.142132,42.143848,42.143767,42.152343,42.15845,42.158588,42.162272,42.166086,42.169219,42.171991,42.176704,42.180752,42.182839,42.183612,42.18862,42.191349,42.195752,42.196381,42.201109,42.206111,42.208971,42.21119,42.213643,42.218809,42.223888,42.22716,42.228076,42.229427,42.232105,42.233345,42.23515,42.239938,42.240081,42.242802,42.245129,42.250547,42.252164,42.254115,42.257678,42.260588,42.2796049322341,42.280354,42.298652,42.301818,42.305175,42.307393,42.315527,42.316757,42.320412,42.322026,42.319569,42.318857,42.321101,42.323976,42.329094,42.33072,42.331746,42.33488,42.338918,42.341532,42.352029,42.376993,42.3770733517197,42.395569,42.3960674941724,42.3984592917688,42.4062484892051,42.409373,42.417776,42.4206421965775,42.423998,42.4243844827095,42.43718,42.441926,42.443810056608,42.447516,42.45735,42.461226,42.462132,42.46346,42.465439,42.470417,42.475608,42.476345,42.478611,42.478952,42.485061,42.48998,42.491737,42.496427,42.499678,42.513378,42.5141969546748,42.5246814209893,42.5253139734301,42.53828,42.543366,42.546728,42.561716,42.568218,42.574758,42.576755,42.577054,42.578512,42.582061,42.584732,42.589587,42.591926,42.592077,42.591139,42.594815,42.594702,42.597676,42.601175,42.601872,42.610005,42.618079,42.620088,42.627192,42.628966,42.631415,42.636517,42.6370463026186,42.63821,42.640715,42.645795,42.649485,42.657934,42.661594,42.663285,42.666605,42.669958,42.670837,42.675798,42.677787,42.6840670501793,42.68474,42.689819,42.691953,42.694369,42.697079,42.702166,42.707486,42.711488,42.714106,42.717283,42.719533,42.723821,42.732671,42.7351234428017,42.737043,42.7415630136265,42.741789,42.741077,42.738606,42.739758,42.7395367701631,42.73645,42.735337,42.733124,42.732949,42.736806,42.744038,42.745827,42.755653,42.770865,42.789793,42.8063386170557,42.814175,42.822958,42.830144,42.834298,42.834164,42.836392,42.840876]}]],[[{"lng":[-124.150267,-124.144075,-124.138326,-124.137178,-124.137081915707,-124.136941,-124.134251,-124.133271736676,-124.130608,-124.125752,-124.125748897347,-124.123975,-124.125438,-124.124083,-124.123643,-124.127073,-124.127758,-124.125824,-124.123876,-124.125868,-124.128882,-124.12741,-124.125272,-124.122668,-124.117006,-124.116717,-124.115864601151,-124.114424,-124.115671,-124.114719,-124.113212,-124.111054,-124.112945,-124.115309,-124.114293,-124.111681,-124.111766,-124.108945,-124.109744,-124.114869,-124.115953,-124.114690718599,-124.114043752426,-124.083717,-124.063303,-124.063259,-123.941072,-123.941075,-123.798955,-123.775598,-123.767931,-123.723588,-123.715386,-123.715377,-123.593513,-123.59329,-123.573614,-123.556039,-123.532858,-123.472186,-123.471685,-123.455686,-123.451272,-123.371411,-123.371408,-123.367696,-123.328667,-123.288655,-123.248679,-123.230044,-123.224885,-123.200385,-123.180388,-123.179931,-123.175977,-123.175133,-123.174174,-123.174054,-123.174938,-123.17501,-123.177701,-123.178903,-123.17878,-123.175342,-123.174204,-123.171308,-123.169341,-123.166868,-123.163604,-123.159533,-123.156542,-123.153386,-123.1512,-123.15034,-123.150627,-123.152389,-123.155708,-123.15911,-123.15787,-123.160434,-123.164226,-123.166002,-123.165428,-123.127696,-123.07167,-123.060853,-123.040799,-123.038427,-123.038121,-122.985827,-122.97952,-122.979199,-122.905755,-122.903999,-122.884125,-122.872923,-122.865545,-122.865465,-122.861992,-122.860134,-122.856452,-122.852796,-122.849343,-122.846854,-122.845096,-122.843403,-122.839919,-122.837442,-122.835135,-122.833148,-122.830451,-122.830352,-122.828717,-122.829074,-122.82527,-122.823015,-122.819352,-122.817065,-122.814416,-122.811705,-122.807156,-122.804727,-122.802825,-122.798259,-122.795605,-122.791085,-122.788615,-122.784205,-122.781625,-122.779134,-122.776319,-122.774074,-122.771265,-122.768734,-122.762735,-122.758905,-122.758014,-122.753255,-122.749834,-122.746347,-122.744584,-122.742034,-122.738128,-122.731121,-122.727574,-122.725697,-122.725089,-122.724937,-122.722692,-122.721184,-122.717134,-122.71472,-122.710473,-122.706473,-122.704483,-122.700224,-122.696076,-122.696412,-122.693973,-122.692063,-122.689353,-122.686703,-122.683333,-122.680863,-122.678543,-122.676247,-122.674283,-122.670787,-122.668915,-122.665931,-122.663697,-122.657909,-122.655773,-122.652553,-122.651583,-122.646853,-122.64679,-122.644542,-122.645763,-122.64493,-122.644082,-122.640716,-122.639699,-122.637437,-122.631432,-122.624857,-122.622312,-122.617391,-122.611738,-122.608342,-122.604621,-122.599071,-122.593471,-122.591986,-122.588363,-122.585624,-122.582028,-122.579831,-122.57677,-122.5754,-122.575169,-122.57778,-122.577232,-122.573085,-122.570153,-122.567339,-122.565493,-122.562413,-122.558723,-122.554953,-122.551917,-122.549707,-122.548543,-122.545794,-122.543711,-122.539632,-122.535382,-122.533745,-122.532614,-122.532942,-122.531171,-122.529542,-122.528191,-122.522442,-122.519391,-122.513425,-122.512251,-122.511964,-122.510561,-122.507203,-122.503182,-122.499506,-122.497,-122.492272,-122.488381,-122.484305,-122.479635,-122.478045,-122.47368,-122.470829,-122.468798,-122.465628,-122.463518,-122.457892,-122.456337,-122.451074,-122.448436,-122.445272,-122.442879,-122.438796,-122.434885,-122.430218,-122.426446,-122.425081,-122.425089,-122.404748,-122.404781,-122.384561,-122.38457,-122.379589,-122.373799,-122.371128,-122.367197,-122.364257,-122.363745,-122.361244,-122.358069,-122.35689,-122.355447,-122.354488,-122.352623,-122.347714,-122.340612,-122.339923,-122.336791,-122.334249,-122.331857,-122.330673,-122.327313,-122.328729,-122.325744,-122.328531,-122.331478,-122.332446,-122.32949,-122.32715,-122.264527,-122.264527,-122.228368,-122.027996,-122.028016,-121.964517,-121.960126,-121.799426,-121.797461,-121.794053,-121.793299,-121.789648,-121.78928,-121.790457,-121.789792,-121.787806,-121.78766,-121.786562,-121.785421,-121.785753,-121.783459,-121.780239,-121.778226,-121.777905,-121.779552,-121.78406,-121.785251,-121.783458,-121.785536,-121.785631,-121.78366,-121.78161,-121.782576,-121.780652,-121.781334,-121.782174,-121.78121,-121.781511,-121.7791,-121.777485,-121.774525,-121.774047,-121.774429,-121.773407,-121.77429,-121.776464,-121.777556,-121.779738,-121.778813,-121.777229,-121.773196,-121.771647,-121.772913,-121.772426,-121.776708,-121.77888,-121.782017,-121.781132,-121.781069,-121.78342,-121.783142,-121.78402,-121.782676,-121.779553,-121.772735,-121.773339,-121.772532,-121.773003,-121.771473,-121.771649,-121.770604,-121.771345,-121.769381,-121.76807,-121.768446,-121.769573,-121.770003,-121.769311,-121.769874,-121.769259,-121.771349,-121.772156,-121.771755,-121.772481,-121.773384,-121.776779,-121.777087,-121.779395,-121.779748,-121.784547,-121.787098,-121.789211,-121.789458,-121.790365,-121.793616,-121.796501,-121.799227,-121.801513,-121.802225,-121.805421,-121.81219,-121.814176,-121.815895,-121.817468,-121.820056,-121.821394,-121.825726,-121.830059,-121.832225,-121.834472,-121.835193,-121.832785,-121.832623,-121.82955,-121.828042,-121.827324,-121.825487,-121.825042,-121.825381,-121.823599,-121.822016,-121.822384,-121.824299,-121.824533,-121.825663,-121.827099,-121.829103,-121.829239,-121.833384,-121.831355,-121.830273,-121.828402,-121.832449,-121.835458,-121.83679,-121.835963,-121.837282,-121.843135,-121.845087,-121.84511,-121.84356,-121.841469,-121.836722,-121.841387,-121.84539,-121.848898,-121.851462,-121.853218,-121.857063,-121.859711,-121.85998,-121.858022,-121.859435,-121.859497,-121.858124,-121.858174,-121.859205,-121.858102,-121.858364,-121.860927,-121.861569,-121.861353,-121.862399,-121.861553,-121.865338,-121.864863,-121.86649,-121.868366,-121.869966,-121.865855,-121.865553,-121.866636,-121.86838,-121.868029,-121.869385,-121.871602,-121.876903,-121.884325,-121.888545,-121.891442,-121.892574,-121.893921,-121.898393,-121.899743,-121.901482,-121.904318,-121.905856,-121.907868,-121.911588,-121.913613,-121.916265,-121.916801,-121.920359,-121.923578,-121.928213,-121.929404,-121.931438,-121.934322,-121.936964,-121.939333,-121.93656,-121.931479,-121.931269,-121.932415,-121.937524,-121.94233,-121.943782,-121.94521,-121.947402,-121.952256,-121.952638,-121.951391,-121.95134,-121.95296,-121.956466,-121.9575,-121.959462,-121.961483,-121.962046,-121.965431,-121.968548,-121.972931,-121.972875,-121.975113,-121.975358,-121.97542,-121.974896,-121.976173,-121.976081,-121.974401,-121.9744,-121.975192,-121.974803,-121.975226,-121.976052,-121.976763,-121.977799,-121.976611,-121.975264,-121.973657,-121.973495,-121.974756,-121.974278,-121.975565,-121.97546,-121.974371,-121.97073,-121.967767,-121.963754,-121.964537,-121.964924,-121.964404,-121.966654,-121.968382,-121.967348,-121.967157,-121.967844,-121.96739,-121.966186,-121.964026,-121.960507,-121.962544,-121.96538,-121.968894,-121.969609,-121.969048,-121.965522,-121.961437,-121.963562,-121.967095,-121.968164,-121.970119,-121.971991,-121.970437,-121.974141,-121.974351,-121.975677,-121.981248,-121.981007,-121.979648,-121.978289,-121.975173,-121.975571,-121.973689,-121.975456,-121.977949,-121.978262,-121.977,-121.975842,-121.973588,-121.973125,-121.974629,-121.975179,-121.974607,-121.973498,-121.971795,-121.967179,-121.966917,-121.967826,-121.972422,-121.973084,-121.972889,-121.973488,-121.976117,-121.978224,-121.979573,-121.979319,-121.980832,-121.981099,-121.983119,-121.98475,-121.984519,-121.985716,-121.986267,-121.985717,-121.98691,-121.985633,-121.982442,-121.980619,-121.980509,-121.978135,-121.974541,-121.973742,-121.972147,-121.969516,-121.967951,-121.9657,-121.964918,-121.968364,-121.977014,-121.981146,-121.98666,-121.99214,-121.995526,-121.997755,-122.000095,-122.001623,-122.001944,-122.002362,-122.003068,-122.010965,-122.013037,-122.016941,-122.020002,-122.026748,-122.02914,-122.034958,-122.035993,-122.038966,-122.04094,-122.042529,-122.046115,-122.047708,-122.049781,-122.056872,-122.059263,-122.061334,-122.064361,-122.067707,-122.071531,-122.072724,-122.070284,-122.071291,-122.076149,-122.078379,-122.080848,-122.0826,-122.086742,-122.092318,-122.093513,-122.094982,-122.094779,-122.096613,-122.099228,-122.103544,-122.105215,-122.106566,-122.109553,-122.110753,-122.112224,-122.116677,-122.124336,-122.125264,-122.12716,-122.129193,-122.131009,-122.131616,-122.133128,-122.133674,-122.135109,-122.136349,-122.138746,-122.139145,-122.140828,-122.142806,-122.142867,-122.141768,-122.140082,-122.140274,-122.143532,-122.144946,-122.146991,-122.146222,-122.147807,-122.149534,-122.148688,-122.147726,-122.145139,-122.142355,-122.138758,-122.132474,-122.131583,-122.129797,-122.129678,-122.130579,-122.128721,-122.130529,-122.133453,-122.133547,-122.130937,-122.131417,-122.133046,-122.133356,-122.132331,-122.132848,-122.134547,-122.13445,-122.135334,-122.136871,-122.138917,-122.140492,-122.140161,-122.13888,-122.137364,-122.136458,-122.138412,-122.138978,-122.136912,-122.138621,-122.145365,-122.147339,-122.146301,-122.148739,-122.151573,-122.15296,-122.149927,-122.147305,-122.14421,-122.14345,-122.140676,-122.138814,-122.13754,-122.132435,-122.132034,-122.270653,-122.27067,-122.447124,-122.508441,-122.508438,-122.622914,-122.622946,-122.741716,-122.741317,-122.741914,-122.741845,-122.771564,-122.776409,-122.781518,-122.833744,-122.892765,-122.9124,-122.932533,-122.935501,-122.970915,-122.987618,-122.987626,-123.107475,-123.107672,-123.107318,-123.137211,-123.13733,-123.137588,-123.137646,-123.138001,-123.137319,-123.147539,-123.153653,-123.185986,-123.312001,-123.313129,-123.348246,-123.3482,-123.397831,-123.411426,-123.470371,-123.470251,-123.529153,-123.529005,-123.579689,-123.57958,-123.619574,-123.619367,-123.619621,-123.619012,-123.658909,-123.658767,-123.703628,-123.7038,-123.734733,-123.75871,-123.81007,-123.827004,-123.827036,-123.831984,-123.832118,-123.837073,-123.837143,-123.842059,-123.842136,-123.847057,-123.847397,-123.852268,-123.852602,-123.862381,-123.862685,-123.872399,-123.872566,-123.872667,-123.877485,-123.877749,-123.882553,-123.882804,-123.897197,-123.897407,-123.902195,-123.902391,-123.907166,-123.916158,-123.925917,-123.926089,-123.925479,-123.934708,-123.946529,-123.946294,-123.96592,-123.98581,-124.005944,-124.025781,-124.064585,-124.064614,-124.098533,-124.101667,-124.102125,-124.104167,-124.138807,-124.158728145934,-124.150267],"lat":[43.91085,43.958437,43.995325,44.013606,44.0174173436398,44.023007,44.042125,44.0485338927156,44.065967,44.092848,44.0928706736351,44.105834,44.11123,44.114417,44.117217,44.119776,44.122027,44.12613,44.1341,44.136034,44.137549,44.139211,44.141892,44.142519,44.171913,44.185962,44.1904979663121,44.198164,44.206554,44.2167,44.221742,44.235071,44.24275,44.245977,44.249408,44.255421,44.260489,44.265475,44.270597,44.272721,44.274641,44.276194,44.2769899702691,44.276117,44.275094,44.277178,44.277375,44.282951,44.283304,44.283547,44.283606,44.283944,44.283946,44.280267,44.276699,44.281915,44.282597,44.281402,44.281523,44.281471,44.281185,44.280647,44.280496,44.281021,44.283725,44.283719,44.283725,44.283724,44.283726,44.283725,44.283725,44.283725,44.283725,44.283431,44.277606,44.275152,44.267131,44.266608,44.261582,44.259514,44.255751,44.253056,44.251601,44.248645,44.248114,44.247537,44.245854,44.240113,44.235315,44.233078,44.233269,44.231343,44.228779,44.226627,44.2252,44.222689,44.219947,44.214094,44.211612,44.207989,44.204725,44.201877,44.200071,44.200016,44.200024,44.200077,44.200136,44.200745,44.200129,44.200572,44.200613,44.200616,44.200736,44.259129,44.258894,44.258952,44.25898,44.287317,44.286662,44.285586,44.285373,44.285539,44.284298,44.284282,44.283601,44.281187,44.281352,44.282129,44.283455,44.282285,44.282166,44.28097,44.278525,44.277106,44.276858,44.27432,44.275804,44.27639,44.276269,44.27983,44.284171,44.283952,44.284435,44.284724,44.285708,44.285866,44.28565,44.283459,44.2834,44.283909,44.283816,44.284609,44.286729,44.288119,44.290537,44.290066,44.289137,44.28724,44.28473,44.285909,44.286051,44.287467,44.285828,44.28823,44.286529,44.286668,44.285639,44.283162,44.282775,44.281778,44.280931,44.281603,44.27937,44.279319,44.27822,44.279938,44.278893,44.277019,44.275771,44.275387,44.273948,44.27373,44.274459,44.274128,44.27327,44.273535,44.271849,44.270633,44.268902,44.269093,44.270062,44.271093,44.269688,44.26881,44.267078,44.266384,44.264246,44.260088,44.25681,44.253458,44.252551,44.251096,44.249263,44.249458,44.249189,44.25002,44.249852,44.247801,44.246867,44.245298,44.244228,44.24447,44.244427,44.242953,44.24123,44.239178,44.238046,44.237819,44.236587,44.235358,44.234628,44.22979,44.228044,44.229146,44.228689,44.229347,44.230575,44.231617,44.230568,44.231089,44.232295,44.235344,44.235588,44.235022,44.235184,44.23431,44.23486,44.233706,44.231511,44.22987,44.228633,44.226715,44.226498,44.228581,44.230717,44.231535,44.22982,44.227819,44.2262,44.223448,44.22167,44.222611,44.222308,44.219967,44.221927,44.22148,44.219132,44.219196,44.222406,44.222878,44.222599,44.223039,44.222209,44.220805,44.219036,44.21805,44.216748,44.217388,44.218543,44.21871,44.221306,44.220296,44.218544,44.218198,44.220657,44.22058,44.216938,44.217063,44.211013,44.20944,44.210413,44.209667,44.20938,44.21102,44.211945,44.211748,44.213326,44.216311,44.217265,44.219183,44.220742,44.221659,44.221577,44.224454,44.227001,44.226938,44.227653,44.229606,44.231189,44.234719,44.237579,44.238506,44.240603,44.243382,44.249537,44.252841,44.25263,44.253847,44.253847,44.253818,44.256164,44.257238,44.257313,44.25828,44.254613,44.252707,44.25152,44.249326,44.247071,44.245463,44.243505,44.240762,44.234981,44.233215,44.230903,44.229239,44.225653,44.224606,44.221483,44.218877,44.216985,44.215751,44.212595,44.209599,44.208394,44.207811,44.20542,44.205326,44.203014,44.201958,44.199392,44.198499,44.196545,44.194809,44.194255,44.192042,44.190792,44.190156,44.187627,44.185623,44.183762,44.181082,44.178687,44.17565,44.173127,44.171595,44.169488,44.167583,44.164798,44.16353,44.159933,44.160744,44.159765,44.158315,44.155202,44.154322,44.151746,44.148462,44.14625,44.145276,44.139831,44.137039,44.134981,44.133307,44.131314,44.12676,44.125254,44.123916,44.118178,44.115245,44.11205,44.110428,44.108132,44.106409,44.10395,44.10134,44.099603,44.095897,44.094858,44.091034,44.089686,44.088537,44.085138,44.082353,44.080121,44.077214,44.076541,44.075019,44.072607,44.071873,44.067131,44.061662,44.060089,44.05684,44.052691,44.052251,44.053164,44.052956,44.051201,44.051832,44.050905,44.047911,44.044147,44.041365,44.041599,44.039744,44.037024,44.035576,44.033319,44.03106,44.029158,44.024752,44.023129,44.021567,44.019426,44.016406,44.012359,44.010777,44.008066,44.004224,44.002135,43.99759,43.995395,43.994496,43.991094,43.990573,43.989247,43.988727,43.987296,43.987284,43.985983,43.984745,43.982647,43.979073,43.976239,43.975021,43.973445,43.972587,43.971232,43.969574,43.967175,43.967269,43.966335,43.966596,43.965248,43.961526,43.958507,43.954542,43.953806,43.952781,43.951404,43.948783,43.947384,43.945593,43.944787,43.943048,43.941197,43.939036,43.937103,43.935837,43.932315,43.930281,43.925795,43.923898,43.923286,43.920959,43.919789,43.917106,43.915837,43.914504,43.911859,43.911681,43.907841,43.907985,43.90867,43.908658,43.9109,43.910784,43.912269,43.914537,43.9159,43.914863,43.913363,43.913876,43.912326,43.912917,43.912347,43.911488,43.911171,43.908566,43.909181,43.907347,43.905543,43.904908,43.903343,43.900866,43.900588,43.898992,43.897504,43.894213,43.890663,43.886262,43.884603,43.882058,43.881049,43.878063,43.876552,43.875554,43.873938,43.871681,43.870083,43.868549,43.868195,43.866226,43.865003,43.865763,43.864554,43.861156,43.859351,43.85757,43.855444,43.851773,43.851243,43.848478,43.846044,43.843043,43.84128,43.83999,43.838518,43.83585,43.834914,43.830226,43.828526,43.827615,43.827875,43.829345,43.827147,43.821219,43.817418,43.812541,43.811768,43.811555,43.813036,43.812761,43.809736,43.808235,43.805798,43.803954,43.801924,43.800984,43.795743,43.793313,43.791207,43.78699,43.784709,43.782628,43.78124,43.77872,43.777706,43.774753,43.769542,43.76734,43.765176,43.763745,43.762525,43.759699,43.757767,43.756832,43.752983,43.750748,43.750364,43.748549,43.746965,43.742964,43.741516,43.739082,43.737692,43.735841,43.733585,43.730635,43.729102,43.725444,43.724446,43.722386,43.721911,43.7176,43.715821,43.714027,43.710661,43.708584,43.706227,43.705008,43.704254,43.702821,43.701406,43.69714,43.695848,43.692868,43.691409,43.690301,43.688021,43.683766,43.680825,43.676079,43.673038,43.670143,43.667019,43.665708,43.66425,43.661708,43.656292,43.653858,43.652527,43.644379,43.64254,43.639685,43.637181,43.635627,43.633715,43.631689,43.629837,43.627549,43.62779,43.627045,43.626385,43.625796,43.625894,43.625632,43.625893,43.626937,43.62704,43.626357,43.622528,43.616414,43.615498,43.614657,43.609274,43.609162,43.609916,43.606611,43.604822,43.603609,43.602452,43.601758,43.601615,43.600817,43.599211,43.597823,43.597881,43.594581,43.59192,43.590297,43.589719,43.587403,43.58775,43.58775,43.584945,43.581616,43.579585,43.579643,43.577964,43.577326,43.577615,43.579584,43.579642,43.579215,43.576825,43.575654,43.574618,43.574987,43.574486,43.572977,43.569273,43.567709,43.565274,43.56549,43.562447,43.561938,43.55993,43.558293,43.557376,43.557284,43.55495,43.553278,43.551491,43.549437,43.544544,43.543161,43.541944,43.540482,43.53711,43.535952,43.534465,43.530775,43.529683,43.528421,43.52841,43.525509,43.523617,43.523017,43.520693,43.519057,43.515463,43.513576,43.513285,43.511821,43.510434,43.507323,43.505694,43.503594,43.499774,43.496887,43.491969,43.491401,43.489966,43.485057,43.483834,43.482811,43.479701,43.478185,43.476034,43.47356,43.472069,43.468423,43.467445,43.467514,43.466716,43.463835,43.461778,43.461777,43.460686,43.459132,43.456987,43.456339,43.45514,43.45489,43.452654,43.450923,43.449351,43.448708,43.447662,43.444354,43.442479,43.442832,43.444169,43.444947,43.444501,43.443167,43.441124,43.440221,43.440011,43.441628,43.44141,43.441275,43.440226,43.440262,43.438458,43.437395,43.452015,43.517582,43.544654,43.544317,43.544034,43.543912,43.544702,43.544882,43.543886,43.544357,43.54417,43.541679,43.540992,43.538988,43.540013,43.542099,43.605889,43.605906,43.649355,43.677086,43.736284,43.753648,43.77967,43.779635,43.779631,43.779533,43.77991,43.77991,43.78017,43.809212,43.809076,43.809877,43.810056,43.831183,43.830061,43.86833,43.868291,43.891057,43.891672,43.899074,43.906509,43.921117,43.921672,43.936474,43.937399,43.944319,43.944062,43.943882,43.944581,43.944837,43.94305,43.94308,43.935987,43.935984,43.932458,43.932429,43.928878,43.928822,43.924661,43.924682,43.920553,43.920658,43.916562,43.916733,43.914097,43.912655,43.91275,43.908629,43.908714,43.904582,43.904714,43.900512,43.900512,43.896281,43.896252,43.897322,43.898476,43.878689,43.865947,43.866012,43.871689,43.862737,43.863042,43.862001,43.862996,43.862224,43.862277,43.86421,43.863512,43.86343,43.863417,43.863289,43.863611,43.8637200341693,43.91085]}]],[[{"lng":[-119.943441,-119.943504,-119.931595,-119.931944,-119.932611,-119.896969,-119.896465,-119.895056,-119.895163,-119.896581,-119.897434,-119.777528,-119.775402,-119.657183,-119.614325,-118.932024,-118.867264,-118.857192,-118.816931,-118.81689,-118.799711,-118.587172,-118.587125,-118.467308,-118.466299,-118.347859,-118.347856,-118.227645,-118.228107,-118.230291,-118.231731,-118.232392,-118.232171,-118.232178,-118.232011,-118.228069,-118.228618,-118.228683,-118.228673,-118.228793,-118.216832,-118.216384,-118.214698,-118.195281,-118.196857,-118.197369215928,-118.501002,-118.601806,-118.628692114981,-118.644698465629,-118.696409,-118.775869,-118.777228,-118.795612,-118.829630206433,-119.001022,-119.20828,-119.231876,-119.251033,-119.324182599298,-119.360121480893,-119.359446,-119.363579,-119.363648,-119.363896,-119.365156,-119.365337,-119.705858,-119.706005,-119.943779,-119.943441],"lat":[42.753671,42.917079,42.917005,42.976439,43.178963,43.179017,43.353816,43.568127,43.592745,43.611164,43.6982,43.697957,43.959086,43.95892,43.959593,43.960374,43.960462,43.960227,43.960733,44.047828,44.047775,44.046995,44.040266,44.040375,44.040374,44.040388,44.039075,44.039862,43.779195,43.779207,43.779216,43.612266,43.436775,43.43565,43.348959,43.348964,43.096791,43.086086,43.042817,42.914625,42.914703,42.805902,42.275891,42.275813,42.135279,41.9969940811635,41.995446,41.993895,41.9932978970796,41.9929424184721,41.991794,41.992692,41.992671,41.992394,41.9926256901358,41.993793,41.993177,41.994212,41.993843,41.9942055845967,41.9943837248054,42.13723,42.137231,42.220094,42.487079,42.661822,42.748958,42.748791,42.746605,42.746371,42.753671]}]],[[{"lng":[-122.867891,-122.857175,-122.851912,-122.846503,-122.846485,-122.846494,-122.843407,-122.842499,-122.825967,-122.82066,-122.807188,-122.805556,-122.80547,-122.787507,-122.786266,-122.784896,-122.769123,-122.764942,-122.75407,-122.746817,-122.743741,-122.743868,-122.743811,-122.743798,-122.743856,-122.743923,-122.743923,-122.743933,-122.743922,-122.743915,-122.743919,-122.743921,-122.743926,-122.743942,-122.743939,-122.743848,-122.743941,-122.743942,-122.743956,-122.743963,-122.743974,-122.744029,-122.74406,-122.744006,-122.743991,-122.743721,-122.741101,-122.738563,-122.733422,-122.7303,-122.725541,-122.721663,-122.721355,-122.719286,-122.715938,-122.712169,-122.707893,-122.705021,-122.703304,-122.702001,-122.701808,-122.698697,-122.697382,-122.694678,-122.682505,-122.681893,-122.675572,-122.673311,-122.672677,-122.666298,-122.666145,-122.660451,-122.654959,-122.648725,-122.648787,-122.651183,-122.646267,-122.64616,-122.647666,-122.651227,-122.652605,-122.658274,-122.659105,-122.660979,-122.656972,-122.652988,-122.652921,-122.646958,-122.641245,-122.64158,-122.636587,-122.63656,-122.632974,-122.626278,-122.622359,-122.618977,-122.618995,-122.618588,-122.618341,-122.616871,-122.616195,-122.615374,-122.613127,-122.610832,-122.608722,-122.606614,-122.60573,-122.60175,-122.601454,-122.599675,-122.597665,-122.59762,-122.597395,-122.597198,-122.597184,-122.596702,-122.596603,-122.596245,-122.58937,-122.586836,-122.58613,-122.5855,-122.583961,-122.57905,-122.571309,-122.570126,-122.568617,-122.565483,-122.558255,-122.55301,-122.548002,-122.547638,-122.537618,-122.532488,-122.530085,-122.527468,-122.517067,-122.514243,-122.510439,-122.507261,-122.504364,-122.501787,-122.501043,-122.499336,-122.496748,-122.486584,-122.485866,-122.479942,-122.47555,-122.474558,-122.47253,-122.468001,-122.466639,-122.45466,-122.447789,-122.443966,-122.439145,-122.414457,-122.41397,-122.403758,-122.389346,-122.383141,-122.372796,-122.372096,-122.357752,-122.348315,-122.342882,-122.316084,-122.305836,-122.2727,-122.263944,-122.249828,-122.249969,-122.166674,-122.147212,-122.126545,-122.126544,-122.085981,-122.004194,-121.983147,-121.983148,-121.821956,-121.821959,-121.819587,-121.815501,-121.814319,-121.810726,-121.806845,-121.805977,-121.807559,-121.807583,-121.80559,-121.805791,-121.807908,-121.806939,-121.806916,-121.80456,-121.802589,-121.799679,-121.796434,-121.794539,-121.793651,-121.792696,-121.790802,-121.785633,-121.783928,-121.780122,-121.776204,-121.773181,-121.766144,-121.762165,-121.756938,-121.744622,-121.738405,-121.735074,-121.732298,-121.730946,-121.726508,-121.72419,-121.723201,-121.720904,-121.716979,-121.714579,-121.708575,-121.705532,-121.704123,-121.700473,-121.699988,-121.698113,-121.696925,-121.69756,-121.700209,-121.699231,-121.700709,-121.700918,-121.702141,-121.70123,-121.701957,-121.703546,-121.70326,-121.704223,-121.704567,-121.703592,-121.702846,-121.70326,-121.702476,-121.700932,-121.698691,-121.697615,-121.693809,-121.691752,-121.689975,-121.688772,-121.687276,-121.687945,-121.685262,-121.683547,-121.68159,-121.679081,-121.679232,-121.680813,-121.679888,-121.68,-121.681973,-121.684562,-121.68505,-121.685033,-121.687532,-121.689008,-121.690481,-121.690732,-121.692134,-121.695032,-121.696479,-121.696411,-121.691878,-121.689261,-121.680898,-121.682463,-121.681537,-121.684793,-121.685304,-121.686262,-121.684475,-121.682607,-121.685082,-121.689772,-121.691112,-121.697685,-121.698375,-121.69945,-121.703592,-121.705971,-121.709251,-121.710517,-121.711275,-121.712953,-121.714469,-121.715592,-121.719697,-121.727341,-121.73048,-121.73492,-121.736292,-121.738512,-121.741175,-121.74687,-121.748245,-121.749061,-121.748649,-121.747973,-121.746454,-121.743454,-121.740329,-121.738794,-121.736506,-121.733403,-121.732018,-121.731438,-121.730168,-121.729226,-121.728533,-121.727194,-121.725283,-121.723999,-121.718675,-121.715716,-121.712219,-121.711596,-121.710503,-121.710201,-121.71065,-121.710291,-121.708402,-121.70805,-121.706179,-121.702383,-121.700208,-121.69865,-121.699675,-121.696085,-121.695074,-121.693387,-121.69088,-121.687776,-121.685005,-121.682723,-121.677722,-121.667021,-121.665717,-121.664694,-121.662881,-121.662382,-121.662415,-121.661656,-121.660444,-121.657245,-121.653866,-121.652638,-121.652581,-121.653315,-121.652732,-121.651394,-121.652018,-121.653593,-121.656909,-121.659639,-121.660828,-121.660419,-121.66043,-121.65871,-121.660852,-121.672405,-121.680346,-121.683277,-121.688164,-121.691214,-121.693396,-121.696035,-121.697656,-121.698143,-121.699939,-121.707639,-121.710813,-121.714462,-121.715266,-121.722584,-121.722407,-121.718977,-121.718681,-121.716996,-121.717652,-121.720814,-121.725175,-121.730625,-121.735545,-121.737791,-121.740994,-121.744103,-121.749443,-121.751454,-121.752152,-121.755915,-121.766495,-121.770738,-121.778672,-121.779906,-121.781727,-121.78183,-121.779672,-121.779132,-121.778803,-121.781121,-121.781588,-121.781098,-121.781958,-121.784556,-121.788805,-121.793219,-121.798154,-121.80044,-121.804426,-121.805269,-121.805667,-121.804406,-121.803163,-121.802547,-121.803471,-121.802935,-121.801623,-121.802626,-121.803345,-121.800131,-121.798684,-121.798502,-121.79603,-121.794783,-121.792475,-121.792162,-121.791112,-121.787787,-121.786147,-121.785593,-121.785612,-121.786735,-121.790661,-121.796127,-121.79511,-121.789703,-121.787028,-121.78285,-121.77977,-121.777156,-121.773775,-121.772236,-121.766527,-121.764083,-121.76256,-121.760379,-121.754124,-121.752417,-121.748452,-121.745436,-121.744453,-121.744585,-121.747324,-121.747297,-121.742614,-121.738297,-121.735372,-121.732821,-121.728994,-121.723005,-121.71456,-121.714854,-121.715592,-121.71822,-121.723013,-121.724519,-121.726138,-121.728208,-121.730737,-121.734396,-121.735253,-121.734223,-121.765322,-121.806706,-122.257482,-122.317709,-122.378871,-122.388999,-122.401021,-122.399655,-122.396057,-122.393936,-122.393227,-122.394475,-122.39354,-122.394498,-122.394349,-122.395774,-122.399554,-122.401663,-122.404145,-122.407737,-122.410428,-122.413982,-122.422733,-122.423551,-122.426441,-122.429684,-122.435193,-122.436643,-122.439655,-122.441487,-122.445521,-122.446968,-122.450045,-122.453594,-122.455185,-122.4585,-122.464204,-122.466492,-122.47126,-122.475125,-122.480324,-122.483507,-122.48619,-122.487974,-122.492889,-122.495627,-122.496329,-122.499167,-122.500908,-122.505316,-122.506406,-122.508106,-122.511494,-122.515898,-122.51585,-122.516997,-122.517542,-122.518934,-122.522276,-122.523985,-122.526335,-122.527397,-122.52966,-122.532858,-122.535472,-122.536946,-122.540368,-122.540574,-122.542187,-122.543205,-122.545409,-122.546099,-122.548613,-122.549216,-122.550897,-122.552009,-122.551783,-122.553144,-122.554761,-122.556847,-122.555943,-122.557935,-122.559757,-122.558937,-122.560126,-122.561605,-122.56115,-122.562859,-122.56507,-122.56476,-122.565592,-122.567212,-122.566342,-122.567385,-122.568801,-122.571483,-122.573,-122.576221,-122.579862,-122.58168,-122.586299,-122.588868,-122.592472,-122.594954,-122.595491,-122.593133,-122.594367,-122.593682,-122.593818,-122.594626,-122.593197,-122.593483,-122.593502,-122.594702,-122.593535,-122.595636,-122.594796,-122.595829,-122.59552,-122.599078,-122.602164,-122.609216,-122.61168,-122.616241,-122.618649,-122.623428,-122.626492,-122.629512,-122.631083,-122.633939,-122.635839,-122.63866,-122.639844,-122.643168,-122.644197,-122.646144,-122.647963,-122.649252,-122.650233,-122.653581,-122.657523,-122.658507,-122.660029,-122.662537,-122.666038,-122.669637,-122.673705,-122.677361,-122.677936,-122.68152,-122.681147,-122.685747,-122.689571,-122.69464,-122.699104,-122.700829,-122.705237,-122.704641,-122.70536,-122.707425,-122.707287,-122.711949,-122.714132,-122.717097,-122.718753,-122.717886,-122.720723,-122.721141,-122.719677,-122.722655,-122.723727,-122.725293,-122.725607,-122.729745,-122.729595,-122.732936,-122.736633,-122.737647,-122.739652,-122.740594,-122.743301,-122.744146,-122.745578,-122.746317,-122.748307,-122.749968,-122.748752,-122.74984,-122.752579,-122.753353,-122.755755,-122.757254,-122.760276,-122.760977,-122.762126,-122.763246,-122.763984,-122.765164,-122.764789,-122.765616,-122.766302,-122.767681,-122.766995,-122.769068,-122.7707,-122.773366,-122.773903,-122.775889,-122.774314,-122.776307,-122.776942,-122.775718,-122.776187,-122.777586,-122.777663,-122.781786,-122.782827,-122.782815,-122.785493,-122.786549,-122.788505,-122.786627,-122.78538,-122.786313,-122.784888,-122.780824,-122.779965,-122.781352,-122.780652,-122.782013,-122.782884,-122.78211,-122.779564,-122.780383,-122.779835,-122.778455,-122.778553,-122.776847,-122.776907,-122.775109,-122.774156,-122.772894,-122.772035,-122.770026,-122.772065,-122.773305,-122.774752,-122.773688,-122.771475,-122.769712,-122.768112,-122.766605,-122.763332,-122.762055,-122.760535,-122.759894,-122.7619,-122.756883,-122.756696,-122.759303,-122.757657,-122.756386,-122.754149,-122.756842,-122.75439,-122.752463,-122.751894,-122.752724,-122.756569,-122.757844,-122.760134,-122.760358,-122.754911,-122.756151,-122.757919,-122.758214,-122.756239,-122.7544,-122.753184,-122.753841,-122.756522,-122.753884,-122.753413,-122.755088,-122.756638,-122.759434,-122.760415,-122.759871,-122.757517,-122.755534,-122.75652,-122.753163,-122.751459,-122.751833,-122.754896,-122.754437,-122.751348,-122.751611,-122.749815,-122.750561,-122.750461,-122.752691,-122.754369,-122.753159,-122.753648,-122.75639,-122.757403,-122.758803,-122.759494,-122.758267,-122.75582,-122.757473,-122.754592,-122.752483,-122.752237,-122.753886,-122.753387,-122.748307,-122.747358,-122.748557,-122.745399,-122.747201,-122.748091,-122.746621,-122.747151,-122.746712,-122.748913,-122.749779,-122.752533,-122.75186,-122.748109,-122.747274,-122.746774,-122.74563,-122.745299,-122.747765,-122.749821,-122.750085,-122.750739,-122.749784,-122.747736,-122.749131,-122.75124,-122.750248,-122.751948,-122.749958,-122.749828,-122.751113,-122.750062,-122.747134,-122.747534,-122.745653,-122.744481,-122.744258,-122.743964,-122.743741,-122.743598,-122.743512,-122.743481,-122.743483,-122.74445,-122.742709,-122.74112,-122.741516,-122.738988,-122.73926,-122.784756,-122.784857,-122.784898,-122.7849,-122.832856,-122.834576,-122.834765,-122.837929,-122.842326,-122.846224,-122.84674,-122.849872,-122.849925,-122.868073,-122.867891],"lat":[45.317345,45.317273,45.317228,45.317192,45.328151,45.34595,45.346154,45.346133,45.346249,45.346233,45.346276,45.34566,45.331772,45.33182,45.33182,45.331825,45.331909,45.331928,45.331994,45.332045,45.332067,45.346587,45.353992,45.355871,45.359577,45.371751,45.372181,45.375538,45.377431,45.381513,45.386122,45.386845,45.387483,45.391704,45.393033,45.396544,45.402592,45.402702,45.404972,45.406149,45.407918,45.415311,45.418855,45.421046,45.426072,45.433294,45.433268,45.433238,45.433199,45.43324,45.433167,45.433137,45.433135,45.433113,45.433079,45.433056,45.433042,45.433037,45.433038,45.433056,45.433041,45.433041,45.433041,45.43301,45.432841,45.432841,45.432867,45.432795,45.432792,45.432743,45.432743,45.432702,45.432668,45.432718,45.432811,45.436059,45.439584,45.441424,45.443983,45.445281,45.445741,45.453242,45.454341,45.457819,45.458066,45.458314,45.458318,45.458669,45.458671,45.461482,45.461476,45.461474,45.46155,45.461451,45.461444,45.461451,45.460908,45.460933,45.460832,45.460889,45.461473,45.461481,45.461493,45.461501,45.461505,45.461493,45.461488,45.461486,45.461464,45.461454,45.461453,45.461453,45.461457,45.461457,45.461457,45.461458,45.461458,45.461458,45.46149,45.461522,45.461483,45.461487,45.461494,45.461518,45.461392,45.46138,45.461365,45.461307,45.461062,45.461053,45.461045,45.461058,45.461353,45.461318,45.461296,45.461273,45.461262,45.46126,45.461256,45.461252,45.461187,45.461107,45.46107,45.461028,45.460982,45.461132,45.461138,45.461176,45.461183,45.461184,45.461173,45.461135,45.461127,45.460941,45.460974,45.461001,45.461134,45.461579,45.461581,45.461421,45.4613,45.461276,45.46123,45.461222,45.461426,45.461502,45.461529,45.46149,45.461439,45.461394,45.461412,45.461422,45.460935,45.460837,45.460828,45.460039,45.461299,45.46058,45.461534,45.461403,45.460237,45.460226,45.461674,45.461675,45.459678,45.457968,45.455518,45.454649,45.451832,45.450143,45.448983,45.444307,45.443096,45.442561,45.440485,45.435494,45.432929,45.431927,45.427854,45.427171,45.424228,45.418572,45.415174,45.415202,45.412164,45.4101,45.407275,45.402672,45.402457,45.403433,45.402844,45.401105,45.397261,45.397131,45.395664,45.395593,45.394798,45.393784,45.393648,45.39177,45.3894,45.387131,45.386754,45.383619,45.383545,45.381733,45.378531,45.376309,45.373838,45.373564,45.371963,45.369899,45.368338,45.366277,45.364545,45.363389,45.356172,45.35187,45.349016,45.346629,45.344448,45.339223,45.338957,45.334258,45.331267,45.329188,45.327889,45.323929,45.322947,45.321348,45.319453,45.316379,45.309477,45.306251,45.30503,45.30306,45.300714,45.299775,45.297177,45.295895,45.294816,45.292672,45.290025,45.287942,45.286259,45.283681,45.281798,45.279234,45.276153,45.275625,45.271641,45.268412,45.263859,45.25792,45.255359,45.254141,45.251348,45.250581,45.247204,45.243495,45.240067,45.235873,45.233301,45.230368,45.228988,45.228409,45.22965,45.229558,45.227391,45.226448,45.224054,45.2233,45.221466,45.21998,45.21847,45.215347,45.212368,45.21133,45.210941,45.211691,45.212044,45.211543,45.208963,45.206919,45.206156,45.206788,45.205997,45.2051,45.197559,45.1918,45.188995,45.18635,45.183795,45.182227,45.180374,45.176313,45.174913,45.170913,45.170633,45.170314,45.168594,45.164721,45.161556,45.159339,45.158354,45.156838,45.154039,45.153424,45.152824,45.150597,45.148733,45.143283,45.14039,45.137271,45.134055,45.131594,45.129102,45.127066,45.123789,45.12179,45.118883,45.117392,45.116934,45.11806,45.122474,45.12369,45.123572,45.12236,45.120519,45.11972,45.115172,45.114456,45.11335,45.107592,45.105425,45.104415,45.103177,45.102852,45.101992,45.099886,45.098582,45.097111,45.088803,45.086706,45.084943,45.082515,45.079635,45.075258,45.073623,45.069473,45.066355,45.066362,45.067683,45.068111,45.068012,45.067109,45.065692,45.06365,45.062866,45.061626,45.059579,45.05852,45.057054,45.055912,45.053214,45.051756,45.045432,45.044095,45.042325,45.039285,45.038037,45.037566,45.036915,45.036784,45.036182,45.034668,45.033616,45.034428,45.03385,45.034098,45.034836,45.036162,45.037218,45.03958,45.039837,45.037277,45.035136,45.034399,45.033698,45.031646,45.030126,45.026237,45.021486,45.018144,45.016312,45.015214,45.015132,45.016028,45.017471,45.01615,45.015183,45.012877,45.011496,45.006124,45.002217,44.999614,44.995386,44.992173,44.987321,44.982743,44.981021,44.977103,44.976452,44.974963,44.973167,44.970487,44.964926,44.959666,44.95786,44.956569,44.95477,44.952248,44.950377,44.947412,44.945223,44.941371,44.937426,44.935668,44.934682,44.935457,44.935654,44.935153,44.936857,44.938213,44.93984,44.941721,44.941952,44.941233,44.938447,44.932036,44.93057,44.927539,44.923042,44.920925,44.91983,44.917166,44.914636,44.912122,44.910179,44.907761,44.906819,44.904814,44.906315,44.90613,44.90277,44.900018,44.89745,44.896167,44.895375,44.893142,44.891348,44.890799,44.88931,44.888473,44.88572,44.885719,44.88572,44.88572,44.88572,44.885716,44.88572,44.88572,44.886262,44.889461,44.890411,44.891673,44.893745,44.895326,44.896804,44.899106,44.901513,44.904077,44.903796,44.904679,44.905012,44.903207,44.903949,44.904154,44.903461,44.903142,44.902029,44.903297,44.90295,44.90407,44.903958,44.906108,44.908139,44.910375,44.911579,44.913152,44.915212,44.916363,44.915471,44.917318,44.918395,44.921567,44.921549,44.922659,44.921358,44.920914,44.919965,44.919034,44.917781,44.918567,44.918332,44.91951,44.919599,44.922628,44.927857,44.929833,44.930043,44.932797,44.933534,44.934565,44.935681,44.936046,44.935156,44.935035,44.937446,44.936684,44.939975,44.943562,44.945139,44.945665,44.948872,44.949182,44.950115,44.950425,44.954172,44.954646,44.95626,44.957953,44.959177,44.959405,44.961426,44.962863,44.963588,44.965195,44.967159,44.969355,44.970562,44.971395,44.973208,44.973904,44.975131,44.977266,44.978628,44.980206,44.982564,44.983735,44.98521,44.985101,44.986044,44.985983,44.988407,44.988748,44.989629,44.988875,44.99089,44.992781,44.995429,44.996424,44.997588,45.00001,45.00081,45.003442,45.004531,45.006866,45.009501,45.012247,45.013907,45.016304,45.017789,45.01962,45.020549,45.021784,45.021866,45.024354,45.025,45.026964,45.028271,45.028355,45.030057,45.032175,45.033795,45.033418,45.031682,45.031442,45.032126,45.03377,45.033754,45.032445,45.032454,45.035844,45.035458,45.035768,45.035877,45.037081,45.038637,45.043633,45.046532,45.047052,45.046514,45.046314,45.047789,45.050296,45.052439,45.053471,45.054055,45.055997,45.057489,45.05929,45.061008,45.061957,45.062479,45.064479,45.067162,45.069124,45.069888,45.072405,45.074183,45.0758,45.077761,45.079641,45.081425,45.083141,45.082868,45.085653,45.087275,45.088244,45.092173,45.093478,45.094204,45.094286,45.095987,45.096291,45.098606,45.099676,45.102757,45.102063,45.103315,45.105482,45.10772,45.107061,45.110084,45.110444,45.111851,45.111575,45.112905,45.112597,45.113867,45.112386,45.11301,45.114389,45.115813,45.114627,45.114868,45.115745,45.1167,45.118255,45.117758,45.119241,45.118832,45.120228,45.121021,45.121981,45.122449,45.123511,45.123531,45.122446,45.124861,45.124528,45.126177,45.127566,45.129344,45.130356,45.130538,45.132497,45.133732,45.135904,45.137743,45.139388,45.140148,45.141555,45.141717,45.143852,45.145019,45.146571,45.147702,45.148922,45.149192,45.151118,45.151644,45.153233,45.153446,45.155281,45.155645,45.157689,45.159421,45.159579,45.160965,45.16182,45.163454,45.163004,45.16167,45.163073,45.163304,45.167946,45.169203,45.169575,45.170901,45.171984,45.172802,45.174712,45.175159,45.177512,45.178058,45.177444,45.179577,45.180131,45.18098,45.182194,45.18265,45.182445,45.183093,45.182647,45.183565,45.184699,45.186249,45.185891,45.186873,45.187131,45.186135,45.187517,45.18822,45.188847,45.189178,45.190158,45.191576,45.191249,45.189771,45.19142,45.194733,45.195719,45.19542,45.193098,45.19176,45.192758,45.193742,45.195927,45.196745,45.195862,45.194701,45.194959,45.197682,45.199202,45.200024,45.199926,45.201089,45.201832,45.202085,45.200599,45.200705,45.203317,45.205555,45.20697,45.209145,45.208981,45.209758,45.210801,45.21165,45.212319,45.211034,45.212283,45.214153,45.215953,45.217883,45.22069,45.221665,45.223337,45.225199,45.227217,45.229017,45.228835,45.23017,45.231213,45.231025,45.229255,45.230095,45.232772,45.233478,45.231969,45.233603,45.235042,45.236119,45.235692,45.238205,45.238406,45.24053,45.242542,45.243364,45.244329,45.245342,45.247278,45.249281,45.252235,45.252059,45.250772,45.250775,45.250826,45.250906,45.250982,45.251193,45.251356,45.251553,45.253319,45.256638,45.257031,45.258664,45.259532,45.259532,45.259575,45.261833,45.273887,45.274069,45.274053,45.274058,45.273822,45.26955,45.265657,45.261773,45.261388,45.259717,45.259697,45.259695,45.317345]}]],[[{"lng":[-123.180908,-123.180532,-123.178468,-123.174215,-123.170891,-123.16781,-123.1616,-123.155436,-123.152597,-123.149402,-123.147924,-123.147995,-123.146617,-123.144973,-123.141485,-123.13733,-123.134498,-123.13309,-123.132383,-123.13017,-123.128245,-123.125287,-123.123769,-123.120462,-123.116542,-123.11321,-123.108792,-123.107108,-123.108165,-123.110396,-123.1123,-123.112769,-123.111472,-123.109725,-123.105091,-123.093008,-123.091347,-123.082998,-123.081694,-123.076574,-123.072813,-123.071687,-123.06993,-123.067478,-123.062005,-123.060074,-123.054933,-123.0496,-123.044433,-123.043631,-123.042906,-123.042127,-123.04148,-123.039822,-123.038095,-123.037897,-123.038923,-123.037566,-123.036985,-123.037316,-123.037807,-123.037779,-123.037594,-123.037374,-123.037897,-123.040164,-123.040529,-123.040853,-123.041717,-123.042938,-123.047081,-123.051824,-123.053762,-123.05465,-123.055299,-123.058089,-123.064261,-123.065415,-123.066938,-123.068685,-123.069219,-123.071977,-123.074723,-123.075577,-123.075174,-123.075113,-123.074284,-123.073539,-123.072732,-123.070654,-123.068975,-123.068849,-123.067835,-123.067043,-123.065974,-123.06603,-123.066732,-123.068079,-123.068271,-123.068627,-123.067619,-123.062251,-123.059397,-123.051936,-123.046115,-123.044916,-123.041478,-123.036121,-123.033439,-123.027643,-123.018118,-123.014574,-123.009998,-123.008255,-123.005564,-123.002309,-122.999042,-122.996444,-122.998002,-123.001054,-123.007494,-123.009878,-123.012235,-123.015037,-123.020187,-123.022368,-123.025303,-123.028136,-123.031177,-123.031676,-123.032027,-123.032467,-123.033292,-123.033173,-123.031407,-123.028875,-123.02705,-123.023019,-123.01801,-123.011513,-123.007346,-123.003569,-123.000726,-123.001883,-123.007746,-123.011189,-123.014505,-123.015382,-123.01624,-123.018862,-123.019124,-123.018777,-123.020521,-123.022219,-123.024949,-123.028675,-123.036649,-123.041321,-123.043892,-123.045896,-123.047009,-123.049662,-123.050918,-123.051106,-123.049012,-123.046867,-123.044146,-123.04117,-123.038475,-123.035667,-123.02609,-123.007632,-123.003867,-122.999659,-122.997737,-122.996221,-122.995366,-122.995576,-122.996087,-122.996469,-122.997702,-122.998455,-122.998984,-123.001527,-123.001497,-123.000788,-122.999811,-122.999265,-122.996046,-122.99097,-122.98831,-122.981086,-122.977037,-122.975052,-122.974937,-122.974957,-122.974911,-122.974699,-122.971659,-122.967579,-122.964021,-122.9623,-122.961195,-122.959922,-122.958818,-122.957273,-122.954429,-122.952144,-122.949691,-122.947317,-122.943419,-122.932081,-122.928984,-122.92513,-122.922836,-122.919112,-122.916561,-122.912621,-122.908708,-122.904219,-122.899528,-122.898048,-122.893198,-122.889006,-122.886812,-122.882494,-122.881015,-122.879136,-122.872906,-122.867179,-122.86352,-122.858823,-122.854691,-122.849925,-122.849872,-122.84674,-122.846224,-122.842326,-122.837929,-122.834765,-122.834576,-122.832856,-122.7849,-122.784898,-122.784857,-122.784756,-122.73926,-122.738988,-122.741516,-122.74112,-122.742709,-122.74445,-122.743483,-122.743481,-122.743512,-122.743598,-122.743741,-122.743964,-122.744258,-122.744481,-122.745653,-122.747534,-122.747134,-122.750062,-122.751113,-122.749828,-122.749958,-122.751948,-122.750248,-122.75124,-122.749131,-122.747736,-122.749784,-122.750739,-122.750085,-122.749821,-122.747765,-122.745299,-122.74563,-122.746774,-122.747274,-122.748109,-122.75186,-122.752533,-122.749779,-122.748913,-122.746712,-122.747151,-122.746621,-122.748091,-122.747201,-122.745399,-122.748557,-122.747358,-122.748307,-122.753387,-122.753886,-122.752237,-122.752483,-122.754592,-122.757473,-122.75582,-122.758267,-122.759494,-122.758803,-122.757403,-122.75639,-122.753648,-122.753159,-122.754369,-122.752691,-122.750461,-122.750561,-122.749815,-122.751611,-122.751348,-122.754437,-122.754896,-122.751833,-122.751459,-122.753163,-122.75652,-122.755534,-122.757517,-122.759871,-122.760415,-122.759434,-122.756638,-122.755088,-122.753413,-122.753884,-122.756522,-122.753841,-122.753184,-122.7544,-122.756239,-122.758214,-122.757919,-122.756151,-122.754911,-122.760358,-122.760134,-122.757844,-122.756569,-122.752724,-122.751894,-122.752463,-122.75439,-122.756842,-122.754149,-122.756386,-122.757657,-122.759303,-122.756696,-122.756883,-122.7619,-122.759894,-122.760535,-122.762055,-122.763332,-122.766605,-122.768112,-122.769712,-122.771475,-122.773688,-122.774752,-122.773305,-122.772065,-122.770026,-122.772035,-122.772894,-122.774156,-122.775109,-122.776907,-122.776847,-122.778553,-122.778455,-122.779835,-122.780383,-122.779564,-122.78211,-122.782884,-122.782013,-122.780652,-122.781352,-122.779965,-122.780824,-122.784888,-122.786313,-122.78538,-122.786627,-122.788505,-122.786549,-122.785493,-122.782815,-122.782827,-122.781786,-122.777663,-122.777586,-122.776187,-122.775718,-122.776942,-122.776307,-122.774314,-122.775889,-122.773903,-122.773366,-122.7707,-122.769068,-122.766995,-122.767681,-122.766302,-122.765616,-122.764789,-122.765164,-122.763984,-122.763246,-122.762126,-122.760977,-122.760276,-122.757254,-122.755755,-122.753353,-122.752579,-122.74984,-122.748752,-122.749968,-122.748307,-122.746317,-122.745578,-122.744146,-122.743301,-122.740594,-122.739652,-122.737647,-122.736633,-122.732936,-122.729595,-122.729745,-122.725607,-122.725293,-122.723727,-122.722655,-122.719677,-122.721141,-122.720723,-122.717886,-122.718753,-122.717097,-122.714132,-122.711949,-122.707287,-122.707425,-122.70536,-122.704641,-122.705237,-122.700829,-122.699104,-122.69464,-122.689571,-122.685747,-122.681147,-122.68152,-122.677936,-122.677361,-122.673705,-122.669637,-122.666038,-122.662537,-122.660029,-122.658507,-122.657523,-122.653581,-122.650233,-122.649252,-122.647963,-122.646144,-122.644197,-122.643168,-122.639844,-122.63866,-122.635839,-122.633939,-122.631083,-122.629512,-122.626492,-122.623428,-122.618649,-122.616241,-122.61168,-122.609216,-122.602164,-122.599078,-122.59552,-122.595829,-122.594796,-122.595636,-122.593535,-122.594702,-122.593502,-122.593483,-122.593197,-122.594626,-122.593818,-122.593682,-122.594367,-122.593133,-122.595491,-122.594954,-122.592472,-122.588868,-122.586299,-122.58168,-122.579862,-122.576221,-122.573,-122.571483,-122.568801,-122.567385,-122.566342,-122.567212,-122.565592,-122.56476,-122.56507,-122.562859,-122.56115,-122.561605,-122.560126,-122.558937,-122.559757,-122.557935,-122.555943,-122.556847,-122.554761,-122.553144,-122.551783,-122.552009,-122.550897,-122.549216,-122.548613,-122.546099,-122.545409,-122.543205,-122.542187,-122.540574,-122.540368,-122.536946,-122.535472,-122.532858,-122.52966,-122.527397,-122.526335,-122.523985,-122.522276,-122.518934,-122.517542,-122.516997,-122.51585,-122.515898,-122.511494,-122.508106,-122.506406,-122.505316,-122.500908,-122.499167,-122.496329,-122.495627,-122.492889,-122.487974,-122.48619,-122.483507,-122.480324,-122.475125,-122.47126,-122.466492,-122.464204,-122.4585,-122.455185,-122.453594,-122.450045,-122.446968,-122.445521,-122.441487,-122.439655,-122.436643,-122.435193,-122.429684,-122.426441,-122.423551,-122.422733,-122.413982,-122.410428,-122.407737,-122.404145,-122.401663,-122.399554,-122.395774,-122.394349,-122.394498,-122.39354,-122.394475,-122.393227,-122.393936,-122.396057,-122.399655,-122.401021,-122.388999,-122.378871,-122.317709,-122.257482,-121.806706,-121.765322,-121.734223,-121.733528,-121.736936,-121.739922,-121.746221,-121.747741,-121.747874,-121.750034,-121.753182,-121.751069,-121.748587,-121.742406,-121.741864,-121.742441,-121.745258,-121.746671,-121.750261,-121.752994,-121.753589,-121.759991,-121.76252,-121.764831,-121.767978,-121.775926,-121.781753,-121.787132,-121.790183,-121.792116,-121.796409,-121.803883,-121.808137,-121.812221,-121.811363,-121.810174,-121.813063,-121.813663,-121.816998,-121.820278,-121.819663,-121.820254,-121.817693,-121.816517,-121.816436,-121.817212,-121.817809,-121.819137,-121.817386,-121.813655,-121.81202,-121.810296,-121.80762,-121.806653,-121.804304,-121.804413,-121.801536,-121.798998,-121.796831,-121.795963,-121.79151,-121.789999,-121.784961,-121.783621,-121.779924,-121.778305,-121.776323,-121.773183,-121.772449,-121.771593,-121.769125,-121.769206,-121.76661,-121.763225,-121.761005,-121.759958,-121.762002,-121.768218,-121.772321,-121.775652,-121.774175,-121.780168,-121.782569,-121.788203,-121.788525,-121.79161,-121.792298,-121.795075,-121.797222,-121.800219,-121.799458,-121.802779,-121.804597,-121.802682,-121.798109,-121.79695,-121.794385,-121.795643,-121.79528,-121.795864,-121.795797,-121.796107,-121.796704,-121.797833,-121.798174,-121.802109,-121.802922,-121.800479,-121.797651,-121.796565,-121.797009,-121.796635,-121.795481,-121.793604,-121.793329,-121.790022,-121.788944,-121.787179,-121.788859,-121.793238,-121.794599,-121.799562,-121.963805,-121.964997,-121.966375,-121.967345,-121.971604,-121.973503,-121.974303,-121.977179,-121.980176,-121.981681,-121.984527,-121.992926,-121.996208,-121.999761,-122.001009,-122.003216,-122.005291,-122.008804,-122.011684,-122.015715,-122.016709,-122.01847,-122.020851,-122.024106,-122.026339,-122.028916,-122.030498,-122.033006,-122.034171,-122.03598,-122.040875,-122.045304,-122.046094,-122.047028,-122.050762,-122.054415,-122.056484,-122.058813,-122.060621,-122.063939,-122.065765,-122.068144,-122.069796,-122.071823,-122.074393,-122.075401,-122.077104,-122.081091,-122.08412,-122.086244,-122.088617,-122.09404,-122.096559,-122.100326,-122.103815,-122.107563,-122.108719,-122.110688,-122.11344,-122.118702,-122.119828,-122.119821,-122.121442,-122.122466,-122.124247,-122.128698,-122.130972,-122.132685,-122.138702,-122.14237,-122.149224,-122.152774,-122.154325,-122.156292,-122.161118,-122.164191,-122.166572,-122.171843,-122.174251,-122.178684,-122.179739,-122.184557,-122.189405,-122.193924,-122.196732,-122.198046,-122.198685,-122.199334,-122.204021,-122.207421,-122.210663,-122.21445,-122.218413,-122.220719,-122.222145,-122.224659,-122.22769,-122.23037,-122.231438,-122.23292,-122.237408,-122.23706,-122.242203,-122.245971,-122.246528,-122.247582,-122.250044,-122.253592,-122.255066,-122.255448,-122.259394,-122.261423,-122.264381,-122.269612,-122.271886,-122.273067,-122.274,-122.27376,-122.276675,-122.278591,-122.282872,-122.288569,-122.292897,-122.300164,-122.302935,-122.306909,-122.308786,-122.311568,-122.317447,-122.318858,-122.32137,-122.325742,-122.328534,-122.333374,-122.334685,-122.340708,-122.343213,-122.34955,-122.354329,-122.35614,-122.362732,-122.370076,-122.372462,-122.378629,-122.382079,-122.38863,-122.39138,-122.394416,-122.397991,-122.400882,-122.4027,-122.406298,-122.408208,-122.41,-122.41099,-122.411198,-122.410944,-122.410988,-122.411213,-122.412346,-122.419433,-122.423287,-122.428316,-122.431319,-122.435041,-122.436918,-122.44036,-122.441817,-122.442151,-122.443103,-122.443897,-122.454774,-122.457333,-122.46124,-122.469302,-122.473551,-122.475835,-122.475968,-122.475677,-122.477499,-122.480122,-122.484798,-122.487637,-122.496565,-122.503151,-122.50559,-122.511612,-122.519439,-122.520605,-122.520625,-122.52245,-122.522561,-122.52029,-122.521912,-122.531042,-122.532911,-122.536666,-122.538944,-122.541561,-122.542407,-122.546669,-122.553888,-122.56151,-122.564402,-122.56693,-122.568195,-122.568548,-122.569953,-122.5701,-122.572269,-122.576929,-122.582836,-122.597363,-122.599469,-122.603458,-122.607766,-122.61524,-122.618014,-122.620463,-122.621327,-122.627139,-122.634129,-122.639144,-122.64073,-122.645826,-122.65029,-122.653472,-122.660327,-122.66985,-122.670774,-122.677492,-122.680574,-122.683555,-122.690864,-122.694844,-122.696463,-122.700531,-122.705411,-122.713778,-122.715588,-122.719631,-122.721705,-122.724795,-122.726418,-122.727945,-122.729355,-122.732714,-122.737302,-122.743446,-122.748027,-122.753221,-122.757763,-122.759186,-122.762124,-122.763398,-122.765303,-122.768613,-122.773998,-122.778248,-122.779831,-122.783465,-122.787691,-122.793327,-122.794418,-122.800709,-122.804166,-122.803195,-122.805408,-122.807949,-122.812321,-122.813636,-122.813769,-122.815899,-122.819465,-122.821487,-122.825426,-122.828925,-122.832797,-122.839136,-122.839763,-122.842851,-122.845145,-122.847178,-122.848492,-122.846935,-122.8471,-122.849696,-122.852323,-122.856157,-122.861237,-122.864965,-122.868847,-122.871689,-122.873219,-122.873245,-122.87453,-122.882731,-122.884958,-122.890258,-122.891829,-122.892398,-122.895184,-122.897648,-122.899397,-122.900612,-122.902456,-122.90538,-122.906842,-122.909232,-122.909888,-122.913298,-122.916886,-122.919518,-122.919464,-122.922578,-122.925638,-122.928097,-122.929887,-122.929381,-122.931922,-122.93408,-122.937846,-122.943228,-122.947659,-122.949349,-122.955481,-122.957256,-122.962703,-122.964661,-122.969086,-122.971694,-122.97265,-122.97364,-122.973993,-122.973649,-122.974427,-122.975862,-122.979769,-122.985042,-122.986746,-122.988675,-122.990027,-122.991695,-122.993648,-122.996175,-122.998293,-122.997623,-122.996025,-122.996297,-122.998717,-123.000013,-123.001831,-123.004903,-123.005477,-123.006847,-123.007595,-123.010604,-123.01133,-123.012491,-123.013065,-123.01383,-123.014599,-123.015982,-123.018107,-123.018367,-123.018598,-123.018734,-123.018747,-123.018679,-123.017345,-123.016551,-123.015765,-123.015049,-123.014433,-123.013824,-123.013866,-123.01474,-123.01509,-123.015148,-123.015825,-123.016667,-123.018153,-123.019999,-123.024002,-123.027127,-123.031884,-123.034095,-123.035804,-123.03941,-123.041567,-123.042756,-123.041897,-123.039451,-123.039828,-123.039988,-123.040809,-123.041354,-123.042037,-123.043527,-123.044987,-123.050025,-123.053026,-123.055342,-123.060106,-123.061853,-123.061431,-123.060721,-123.061117,-123.062154,-123.066818,-123.07173,-123.076375,-123.078903,-123.081389,-123.086457,-123.089503,-123.092658,-123.095772,-123.099242,-123.100881,-123.105377,-123.106032,-123.107712,-123.111578,-123.113025,-123.118721,-123.120253,-123.119733,-123.120155,-123.123007,-123.12769,-123.133831,-123.13696,-123.139759,-123.142191,-123.143843,-123.145463,-123.147833,-123.148411,-123.148333,-123.14752,-123.145812,-123.144012,-123.140101,-123.137656,-123.133628,-123.132924,-123.131328,-123.129627,-123.128571,-123.126787,-123.125807,-123.124779,-123.122064,-123.117983,-123.110229,-123.102131,-123.097713,-123.095698,-123.09199,-123.091349,-123.091479,-123.093335,-123.101167,-123.103566,-123.109462,-123.1114,-123.118528,-123.126252,-123.131734,-123.140136,-123.143754,-123.149254,-123.151364,-123.152849,-123.154541,-123.158928,-123.166472,-123.169856,-123.173863,-123.17778,-123.179387,-123.179555,-123.179677,-123.179758,-123.179829,-123.18001,-123.180117,-123.179881,-123.179857,-123.180122,-123.180944,-123.180908],"lat":[44.857553,44.858765,44.861006,44.863534,44.864462,44.864022,44.861579,44.860009,44.860059,44.861254,44.863181,44.866795,44.870722,44.877305,44.88374,44.887259,44.889368,44.891904,44.894683,44.90073,44.904764,44.909273,44.910536,44.912185,44.913242,44.914782,44.917505,44.920337,44.92249,44.923826,44.926012,44.928728,44.930161,44.930863,44.93044,44.930541,44.930297,44.927167,44.926878,44.926914,44.927686,44.928107,44.92905,44.932214,44.936207,44.937885,44.940694,44.942701,44.944231,44.94495,44.945975,44.947098,44.948114,44.95165,44.95657,44.958779,44.961154,44.965581,44.967428,44.972795,44.975841,44.977463,44.979621,44.981139,44.984421,44.988153,44.988502,44.98877,44.989381,44.990026,44.991041,44.990302,44.989928,44.989868,44.989826,44.989368,44.989778,44.990718,44.995005,44.998378,45.000505,45.008897,45.012533,45.014513,45.017489,45.021657,45.02584,45.031314,45.033397,45.036599,45.041493,45.046709,45.054188,45.060738,45.068042,45.069102,45.071438,45.074288,45.074864,45.076586,45.078925,45.082673,45.083942,45.086332,45.089197,45.090273,45.094073,45.097729,45.098953,45.100555,45.100961,45.101967,45.105444,45.107235,45.111091,45.11311,45.114694,45.117631,45.120604,45.123249,45.127319,45.129273,45.133769,45.136757,45.138747,45.139431,45.140185,45.141313,45.144303,45.144999,45.145564,45.146614,45.150825,45.153831,45.15794,45.160852,45.161894,45.162905,45.162765,45.160252,45.159498,45.161321,45.16452,45.167365,45.170955,45.173053,45.175796,45.177017,45.181566,45.189247,45.191003,45.19584,45.199841,45.201121,45.202051,45.201943,45.199434,45.198918,45.199481,45.201105,45.204744,45.207266,45.209391,45.211305,45.214705,45.216583,45.21828,45.220788,45.222272,45.222789,45.223224,45.222137,45.22217,45.223696,45.226947,45.230698,45.233981,45.237426,45.238305,45.238752,45.239953,45.241311,45.242731,45.254877,45.257284,45.259347,45.26085,45.261554,45.264811,45.267714,45.268761,45.271011,45.273321,45.276226,45.276928,45.278081,45.279143,45.279979,45.283041,45.285083,45.284894,45.28388,45.282982,45.281837,45.280509,45.278695,45.273639,45.270488,45.26826,45.267485,45.267586,45.268499,45.268621,45.268635,45.268509,45.268065,45.267445,45.266203,45.262835,45.259435,45.256719,45.256622,45.257798,45.257491,45.256531,45.255211,45.254827,45.254425,45.253827,45.252972,45.253084,45.254719,45.257252,45.259697,45.259717,45.261388,45.261773,45.265657,45.26955,45.273822,45.274058,45.274053,45.274069,45.273887,45.261833,45.259575,45.259532,45.259532,45.258664,45.257031,45.256638,45.253319,45.251553,45.251356,45.251193,45.250982,45.250906,45.250826,45.250775,45.250772,45.252059,45.252235,45.249281,45.247278,45.245342,45.244329,45.243364,45.242542,45.24053,45.238406,45.238205,45.235692,45.236119,45.235042,45.233603,45.231969,45.233478,45.232772,45.230095,45.229255,45.231025,45.231213,45.23017,45.228835,45.229017,45.227217,45.225199,45.223337,45.221665,45.22069,45.217883,45.215953,45.214153,45.212283,45.211034,45.212319,45.21165,45.210801,45.209758,45.208981,45.209145,45.20697,45.205555,45.203317,45.200705,45.200599,45.202085,45.201832,45.201089,45.199926,45.200024,45.199202,45.197682,45.194959,45.194701,45.195862,45.196745,45.195927,45.193742,45.192758,45.19176,45.193098,45.19542,45.195719,45.194733,45.19142,45.189771,45.191249,45.191576,45.190158,45.189178,45.188847,45.18822,45.187517,45.186135,45.187131,45.186873,45.185891,45.186249,45.184699,45.183565,45.182647,45.183093,45.182445,45.18265,45.182194,45.18098,45.180131,45.179577,45.177444,45.178058,45.177512,45.175159,45.174712,45.172802,45.171984,45.170901,45.169575,45.169203,45.167946,45.163304,45.163073,45.16167,45.163004,45.163454,45.16182,45.160965,45.159579,45.159421,45.157689,45.155645,45.155281,45.153446,45.153233,45.151644,45.151118,45.149192,45.148922,45.147702,45.146571,45.145019,45.143852,45.141717,45.141555,45.140148,45.139388,45.137743,45.135904,45.133732,45.132497,45.130538,45.130356,45.129344,45.127566,45.126177,45.124528,45.124861,45.122446,45.123531,45.123511,45.122449,45.121981,45.121021,45.120228,45.118832,45.119241,45.117758,45.118255,45.1167,45.115745,45.114868,45.114627,45.115813,45.114389,45.11301,45.112386,45.113867,45.112597,45.112905,45.111575,45.111851,45.110444,45.110084,45.107061,45.10772,45.105482,45.103315,45.102063,45.102757,45.099676,45.098606,45.096291,45.095987,45.094286,45.094204,45.093478,45.092173,45.088244,45.087275,45.085653,45.082868,45.083141,45.081425,45.079641,45.077761,45.0758,45.074183,45.072405,45.069888,45.069124,45.067162,45.064479,45.062479,45.061957,45.061008,45.05929,45.057489,45.055997,45.054055,45.053471,45.052439,45.050296,45.047789,45.046314,45.046514,45.047052,45.046532,45.043633,45.038637,45.037081,45.035877,45.035768,45.035458,45.035844,45.032454,45.032445,45.033754,45.03377,45.032126,45.031442,45.031682,45.033418,45.033795,45.032175,45.030057,45.028355,45.028271,45.026964,45.025,45.024354,45.021866,45.021784,45.020549,45.01962,45.017789,45.016304,45.013907,45.012247,45.009501,45.006866,45.004531,45.003442,45.00081,45.00001,44.997588,44.996424,44.995429,44.992781,44.99089,44.988875,44.989629,44.988748,44.988407,44.985983,44.986044,44.985101,44.98521,44.983735,44.982564,44.980206,44.978628,44.977266,44.975131,44.973904,44.973208,44.971395,44.970562,44.969355,44.967159,44.965195,44.963588,44.962863,44.961426,44.959405,44.959177,44.957953,44.95626,44.954646,44.954172,44.950425,44.950115,44.949182,44.948872,44.945665,44.945139,44.943562,44.939975,44.936684,44.937446,44.935035,44.935156,44.936046,44.935681,44.934565,44.933534,44.932797,44.930043,44.929833,44.927857,44.922628,44.919599,44.91951,44.918332,44.918567,44.917781,44.919034,44.919965,44.920914,44.921358,44.922659,44.921549,44.921567,44.918395,44.917318,44.915471,44.916363,44.915212,44.913152,44.911579,44.910375,44.908139,44.906108,44.903958,44.90407,44.90295,44.903297,44.902029,44.903142,44.903461,44.904154,44.903949,44.903207,44.905012,44.904679,44.903796,44.904077,44.901513,44.899106,44.896804,44.895326,44.893745,44.891673,44.890411,44.889461,44.886262,44.88572,44.88572,44.885716,44.88572,44.88572,44.88572,44.885719,44.88572,44.882059,44.879812,44.876673,44.875394,44.872298,44.869565,44.864573,44.86124,44.856706,44.855163,44.853292,44.847398,44.845514,44.841401,44.837387,44.832677,44.829919,44.828908,44.82543,44.824633,44.820267,44.819734,44.819846,44.818958,44.815469,44.815433,44.813004,44.812002,44.81217,44.811634,44.811574,44.807869,44.806377,44.805407,44.80399,44.803173,44.800134,44.795847,44.79466,44.793037,44.792964,44.792548,44.791602,44.790637,44.7898,44.786813,44.784404,44.781509,44.78228,44.782159,44.780597,44.779078,44.777548,44.779277,44.778183,44.776675,44.772848,44.772311,44.773281,44.771856,44.772641,44.775543,44.77555,44.77416,44.775636,44.775136,44.772141,44.769993,44.769111,44.766914,44.767292,44.765293,44.762326,44.760886,44.76137,44.759964,44.754074,44.752723,44.750464,44.748893,44.748232,44.747845,44.746259,44.744269,44.741882,44.738266,44.735456,44.732713,44.730793,44.729236,44.729116,44.727671,44.727148,44.725896,44.724655,44.72052,44.716295,44.71558,44.714547,44.714077,44.713842,44.713707,44.711741,44.710685,44.703088,44.70078,44.699309,44.69837,44.698304,44.69753,44.696291,44.6946,44.6928,44.690417,44.689291,44.687063,44.685153,44.683929,44.683915,44.683888,44.684129,44.685564,44.685483,44.689168,44.691926,44.692141,44.691065,44.693635,44.693787,44.69226,44.689704,44.690406,44.687755,44.687445,44.68911,44.688618,44.686724,44.687317,44.690576,44.690836,44.690819,44.689988,44.690218,44.689948,44.688861,44.687201,44.685691,44.685799,44.687338,44.688084,44.688263,44.688731,44.692286,44.692841,44.692955,44.693644,44.697043,44.697513,44.696384,44.696426,44.697193,44.697478,44.698365,44.700448,44.700734,44.700608,44.698712,44.699471,44.702147,44.702552,44.704358,44.705825,44.707154,44.707611,44.706996,44.707172,44.708855,44.710107,44.710977,44.71193,44.713165,44.714143,44.715879,44.717151,44.718001,44.718005,44.721143,44.725179,44.7261,44.726127,44.724254,44.719643,44.717671,44.717039,44.715565,44.71368,44.713151,44.710244,44.708729,44.707001,44.705819,44.703685,44.703152,44.703218,44.700798,44.696784,44.69617,44.697184,44.695977,44.696236,44.694456,44.693239,44.694399,44.695981,44.696937,44.697071,44.697668,44.698465,44.70099,44.705106,44.706416,44.713068,44.717246,44.719361,44.720745,44.722005,44.722504,44.723565,44.725706,44.728796,44.729275,44.73179,44.732929,44.734203,44.735506,44.738496,44.741007,44.746135,44.747099,44.750634,44.753062,44.753979,44.754257,44.75525,44.75549,44.75611,44.75621,44.758914,44.759289,44.758822,44.758759,44.756705,44.756323,44.755412,44.755972,44.756864,44.75804,44.75766,44.757225,44.757428,44.756511,44.754975,44.752014,44.752082,44.754362,44.755029,44.753131,44.752316,44.753697,44.755047,44.755006,44.754739,44.754428,44.754134,44.753908,44.753124,44.752753,44.752512,44.752011,44.753528,44.751448,44.752751,44.754761,44.756134,44.755458,44.753528,44.753404,44.753858,44.754725,44.755009,44.755259,44.755633,44.755564,44.753742,44.752139,44.752096,44.752567,44.753934,44.75489,44.755819,44.755009,44.754001,44.751043,44.749763,44.750074,44.752692,44.753486,44.754101,44.755686,44.758945,44.760641,44.762046,44.764031,44.766805,44.766867,44.766226,44.764863,44.765619,44.766239,44.767362,44.768217,44.767942,44.768072,44.769646,44.771258,44.774001,44.774716,44.774732,44.775558,44.776476,44.777214,44.777804,44.778181,44.782461,44.784075,44.788271,44.788863,44.789213,44.789107,44.787851,44.787861,44.787054,44.784738,44.782401,44.781976,44.781136,44.780277,44.777719,44.777574,44.777923,44.777371,44.776088,44.775417,44.77602,44.777267,44.777245,44.778523,44.780196,44.781647,44.789338,44.791364,44.792929,44.793214,44.792106,44.789677,44.789109,44.789479,44.787808,44.787738,44.789642,44.790451,44.790249,44.791419,44.792586,44.793174,44.792765,44.793463,44.792603,44.79278,44.794422,44.793666,44.791563,44.791537,44.791578,44.789678,44.78903,44.786855,44.785434,44.785209,44.783213,44.779591,44.777942,44.778194,44.775523,44.771708,44.77072,44.770298,44.770616,44.770896,44.774362,44.77468,44.774063,44.772644,44.769308,44.767536,44.76229,44.760755,44.759186,44.758055,44.7583,44.758216,44.757137,44.75506,44.752291,44.751136,44.751034,44.750569,44.748623,44.747499,44.745129,44.743985,44.744958,44.743794,44.741044,44.739819,44.739187,44.737503,44.736472,44.732507,44.729806,44.728611,44.726906,44.724935,44.723703,44.721852,44.72222,44.720663,44.719301,44.716995,44.71578,44.714889,44.715479,44.717986,44.718634,44.720937,44.721094,44.715557,44.714277,44.713103,44.709874,44.707984,44.705845,44.702888,44.700518,44.698606,44.697578,44.696492,44.696526,44.695985,44.694026,44.693479,44.693872,44.696058,44.695699,44.694101,44.69212,44.690286,44.689016,44.687233,44.686916,44.688924,44.68809,44.687041,44.686898,44.68794,44.689732,44.690091,44.690794,44.691194,44.691887,44.69276,44.694116,44.697591,44.69816,44.698774,44.699336,44.699592,44.700354,44.704244,44.705776,44.707409,44.709128,44.710897,44.712904,44.714894,44.717341,44.71976,44.719877,44.721154,44.72213,44.723642,44.725376,44.725578,44.723951,44.72107,44.720551,44.721804,44.723498,44.725243,44.728972,44.731045,44.733589,44.735417,44.735833,44.736823,44.73726,44.737595,44.73808,44.738451,44.73849,44.737627,44.737034,44.737684,44.738869,44.743405,44.744883,44.747124,44.748042,44.748094,44.74615,44.743504,44.743073,44.743343,44.745997,44.747011,44.747551,44.746539,44.746215,44.746553,44.748844,44.751034,44.752966,44.759049,44.759483,44.758445,44.756922,44.753731,44.752475,44.751272,44.751372,44.752109,44.751258,44.749592,44.7488,44.748914,44.749516,44.751446,44.755137,44.760578,44.765404,44.770231,44.771832,44.773729,44.775272,44.778736,44.779867,44.785587,44.787897,44.789249,44.79117,44.791961,44.792666,44.793774,44.794537,44.796516,44.797542,44.799099,44.800848,44.806642,44.80953,44.811523,44.814044,44.817768,44.818847,44.82098,44.821691,44.822803,44.826079,44.826479,44.825503,44.825398,44.826506,44.827607,44.829536,44.830219,44.830236,44.828733,44.829041,44.83042,44.833332,44.835729,44.83612,44.836601,44.837131,44.837984,44.839568,44.841506,44.844667,44.845611,44.851647,44.855601,44.857553]}]],[[{"lng":[-121.849512,-121.847093,-121.843955,-121.844453,-121.844256,-121.843049,-121.844366,-121.845971,-121.847034,-121.84938,-121.848875,-121.847359,-121.84688,-121.844861,-121.843914,-121.839796,-121.834668,-121.832405,-121.829007,-121.82561,-121.824155,-121.823104,-121.819453,-121.818283,-121.815638,-121.814698,-121.809865,-121.809382,-121.809419,-121.811212,-121.813074,-121.812509,-121.813482,-121.816073,-121.816317,-121.815832,-121.8138,-121.813604,-121.811331,-121.807657,-121.806817,-121.807092,-121.804825,-121.803286,-121.802801,-121.802093,-121.803133,-121.801798,-121.800708,-121.801265,-121.800617,-121.79921,-121.800051,-121.799081,-121.799965,-121.798363,-121.796859,-121.79518,-121.793895,-121.795273,-121.795192,-121.800216,-121.800926,-121.798646,-121.800331,-121.802162,-121.802325,-121.804756,-121.806559,-121.81069,-121.811566,-121.810189,-121.80941,-121.807491,-121.808206,-121.805763,-121.805488,-121.80419,-121.802244,-121.80273,-121.801352,-121.800054,-121.797945,-121.799432,-121.799566,-121.797991,-121.797622,-121.797993,-121.79865,-121.798969,-121.799036,-121.798805,-121.798435,-121.798296,-121.801092,-121.801611,-121.800563,-121.800936,-121.800345,-121.799241,-121.799675,-121.800929,-121.800402,-121.799562,-121.794599,-121.793238,-121.788859,-121.787179,-121.788944,-121.790022,-121.793329,-121.793604,-121.795481,-121.796635,-121.797009,-121.796565,-121.797651,-121.800479,-121.802922,-121.802109,-121.798174,-121.797833,-121.796704,-121.796107,-121.795797,-121.795864,-121.79528,-121.795643,-121.794385,-121.79695,-121.798109,-121.802682,-121.804597,-121.802779,-121.799458,-121.800219,-121.797222,-121.795075,-121.792298,-121.79161,-121.788525,-121.788203,-121.782569,-121.780168,-121.774175,-121.775652,-121.772321,-121.768218,-121.762002,-121.759958,-121.761005,-121.763225,-121.76661,-121.769206,-121.769125,-121.771593,-121.772449,-121.773183,-121.776323,-121.778305,-121.779924,-121.783621,-121.784961,-121.789999,-121.79151,-121.795963,-121.796831,-121.798998,-121.801536,-121.804413,-121.804304,-121.806653,-121.80762,-121.810296,-121.81202,-121.813655,-121.817386,-121.819137,-121.817809,-121.817212,-121.816436,-121.816517,-121.817693,-121.820254,-121.819663,-121.820278,-121.816998,-121.813663,-121.813063,-121.810174,-121.811363,-121.812221,-121.808137,-121.803883,-121.796409,-121.792116,-121.790183,-121.787132,-121.781753,-121.775926,-121.767978,-121.764831,-121.76252,-121.759991,-121.753589,-121.752994,-121.725068,-121.725068,-121.351973,-121.210841,-121.091897,-121.090568,-121.08948,-120.989505,-120.923309,-120.68959,-120.371441,-120.372635,-120.379053,-120.380711,-120.377062,-120.377797,-120.38353,-120.386035,-120.386498,-120.385489,-120.384813,-120.380814,-120.379005,-120.379794,-120.381376,-120.385877,-120.385062,-120.390987,-120.393173,-120.394109,-120.395872,-120.398292,-120.399226,-120.401654,-120.404676,-120.404685,-120.400743,-120.39737,-120.394668,-120.394254,-120.394825,-120.397984,-120.399248,-120.398603,-120.393046,-120.389667,-120.387782,-120.387452,-120.388118,-120.387642,-120.385687,-120.386378,-120.385768,-120.386561,-120.406743,-120.597275,-120.827555,-120.827552,-120.826899,-120.988824,-120.988375,-121.014525,-121.058034,-121.058352,-121.076748,-121.077844,-121.107534,-121.130934,-121.149644,-121.189792,-121.199971,-121.229289,-121.2293,-121.242113,-121.291112,-121.405495,-121.473293,-121.533117,-121.59326,-121.596883,-121.636001,-121.673699,-121.674928,-121.776324,-121.776324,-121.843138,-121.843218,-121.846123,-121.846756,-121.846519,-121.845128,-121.845745,-121.842528,-121.841332,-121.843244,-121.843146,-121.845531,-121.844403,-121.845334,-121.84552,-121.845745,-121.847561,-121.847578,-121.846191,-121.846615,-121.844711,-121.841535,-121.841128,-121.84291,-121.844408,-121.847502,-121.848677,-121.848139,-121.848791,-121.847291,-121.847634,-121.849462,-121.849512],"lat":[44.468364,44.470459,44.471833,44.473565,44.475957,44.479035,44.481512,44.483372,44.483275,44.484523,44.486706,44.488942,44.49109,44.491746,44.492775,44.495385,44.499335,44.502985,44.504256,44.50698,44.510048,44.511203,44.512045,44.512981,44.512108,44.513325,44.513812,44.514425,44.517546,44.519831,44.525157,44.527784,44.531585,44.534596,44.537376,44.539172,44.541745,44.54353,44.545235,44.546928,44.548444,44.551851,44.553353,44.555321,44.559782,44.562017,44.564929,44.566362,44.567833,44.570839,44.572228,44.573115,44.576399,44.579193,44.581321,44.582152,44.588985,44.592814,44.594056,44.596546,44.597702,44.600249,44.603152,44.605198,44.606225,44.608412,44.610439,44.611599,44.613731,44.61439,44.615767,44.617967,44.622239,44.623723,44.628211,44.631081,44.63302,44.633771,44.636033,44.63719,44.637365,44.639156,44.640313,44.643578,44.646223,44.64721,44.649507,44.650642,44.651538,44.652275,44.652762,44.653385,44.653849,44.654228,44.657456,44.660301,44.663489,44.665891,44.671413,44.672991,44.676467,44.67856,44.683013,44.683915,44.683929,44.685153,44.687063,44.689291,44.690417,44.6928,44.6946,44.696291,44.69753,44.698304,44.69837,44.699309,44.70078,44.703088,44.710685,44.711741,44.713707,44.713842,44.714077,44.714547,44.71558,44.716295,44.72052,44.724655,44.725896,44.727148,44.727671,44.729116,44.729236,44.730793,44.732713,44.735456,44.738266,44.741882,44.744269,44.746259,44.747845,44.748232,44.748893,44.750464,44.752723,44.754074,44.759964,44.76137,44.760886,44.762326,44.765293,44.767292,44.766914,44.769111,44.769993,44.772141,44.775136,44.775636,44.77416,44.77555,44.775543,44.772641,44.771856,44.773281,44.772311,44.772848,44.776675,44.778183,44.779277,44.777548,44.779078,44.780597,44.782159,44.78228,44.781509,44.784404,44.786813,44.7898,44.790637,44.791602,44.792548,44.792964,44.793037,44.79466,44.795847,44.800134,44.803173,44.80399,44.805407,44.806377,44.807869,44.811574,44.811634,44.81217,44.812002,44.813004,44.815433,44.815469,44.818958,44.819846,44.819734,44.820267,44.824633,44.82543,44.828908,44.829919,44.829919,44.825519,44.8247,44.825067,44.825098,44.824093,44.823272,44.823135,44.822996,44.822491,44.821769,44.82037,44.819357,44.817938,44.814826,44.812034,44.8119,44.810985,44.809966,44.809674,44.807041,44.807352,44.806314,44.80298,44.800721,44.798474,44.796406,44.795784,44.797013,44.802712,44.803969,44.802357,44.799835,44.797861,44.794719,44.792695,44.789951,44.788414,44.786038,44.784272,44.782665,44.78073,44.778767,44.776973,44.773307,44.771638,44.769866,44.767886,44.763229,44.761979,44.761175,44.653068,44.578606,44.564009,44.564036,44.563012,44.562793,44.562604,44.476499,44.476484,44.390265,44.390325,44.390428,44.390474,44.390427,44.390531,44.3906,44.390635,44.390647,44.390621,44.390631,44.390646,44.393036,44.392954,44.392893,44.393153,44.393464,44.393184,44.392612,44.392578,44.392413,44.393383,44.393387,44.393402,44.392829,44.39263,44.395459,44.398504,44.4022,44.404103,44.407373,44.408824,44.409387,44.41103,44.4118,44.413395,44.414634,44.417873,44.420456,44.424733,44.426582,44.428753,44.430542,44.431791,44.433879,44.437707,44.441974,44.444912,44.447288,44.451388,44.454743,44.458411,44.459549,44.461925,44.462899,44.464364,44.466672,44.468364]}]],[[{"lng":[-122.289972,-122.28747,-122.287458,-122.287177,-122.28769,-122.287686,-122.287818,-122.284689,-122.283449,-122.283778,-122.283792,-122.282708,-122.28273,-122.282622,-122.282585,-122.282245,-122.119656,-122.076261,-122.08045,-122.083097,-122.086152,-122.087905,-122.09102,-122.093776,-122.093953,-122.092989,-122.091829,-122.092132,-122.089048,-122.086957,-122.08859,-122.086627,-122.08697,-122.08664,-122.084436,-122.083111,-122.082668,-122.08346,-122.081345,-122.079883,-122.077287,-122.077133,-122.076045,-122.075297,-122.071996,-122.068737,-122.065175,-122.064263,-122.064303,-122.065324,-122.066487,-122.067115,-122.065992,-122.066281,-122.065023,-122.06047,-122.057458,-122.055484,-122.053544,-122.054283,-122.052383,-122.053175,-122.054621,-122.05417,-122.052183,-122.051025,-122.048329,-122.047031,-122.045526,-122.044583,-122.042643,-122.040172,-122.038962,-122.039694,-122.039964,-122.040977,-122.03966,-122.034519,-122.033634,-122.034014,-122.037333,-122.038408,-122.03965,-122.040718,-122.040658,-122.039396,-122.037335,-122.034178,-122.028174,-122.02634,-122.024834,-122.023229,-122.018876,-122.015876,-122.014804,-122.013759,-122.011983,-122.010682,-122.006618,-122.003126,-122.001997,-122.001265,-121.999218,-121.996857,-121.996478,-121.992757,-121.992743,-121.98966,-121.988228,-121.98518,-121.979423,-121.97532,-121.974199,-121.976391,-121.980554,-121.982424,-121.9839,-121.984575,-121.986399,-121.987774,-121.992765,-121.994513,-121.999904,-122.001332,-122.006263,-122.00765,-122.008778,-122.009532,-122.008532,-122.009075,-122.008467,-122.005582,-122.003164,-122.001443,-121.999293,-122.000957,-122.001748,-122.008646,-122.012305,-122.013078,-122.01326,-122.015941,-122.015598,-122.012945,-122.012157,-122.009233,-122.009346,-122.008208,-122.010144,-122.010789,-122.010403,-122.01216,-122.013147,-122.015812,-122.017972,-122.020536,-122.021663,-122.021803,-122.025284,-122.028001,-122.030376,-122.033694,-122.031057,-122.030513,-122.029159,-122.029958,-122.032684,-122.033982,-122.039166,-122.042212,-122.044577,-122.047945,-122.048876,-122.051658,-122.053217,-122.056221,-122.057121,-122.05949,-122.06024,-122.062266,-122.062769,-122.062446,-122.05922,-122.0571,-122.060407,-122.062799,-122.063256,-122.064155,-122.067515,-122.073062,-122.074132,-122.077115,-122.081246,-122.083154,-122.085681,-122.085903,-122.084586,-122.084678,-122.088043,-122.091182,-122.091581,-122.093408,-122.095125,-122.096658,-122.099629,-122.101598,-122.101702,-122.106436,-122.108581,-122.111765,-122.113959,-122.117102,-122.118494,-122.120581,-122.123909,-122.126425,-122.128491,-122.129916,-122.132883,-122.133328,-122.131782,-122.132034,-122.132435,-122.13754,-122.138814,-122.140676,-122.14345,-122.14421,-122.147305,-122.149927,-122.15296,-122.151573,-122.148739,-122.146301,-122.147339,-122.145365,-122.138621,-122.136912,-122.138978,-122.138412,-122.136458,-122.137364,-122.13888,-122.140161,-122.140492,-122.138917,-122.136871,-122.135334,-122.13445,-122.134547,-122.132848,-122.132331,-122.133356,-122.133046,-122.131417,-122.130937,-122.133547,-122.133453,-122.130529,-122.128721,-122.130579,-122.129678,-122.129797,-122.131583,-122.132474,-122.138758,-122.142355,-122.145139,-122.147726,-122.148688,-122.149534,-122.147807,-122.146222,-122.146991,-122.144946,-122.143532,-122.140274,-122.140082,-122.141768,-122.142867,-122.142806,-122.140828,-122.139145,-122.138746,-122.136349,-122.135109,-122.133674,-122.133128,-122.131616,-122.131009,-122.129193,-122.12716,-122.125264,-122.124336,-122.116677,-122.112224,-122.110753,-122.109553,-122.106566,-122.105215,-122.103544,-122.099228,-122.096613,-122.094779,-122.094982,-122.093513,-122.092318,-122.086742,-122.0826,-122.080848,-122.078379,-122.076149,-122.071291,-122.070284,-122.072724,-122.071531,-122.067707,-122.064361,-122.061334,-122.059263,-122.056872,-122.049781,-122.047708,-122.046115,-122.042529,-122.04094,-122.038966,-122.035993,-122.034958,-122.02914,-122.026748,-122.020002,-122.016941,-122.013037,-122.010965,-122.003068,-122.002362,-121.642987,-121.600018,-121.547864,-121.464437,-121.398498,-121.39767,-121.332969,-121.332609,-121.332413,-121.348471,-121.349247,-121.349315,-121.3513,-121.35055,-121.35053,-121.350007,-121.349679,-121.131887,-120.996685,-120.996696,-120.899236,-120.883327,-120.882106,-120.882106,-120.880436,-120.880501,-120.879805,-120.879925977229,-120.940201,-120.980416,-121.022114,-121.080956,-121.111238326886,-121.125007,-121.174152,-121.250331958387,-121.297304,-121.31648631619,-121.328988,-121.344911,-121.356649,-121.435531,-121.447537949131,-121.518985,-121.519526386293,-121.591106,-121.600214645464,-121.600302875257,-121.680618944726,-121.69468,-121.800981,-121.825079635986,-121.889217528984,-121.88925504236,-121.939829,-121.954084502429,-121.95743,-122.034563,-122.047234,-122.144058,-122.163511,-122.189401401612,-122.260687,-122.284835725791,-122.289748006076,-122.289972],"lat":[42.127156,42.127168,42.202994,42.288838,42.392086,42.395348,42.4745,42.4745,42.707455,42.901702,42.910926,42.910928,42.996499,43.056265,43.067719,43.06772,43.067757,43.067744,43.069772,43.069841,43.072046,43.072155,43.073641,43.076257,43.077449,43.082238,43.083706,43.086837,43.090462,43.091483,43.094927,43.096334,43.098894,43.100431,43.101539,43.103033,43.104749,43.10851,43.1135,43.115911,43.1177,43.120005,43.122069,43.126545,43.129445,43.131102,43.135701,43.140814,43.143377,43.146062,43.147204,43.149964,43.150872,43.152756,43.15248,43.154236,43.15582,43.156334,43.157965,43.162171,43.164577,43.167235,43.168662,43.172116,43.174665,43.176881,43.178552,43.181278,43.183103,43.186757,43.187293,43.189496,43.191598,43.193526,43.196262,43.197659,43.199921,43.205333,43.206901,43.207857,43.211156,43.213191,43.214102,43.216623,43.218136,43.218581,43.217497,43.218674,43.219886,43.221535,43.221998,43.224582,43.226832,43.226904,43.228348,43.232005,43.234109,43.234593,43.234065,43.23423,43.234752,43.236587,43.238929,43.239893,43.24262,43.248354,43.251153,43.253139,43.254846,43.25735,43.259784,43.260981,43.261693,43.262296,43.26518,43.268887,43.27039,43.27353,43.27473,43.277653,43.279401,43.280439,43.281121,43.281696,43.285971,43.288227,43.291051,43.294341,43.296048,43.298773,43.30118,43.302549,43.304723,43.307618,43.308993,43.310469,43.312566,43.317236,43.317991,43.31895,43.32131,43.324152,43.325457,43.327747,43.329023,43.331929,43.33516,43.337374,43.340257,43.342685,43.344697,43.345646,43.347589,43.350868,43.352741,43.358409,43.359378,43.362042,43.361911,43.360013,43.358849,43.35665,43.360048,43.361626,43.363153,43.364558,43.366071,43.368514,43.370607,43.372241,43.37526,43.377492,43.377553,43.379996,43.380888,43.381459,43.383771,43.386782,43.390573,43.39268,43.394378,43.395276,43.398562,43.399646,43.400716,43.403898,43.405868,43.406547,43.407003,43.409675,43.410852,43.412149,43.414465,43.418402,43.419318,43.420242,43.421641,43.422579,43.423647,43.426736,43.42882,43.429284,43.427893,43.425298,43.425947,43.425083,43.428032,43.429801,43.429219,43.429089,43.431354,43.431977,43.432837,43.435399,43.434663,43.435349,43.435234,43.436162,43.436528,43.437293,43.439396,43.440221,43.441124,43.443167,43.444501,43.444947,43.444169,43.442832,43.442479,43.444354,43.447662,43.448708,43.449351,43.450923,43.452654,43.45489,43.45514,43.456339,43.456987,43.459132,43.460686,43.461777,43.461778,43.463835,43.466716,43.467514,43.467445,43.468423,43.472069,43.47356,43.476034,43.478185,43.479701,43.482811,43.483834,43.485057,43.489966,43.491401,43.491969,43.496887,43.499774,43.503594,43.505694,43.507323,43.510434,43.511821,43.513285,43.513576,43.515463,43.519057,43.520693,43.523017,43.523617,43.525509,43.52841,43.528421,43.529683,43.530775,43.534465,43.535952,43.53711,43.540482,43.541944,43.543161,43.544544,43.549437,43.551491,43.553278,43.55495,43.557284,43.557376,43.558293,43.55993,43.561938,43.562447,43.56549,43.565274,43.567709,43.569273,43.572977,43.574486,43.574987,43.574618,43.575654,43.576825,43.579215,43.579642,43.579584,43.577615,43.577326,43.577964,43.579643,43.579585,43.581616,43.584945,43.58775,43.58775,43.587403,43.589719,43.590297,43.59192,43.594581,43.597881,43.597823,43.599211,43.600817,43.601615,43.601758,43.602452,43.603609,43.604822,43.606611,43.609916,43.609162,43.609274,43.614657,43.615498,43.616648,43.616443,43.616497,43.616607,43.616218,43.616295,43.616645,43.473058,43.356663,43.356753,43.111683,43.089928,42.919989,42.919989,42.91669,42.833905,42.746644,42.746775,42.746349,42.743688,42.743806,42.744214,42.486559,42.483262,42.483263,42.428587,41.996882,41.9937643415584,41.993492,41.993023,41.993308,41.995314,41.995871512136,41.996125,41.997228,41.9973071788576,41.997356,41.997018172313,41.996798,41.996214,41.996493,41.997327,41.9974692924328,41.998316,41.9983223656297,41.999164,41.9992909902104,41.9992922202857,42.0004119646647,42.000608,42.002122,42.0024146243105,42.0031934363034,42.0031938918199,42.003808,42.0035463939955,42.003485,42.004696,42.005339,42.006552,42.007264,42.0073583154912,42.007618,42.0080194929245,42.0081011637255,42.127156]}]],[[{"lng":[-121.108335,-121.108065,-121.107534,-121.077844,-121.076748,-121.058352,-121.058034,-121.014525,-120.988375,-120.988824,-120.826899,-120.827552,-120.827555,-120.597275,-120.406743,-120.386561,-120.387186,-120.385775,-120.386074,-120.36646,-120.143544,-120.101166,-120.021621,-120.020708,-120.010547,-120.000617,-119.970532,-119.960375,-119.899283,-119.899002,-119.655517,-119.654993,-119.656838,-119.657183,-119.775402,-119.777528,-119.897434,-120.237934,-120.257777,-120.258386,-120.298364,-120.378107,-120.37874,-120.747848,-120.748249,-120.918109,-120.986587,-120.986955,-120.987084,-120.987271,-121.028358,-121.09243,-121.102773,-121.102781,-121.102791,-121.102883,-121.102938,-121.108537,-121.108335],"lat":[44.26204,44.32718,44.3906,44.390531,44.390427,44.390474,44.390428,44.390325,44.390265,44.476484,44.476499,44.562604,44.562793,44.563012,44.564036,44.564009,44.476624,44.476624,44.436083,44.437015,44.437751,44.43821,44.438793,44.389687,44.389727,44.389104,44.388968,44.389457,44.389575,44.30662,44.307045,44.220276,44.220277,43.95892,43.959086,43.697957,43.6982,43.697376,43.698762,43.785297,43.785545,43.785429,43.872362,43.871331,43.95731,43.959365,43.960852,44.047637,44.076292,44.134026,44.135452,44.137751,44.138125,44.169238,44.17139,44.20241,44.218487,44.218519,44.26204]}]],[[{"lng":[-118.697766,-118.656251,-118.656266,-118.633925,-118.613243,-118.613254,-118.613107,-118.577354,-118.572271,-118.536194,-118.506296,-118.506172,-118.469471,-118.428329,-118.428539,-118.428539,-118.404806,-118.404849,-118.392817,-118.38422,-118.384117,-118.366522,-118.366326,-118.267614,-118.241665,-118.241668,-118.197876,-118.197955,-118.117464,-118.116461,-118.116362,-118.116355,-118.116309,-118.11836,-118.116844,-118.117121,-118.117194,-118.066383,-118.066513,-118.066465,-118.066506,-118.054666,-118.045102,-118.045003,-117.972948,-117.97298,-117.747327,-117.747405,-117.747464,-117.74765,-117.788395,-117.787623,-117.766865,-117.767063,-117.746137,-117.745959,-117.730633,-117.727225,-117.727235,-117.683986,-117.683794,-117.683951,-117.68379,-117.664146,-117.663391,-117.643485,-117.643494,-117.622777,-117.622801,-117.582344,-117.582674,-117.582166,-117.562208,-117.561969,-117.542058,-117.542216,-117.522249,-117.522313,-117.520674,-117.520941,-117.501432,-117.496311,-117.476762,-117.476684,-117.373361,-117.320193,-117.266006,-117.266006,-117.266005,-117.313239,-117.368183,-117.379472,-117.381873,-117.563486,-117.563402,-117.564033,-117.747664,-117.777504,-117.779549,-117.78438,-117.784917,-117.784223,-117.784287,-117.780449,-117.778261,-117.778664,-117.77942,-117.781825,-117.784715,-117.786109,-117.790617,-117.791738,-117.794182,-117.793112,-117.795976,-117.794825,-117.795624,-117.793626,-117.793905,-117.795811,-117.797179,-117.794612,-117.793418,-117.795212,-117.796519,-117.797076,-117.799062,-117.798106,-117.799102,-117.801591,-117.803038,-117.804671,-117.802486,-117.803614,-117.805343,-117.803943,-117.80439,-117.805679,-117.807106,-117.809642,-117.812501,-117.813232,-117.810901,-117.812384,-117.810499,-117.810347,-117.81202,-117.814507,-117.818062,-117.827784,-117.827377,-117.828819,-117.834022,-117.838224,-117.840934,-117.840601,-117.837244,-117.83775,-117.83989,-117.841727,-117.844909,-117.84433,-117.842069,-117.84343,-117.850204,-117.850462,-117.853788,-117.858127,-117.859832,-117.862058,-117.868648,-117.870438,-117.871887,-117.873734,-117.873396,-117.881163,-117.884041,-117.88527,-117.885361,-117.888408,-117.885732,-117.886506,-117.890152,-117.890515,-117.894708,-117.894074,-117.897252,-117.896386,-117.900497,-117.901443,-117.903603,-117.906142,-117.911901,-117.912473,-117.913393,-117.914198,-117.915266,-117.917055,-117.917634,-117.918603,-117.920378,-117.922093,-117.921696,-117.925714,-117.92723,-117.928321,-117.931873,-117.933931,-117.93636,-117.937296,-117.940522,-117.942835,-117.944977,-117.946243,-117.9477,-117.950925,-117.952633,-117.956183,-117.958124,-117.965211,-117.968688,-117.97216,-117.975378,-117.977728,-117.982631,-117.985755,-117.990182,-117.993112,-117.998992,-118.000318,-118.00333,-118.006843,-118.007344,-118.009949,-118.016228,-118.022745,-118.028283,-118.032237,-118.037125,-118.041949,-118.044232,-118.046279,-118.051814,-118.057584,-118.060105,-118.063637,-118.064404,-118.06955,-118.0717,-118.074772,-118.077997,-118.080456,-118.086523,-118.088982,-118.089673,-118.091286,-118.09213,-118.094052,-118.096972,-118.098817,-118.100661,-118.102659,-118.10804,-118.108962,-118.110422,-118.115495,-118.11925,-118.126328,-118.128407,-118.130351,-118.136551,-118.137729,-118.138203,-118.139929,-118.141185,-118.140482,-118.140876,-118.142367,-118.148405,-118.154916,-118.15578,-118.155076,-118.156488,-118.161036,-118.164484,-118.166758,-118.169815,-118.172167,-118.175223,-118.17687,-118.178908,-118.184709,-118.192549,-118.194901,-118.197174,-118.200232,-118.201486,-118.203838,-118.206973,-118.209168,-118.211519,-118.214184,-118.214497,-118.21246,-118.212459,-118.213556,-118.213478,-118.212772,-118.214731,-118.213634,-118.213869,-118.217081,-118.219197,-118.220763,-118.220371,-118.223192,-118.223739,-118.225462,-118.227421,-118.228047,-118.229691,-118.231806,-118.232658,-118.232165,-118.232197,-118.245136,-118.244662,-118.251326,-118.254562,-118.256409,-118.260454,-118.263148,-118.264747,-118.267939,-118.270121,-118.272668,-118.274333,-118.276006,-118.277008,-118.278403,-118.280496,-118.28229,-118.282246,-118.284328,-118.286304,-118.287892,-118.290194,-118.292543,-118.296386,-118.299031,-118.298941,-118.299819,-118.302714,-118.304524,-118.305238,-118.307603,-118.308807,-118.308527,-118.311985,-118.314562,-118.315687,-118.318969,-118.320187,-118.321271,-118.323544,-118.324554,-118.329464,-118.32962,-118.331747,-118.3346,-118.336217,-118.339081,-118.342078,-118.34662,-118.350693,-118.351765,-118.356323,-118.356759,-118.358389,-118.359455,-118.364214,-118.366738,-118.367815,-118.368541,-118.370856,-118.373475,-118.375376,-118.378083,-118.380085,-118.381016,-118.386538,-118.387501,-118.38708,-118.387479,-118.390619,-118.390399,-118.389864,-118.392626,-118.39477,-118.39872,-118.40065,-118.404535,-118.405273,-118.408772,-118.411093,-118.416289,-118.418766,-118.42272,-118.425078,-118.430751,-118.433878,-118.4361,-118.439339,-118.438286,-118.437099,-118.438268,-118.438524,-118.437462,-118.437612,-118.436403,-118.437351,-118.44167,-118.444209,-118.445887,-118.446726,-118.446315,-118.448093,-118.452852,-118.456019,-118.457035,-118.464283,-118.469023,-118.469598,-118.468871,-118.518689,-118.519022,-118.518687,-118.547652,-118.546632,-118.655992,-118.656102,-118.696986,-118.697013,-118.697766],"lat":[45.345647,45.345146,45.340337,45.340006,45.339884,45.345788,45.354951,45.354773,45.354767,45.354518,45.354632,45.354867,45.355164,45.35519,45.428951,45.429076,45.429013,45.44255,45.442554,45.44258,45.435246,45.43531,45.428951,45.429103,45.428841,45.427391,45.427204,45.4704,45.470702,45.470732,45.49282,45.498842,45.514652,45.514664,45.600729,45.673797,45.688607,45.688395,45.737574,45.769522,45.77346,45.773563,45.773538,45.817073,45.816896,45.860595,45.861072,45.850523,45.833238,45.773625,45.773515,45.689567,45.689605,45.660227,45.660736,45.616635,45.61692,45.61699,45.51478,45.51523,45.506771,45.441917,45.428365,45.428344,45.365749,45.365322,45.33687,45.336789,45.338171,45.338096,45.324359,45.310184,45.310219,45.295879,45.295956,45.267424,45.267731,45.253458,45.223598,45.209768,45.210148,45.209977,45.209973,45.166539,45.16654,45.166537,45.166539,45.152442,45.08057,45.080581,45.080569,45.079993,45.079997,45.079446,45.036118,44.992866,44.992426,44.992161,44.995244,44.995675,44.998322,44.999668,45.003714,45.005572,45.007621,45.009631,45.01143,45.013583,45.014289,45.013987,45.014854,45.016317,45.016682,45.018583,45.018489,45.020454,45.021648,45.022058,45.023142,45.02278,45.023925,45.023959,45.025795,45.026273,45.025335,45.026679,45.026766,45.028164,45.029284,45.02915,45.02718,45.028184,45.029705,45.030495,45.029481,45.031851,45.032625,45.032832,45.031655,45.032445,45.032274,45.030655,45.028808,45.027532,45.026711,45.025607,45.024511,45.024491,45.025909,45.033314,45.035472,45.037596,45.042113,45.04804,45.050658,45.051643,45.052819,45.055138,45.055136,45.054096,45.054797,45.056057,45.057026,45.058477,45.059736,45.060351,45.060443,45.059753,45.055712,45.054525,45.05758,45.060146,45.064703,45.065639,45.060713,45.059622,45.060095,45.058249,45.056709,45.0571,45.051089,45.049436,45.048706,45.047569,45.04524,45.043706,45.039581,45.037917,45.036321,45.034604,45.033156,45.030232,45.028008,45.028207,45.027236,45.026847,45.026033,45.025357,45.024736,45.024485,45.023006,45.020889,45.019079,45.016939,45.016787,45.015197,45.013626,45.014081,45.0125,45.012767,45.009324,45.008418,45.006667,45.006698,45.006582,45.004881,45.002967,45.000952,45.000621,44.997626,44.995908,44.99617,44.995873,44.994951,44.995409,44.99459,44.99525,44.994448,44.994348,44.994876,44.99484,44.996376,44.997415,44.997644,45.000595,45.001635,45.003403,45.003881,45.004007,45.006961,45.006868,45.00991,45.012785,45.012569,45.012924,45.014088,45.015179,45.016873,45.019598,45.021068,45.024723,45.025648,45.032029,45.033716,45.036878,45.038568,45.041238,45.042327,45.04233,45.044892,45.044347,45.045602,45.046198,45.046801,45.046962,45.045162,45.044761,45.044444,45.045214,45.045024,45.040799,45.040018,45.036458,45.035513,45.033844,45.031677,45.02945,45.027725,45.026728,45.022278,45.020442,45.018775,45.017883,45.015711,45.016657,45.016103,45.017161,45.017105,45.019388,45.019389,45.017995,45.019389,45.017997,45.017329,45.015325,45.015104,45.013155,45.01232,45.010203,45.010094,45.008201,45.007421,45.006585,45.005306,45.00108,44.999353,44.996519,44.995073,44.991343,44.990567,44.989174,44.988505,44.987447,44.984888,44.983722,44.981549,44.979158,44.977488,44.976652,44.973481,44.97237,44.969921,44.966976,44.963285,44.960686,44.960686,44.958396,44.956351,44.956457,44.956934,44.956655,44.958896,44.95929,44.958731,44.957313,44.957659,44.957348,44.957896,44.96023,44.961771,44.962104,44.963114,44.964726,44.964459,44.965046,44.964509,44.962755,44.962913,44.960768,44.96063,44.963426,44.963839,44.968559,44.968488,44.969209,44.969659,44.970771,44.972016,44.971568,44.972586,44.974252,44.975929,44.975415,44.973044,44.972832,44.971889,44.972329,44.973393,44.975827,44.976675,44.978879,44.979593,44.983748,44.986988,44.987332,44.987824,44.988214,44.990605,44.992174,44.992301,44.990763,44.986714,44.985957,44.984037,44.982434,44.981597,44.981894,44.980115,44.979488,44.98129,44.983712,44.983786,44.980483,44.979407,44.97756,44.974115,44.972402,44.972544,44.973976,44.97436,44.975912,44.976476,44.975031,44.973309,44.971192,44.968752,44.967006,44.965656,44.963809,44.963891,44.96256,44.96242,44.96625,44.968054,44.971665,44.975192,44.977115,44.978587,44.980277,44.98298,44.984781,44.985326,44.986752,44.986767,44.988471,44.990024,44.990623,44.989289,44.989514,44.990257,44.989822,44.991737,44.992707,44.995176,44.995877,45.010173,45.08069,45.080753,45.196898,45.196928,45.257729,45.257715,45.259928,45.345647]}]],[[{"lng":[-124.214477,-124.210531,-124.210203396979,-124.208958,-124.206343,-124.206343,-124.206343,-124.200217,-124.193623,-124.193984,-124.177685,-124.16856,-124.164503939476,-124.158728145934,-124.138807,-124.104167,-124.102125,-124.101667,-124.098533,-124.064614,-124.064585,-124.025781,-124.005944,-123.98581,-123.96592,-123.946294,-123.946529,-123.934708,-123.925479,-123.926089,-123.925917,-123.916158,-123.907166,-123.902391,-123.902195,-123.897407,-123.897197,-123.882804,-123.882553,-123.877749,-123.877485,-123.872667,-123.872566,-123.872399,-123.862685,-123.862381,-123.852602,-123.852268,-123.847397,-123.847057,-123.842136,-123.842059,-123.837143,-123.837073,-123.832118,-123.831984,-123.827036,-123.827004,-123.81007,-123.75871,-123.734733,-123.7038,-123.703628,-123.658767,-123.658909,-123.619012,-123.619621,-123.619367,-123.619574,-123.57958,-123.579689,-123.529005,-123.529153,-123.470251,-123.470371,-123.411426,-123.397831,-123.3482,-123.348246,-123.313129,-123.312001,-123.185986,-123.153653,-123.147539,-123.137319,-123.138001,-123.137646,-123.137588,-123.13733,-123.137211,-123.107318,-123.107672,-123.107475,-122.987626,-122.987618,-122.970915,-122.935501,-122.932533,-122.9124,-122.892765,-122.833744,-122.781518,-122.776409,-122.771564,-122.741845,-122.741914,-122.741317,-122.741716,-122.622946,-122.622914,-122.508438,-122.508441,-122.447124,-122.27067,-122.270653,-122.132034,-122.131782,-122.133328,-122.132883,-122.129916,-122.128491,-122.126425,-122.123909,-122.120581,-122.118494,-122.117102,-122.113959,-122.111765,-122.108581,-122.106436,-122.101702,-122.101598,-122.099629,-122.096658,-122.095125,-122.093408,-122.091581,-122.091182,-122.088043,-122.084678,-122.084586,-122.085903,-122.085681,-122.083154,-122.081246,-122.077115,-122.074132,-122.073062,-122.067515,-122.064155,-122.063256,-122.062799,-122.060407,-122.0571,-122.05922,-122.062446,-122.062769,-122.062266,-122.06024,-122.05949,-122.057121,-122.056221,-122.053217,-122.051658,-122.048876,-122.047945,-122.044577,-122.042212,-122.039166,-122.033982,-122.032684,-122.029958,-122.029159,-122.030513,-122.031057,-122.033694,-122.030376,-122.028001,-122.025284,-122.021803,-122.021663,-122.020536,-122.017972,-122.015812,-122.013147,-122.01216,-122.010403,-122.010789,-122.010144,-122.008208,-122.009346,-122.009233,-122.012157,-122.012945,-122.015598,-122.015941,-122.01326,-122.013078,-122.012305,-122.008646,-122.001748,-122.000957,-121.999293,-122.001443,-122.003164,-122.005582,-122.008467,-122.009075,-122.008532,-122.009532,-122.008778,-122.00765,-122.006263,-122.001332,-121.999904,-121.994513,-121.992765,-121.987774,-121.986399,-121.984575,-121.9839,-121.982424,-121.980554,-121.976391,-121.974199,-121.97532,-121.979423,-121.98518,-121.988228,-121.98966,-121.992743,-121.992757,-121.996478,-121.996857,-121.999218,-122.001265,-122.001997,-122.003126,-122.006618,-122.010682,-122.011983,-122.013759,-122.014804,-122.015876,-122.018876,-122.023229,-122.024834,-122.02634,-122.028174,-122.034178,-122.037335,-122.039396,-122.040658,-122.040718,-122.03965,-122.038408,-122.037333,-122.034014,-122.033634,-122.034519,-122.03966,-122.040977,-122.039964,-122.039694,-122.038962,-122.040172,-122.042643,-122.044583,-122.045526,-122.047031,-122.048329,-122.051025,-122.052183,-122.05417,-122.054621,-122.053175,-122.052383,-122.054283,-122.053544,-122.055484,-122.057458,-122.06047,-122.065023,-122.066281,-122.065992,-122.067115,-122.066487,-122.065324,-122.064303,-122.064263,-122.065175,-122.068737,-122.071996,-122.075297,-122.076045,-122.077133,-122.077287,-122.079883,-122.081345,-122.08346,-122.082668,-122.083111,-122.084436,-122.08664,-122.08697,-122.086627,-122.08859,-122.086957,-122.089048,-122.092132,-122.091829,-122.092989,-122.093953,-122.093776,-122.09102,-122.087905,-122.086152,-122.083097,-122.08045,-122.076261,-122.119656,-122.282245,-122.282585,-122.282622,-122.28273,-122.385922,-122.40031,-122.401025,-122.401041,-122.401077,-122.420844,-122.420863,-122.440535,-122.440505,-122.46021,-122.460224,-122.520525,-122.520741,-122.560273,-122.560299,-122.580049,-122.580094,-122.600202,-122.600251,-122.621665,-122.637812,-122.637695,-122.677181,-122.677198,-122.697017,-122.69701,-122.716657,-122.716699,-122.736329,-122.736367,-122.756033,-122.756079,-122.775223,-122.775044,-122.784914,-122.785493,-122.794811,-122.794776,-122.814413,-122.833971,-122.853707,-122.852943,-122.868692,-122.911925,-122.9178,-122.93175,-122.9451,-122.951199,-122.95119,-122.970829,-122.970492,-122.990035,-122.990728,-123.009744,-123.009765,-123.112688,-123.112652,-123.152233,-123.152023,-123.180512,-123.180551,-123.190456,-123.190504,-123.200419,-123.200424,-123.209912,-123.210392,-123.229635,-123.229619,-123.249209,-123.249328,-123.27426,-123.274283,-123.309197,-123.309162,-123.328626,-123.328588,-123.347048,-123.366666,-123.36665,-123.371581,-123.371999,-123.400242,-123.401297,-123.4014,-123.406341,-123.406299,-123.425721,-123.425687,-123.431052,-123.444922,-123.445456,-123.455213,-123.455304,-123.465271,-123.465261,-123.484693,-123.494304,-123.494414,-123.523444,-123.542539,-123.542433,-123.562168,-123.562086,-123.567036,-123.566777,-123.571728,-123.571814,-123.581862,-123.581699,-123.677275,-123.677206,-123.687082,-123.687089,-123.697,-123.696843,-123.701384,-123.716505,-123.716492,-123.716495,-123.720137,-123.723188,-123.726832,-123.732315,-123.734082,-123.735741,-123.739229,-123.740093,-123.741725,-123.743493,-123.746879,-123.750436,-123.752421,-123.754526,-123.756486,-123.759427,-123.761476,-123.764019,-123.766112,-123.76995,-123.773571,-123.778041,-123.780349,-123.783304,-123.789263,-123.7917,-123.795111,-123.796456,-123.796749,-123.799136,-123.800083,-123.800444,-123.803732,-123.806976,-123.808536,-123.811553,-123.811789,-123.820439,-123.819144,-123.81915,-123.819496,-123.820515,-123.821513,-123.821121,-123.821118,-123.761594,-123.761384,-123.761333,-123.707057,-123.707059,-123.702144,-123.702139,-123.702131,-123.702167,-123.703655,-123.703417,-123.703568,-123.703862,-123.704456,-123.704752,-123.764356,-123.764339,-123.763917,-123.764496,-123.762289,-123.761983,-123.762801,-123.761528,-123.764884,-123.769016,-123.817614,-123.817154,-123.816657,-123.875628,-123.875698,-123.949573,-123.949565,-123.979004,-124.062969,-124.100765,-124.146347,-124.180894,-124.183435,-124.218966377223,-124.214477],"lat":[43.627619,43.653347,43.6547163514708,43.659922,43.666628,43.6691103603323,43.674021,43.689555,43.706137,43.706674,43.767228,43.808955,43.8315479200854,43.8637200341693,43.863611,43.863289,43.863417,43.86343,43.863512,43.86421,43.862277,43.862224,43.862996,43.862001,43.863042,43.862737,43.871689,43.866012,43.865947,43.878689,43.898476,43.897322,43.896252,43.896281,43.900512,43.900512,43.904714,43.904582,43.908714,43.908629,43.91275,43.912655,43.914097,43.916733,43.916562,43.920658,43.920553,43.924682,43.924661,43.928822,43.928878,43.932429,43.932458,43.935984,43.935987,43.94308,43.94305,43.944837,43.944581,43.943882,43.944062,43.944319,43.937399,43.936474,43.921672,43.921117,43.906509,43.899074,43.891672,43.891057,43.868291,43.86833,43.830061,43.831183,43.810056,43.809877,43.809076,43.809212,43.78017,43.77991,43.77991,43.779533,43.779631,43.779635,43.77967,43.753648,43.736284,43.677086,43.649355,43.605906,43.605889,43.542099,43.540013,43.538988,43.540992,43.541679,43.54417,43.544357,43.543886,43.544882,43.544702,43.543912,43.544034,43.544317,43.544654,43.517582,43.452015,43.437395,43.438458,43.440262,43.440226,43.441275,43.44141,43.441628,43.440011,43.440221,43.439396,43.437293,43.436528,43.436162,43.435234,43.435349,43.434663,43.435399,43.432837,43.431977,43.431354,43.429089,43.429219,43.429801,43.428032,43.425083,43.425947,43.425298,43.427893,43.429284,43.42882,43.426736,43.423647,43.422579,43.421641,43.420242,43.419318,43.418402,43.414465,43.412149,43.410852,43.409675,43.407003,43.406547,43.405868,43.403898,43.400716,43.399646,43.398562,43.395276,43.394378,43.39268,43.390573,43.386782,43.383771,43.381459,43.380888,43.379996,43.377553,43.377492,43.37526,43.372241,43.370607,43.368514,43.366071,43.364558,43.363153,43.361626,43.360048,43.35665,43.358849,43.360013,43.361911,43.362042,43.359378,43.358409,43.352741,43.350868,43.347589,43.345646,43.344697,43.342685,43.340257,43.337374,43.33516,43.331929,43.329023,43.327747,43.325457,43.324152,43.32131,43.31895,43.317991,43.317236,43.312566,43.310469,43.308993,43.307618,43.304723,43.302549,43.30118,43.298773,43.296048,43.294341,43.291051,43.288227,43.285971,43.281696,43.281121,43.280439,43.279401,43.277653,43.27473,43.27353,43.27039,43.268887,43.26518,43.262296,43.261693,43.260981,43.259784,43.25735,43.254846,43.253139,43.251153,43.248354,43.24262,43.239893,43.238929,43.236587,43.234752,43.23423,43.234065,43.234593,43.234109,43.232005,43.228348,43.226904,43.226832,43.224582,43.221998,43.221535,43.219886,43.218674,43.217497,43.218581,43.218136,43.216623,43.214102,43.213191,43.211156,43.207857,43.206901,43.205333,43.199921,43.197659,43.196262,43.193526,43.191598,43.189496,43.187293,43.186757,43.183103,43.181278,43.178552,43.176881,43.174665,43.172116,43.168662,43.167235,43.164577,43.162171,43.157965,43.156334,43.15582,43.154236,43.15248,43.152756,43.150872,43.149964,43.147204,43.146062,43.143377,43.140814,43.135701,43.131102,43.129445,43.126545,43.122069,43.120005,43.1177,43.115911,43.1135,43.10851,43.104749,43.103033,43.101539,43.100431,43.098894,43.096334,43.094927,43.091483,43.090462,43.086837,43.083706,43.082238,43.077449,43.076257,43.073641,43.072155,43.072046,43.069841,43.069772,43.067744,43.067757,43.06772,43.067719,43.056265,42.996499,42.996644,42.996632,42.996632,42.993456,42.983458,42.983439,42.968927,42.968923,42.95442,42.954373,42.939873,42.93976,42.939077,42.939185,42.92469,42.924651,42.9108,42.911073,42.895693,42.896812,42.89699,42.881141,42.88108,42.866603,42.866572,42.852099,42.85211,42.837671,42.837661,42.823496,42.823195,42.828689,42.8288,42.806831,42.806845,42.792712,42.792721,42.778221,42.780511,42.780653,42.781766,42.774603,42.774541,42.774704,42.774753,42.774874,42.774805,42.774773,42.767555,42.768116,42.760945,42.76095,42.759538,42.75941,42.752144,42.752218,42.75575,42.755835,42.737721,42.737765,42.731655,42.731703,42.724495,42.724474,42.717236,42.717161,42.709983,42.709956,42.70261,42.702421,42.724404,42.724712,42.73203,42.732055,42.728412,42.728247,42.73175,42.732226,42.732194,42.739471,42.739484,42.724955,42.724951,42.724958,42.710297,42.710288,42.713966,42.714483,42.711039,42.710928,42.711122,42.703025,42.702982,42.699406,42.699297,42.702942,42.702168,42.702248,42.70918,42.709186,42.709832,42.717122,42.717574,42.724796,42.72483,42.735693,42.735716,42.732098,42.732149,42.73992,42.739682,42.750145,42.750274,42.753789,42.753907,42.739593,42.739703,42.739658,42.784061,42.785376,42.784164,42.783945,42.781526,42.780131,42.781753,42.782516,42.782865,42.783343,42.786552,42.787971,42.788228,42.787735,42.788245,42.789804,42.789808,42.79107,42.792391,42.792059,42.793468,42.794568,42.797407,42.797665,42.798915,42.799426,42.798147,42.797302,42.793699,42.792936,42.79277,42.790954,42.790094,42.78959,42.787536,42.786983,42.787868,42.788837,42.824101,42.824112,42.884356,42.885135,42.909661,42.909675,42.924483,42.965284,42.996291,42.996318,43.054511,43.08316,43.083457,43.087067,43.087083,43.112458,43.113946,43.17059,43.170579,43.177696,43.186134,43.214139,43.243253,43.257741,43.258054,43.2636,43.287099,43.344799,43.351419,43.358748,43.387997,43.422294,43.431548,43.431695,43.431306,43.459594,43.516449,43.515947,43.608407,43.608472,43.609265,43.609363,43.609641,43.611244,43.611216,43.611445,43.610925,43.6109319633736,43.627619]}]],[[{"lng":[-122.929193,-122.928956,-122.929145,-122.929122,-122.929146,-122.885463,-122.87539,-122.863423,-122.784735,-122.784663,-122.762437,-122.762189526428,-122.772511,-122.772681206097,-122.774511,-122.76381,-122.762414110309,-122.743540245466,-122.738109,-122.713309,-122.691381583242,-122.6911850902,-122.691008,-122.675327484197,-122.675093773773,-122.675008,-122.643907,-122.634962906196,-122.607718206328,-122.602606,-122.588917822907,-122.586005557515,-122.582325993186,-122.581406,-122.55127899822,-122.550211685523,-122.549955276927,-122.549438939157,-122.548149,-122.545981397444,-122.523668,-122.505353096256,-122.49601900833,-122.492259,-122.479315,-122.475778139509,-122.474659,-122.471883289024,-122.455261778702,-122.453891,-122.438674,-122.416934004748,-122.410706,-122.401222955157,-122.397100512625,-122.391802,-122.383435896741,-122.380302,-122.372189242991,-122.352802,-122.341811701881,-122.339070265255,-122.331502,-122.294901,-122.294819998052,-122.266701,-122.262625,-122.259530999909,-122.248993,-122.248911947664,-122.2017,-122.197527546048,-122.183695,-122.166829998749,-122.14075,-122.129548,-122.12949,-122.126197,-122.126197,-122.112356,-122.101675,-122.100176014643,-122.044374,-122.022571,-122.00369,-121.983038,-121.979797,-121.963547,-121.961258017759,-121.955734,-121.951838,-121.935149,-121.922028852172,-121.922051,-121.918698,-121.916509,-121.915478,-121.913115,-121.915184,-121.915527,-121.914551,-121.915913,-121.915803,-121.918095,-121.918386,-121.91549,-121.910547,-121.910516,-121.911443,-121.913019,-121.913911,-121.912619,-121.910309,-121.907326,-121.908329,-121.907176,-121.906325,-121.902915,-121.903291,-121.902678,-121.901879,-121.908793,-121.911695,-121.919685,-121.922136,-121.91644,-121.913216,-121.913761,-121.913087,-121.911614,-121.911443,-121.909746,-121.906924,-121.906688,-121.902817,-121.895902,-121.89392,-121.891749,-121.888674,-121.885605,-121.881862,-121.878538,-121.874665,-121.870166,-121.869342,-121.868187,-121.866919,-121.864656,-121.860873,-121.859828,-121.860137,-121.861111,-121.86337,-121.860323,-121.85882,-121.854653,-121.850403,-121.847872,-121.846821,-121.846764,-121.844301,-121.842521,-121.836809,-121.83527,-121.831765,-121.828898,-121.824922,-121.821485,-121.819587,-121.821959,-121.821956,-121.983148,-121.983147,-122.004194,-122.085981,-122.126544,-122.126545,-122.147212,-122.166674,-122.249969,-122.249828,-122.263944,-122.2727,-122.305836,-122.316084,-122.342882,-122.348315,-122.357752,-122.372096,-122.372796,-122.383141,-122.389346,-122.403758,-122.41397,-122.414457,-122.439145,-122.443966,-122.447789,-122.45466,-122.466639,-122.468001,-122.47253,-122.474558,-122.47555,-122.479942,-122.485866,-122.486584,-122.496748,-122.499336,-122.501043,-122.501787,-122.504364,-122.507261,-122.510439,-122.514243,-122.517067,-122.527468,-122.530085,-122.532488,-122.537618,-122.547638,-122.548002,-122.55301,-122.558255,-122.565483,-122.568617,-122.570126,-122.571309,-122.57905,-122.583961,-122.5855,-122.58613,-122.586836,-122.58937,-122.596245,-122.596603,-122.596702,-122.597184,-122.597198,-122.597395,-122.59762,-122.597665,-122.599675,-122.601454,-122.60175,-122.60573,-122.606614,-122.608722,-122.610832,-122.613127,-122.615374,-122.616195,-122.616871,-122.618341,-122.618588,-122.618995,-122.618977,-122.622359,-122.626278,-122.632974,-122.63656,-122.636587,-122.64158,-122.641245,-122.646958,-122.652921,-122.652988,-122.656972,-122.660979,-122.659105,-122.658274,-122.652605,-122.651227,-122.647666,-122.64616,-122.646267,-122.651183,-122.648787,-122.648725,-122.654959,-122.660451,-122.666145,-122.666298,-122.672677,-122.673311,-122.675572,-122.681893,-122.682505,-122.694678,-122.697382,-122.698697,-122.701808,-122.702001,-122.703304,-122.705021,-122.707893,-122.712169,-122.715938,-122.719286,-122.721355,-122.721663,-122.725541,-122.7303,-122.733422,-122.738563,-122.741101,-122.743721,-122.743718,-122.743703,-122.743691,-122.743673,-122.743668,-122.743649,-122.743659,-122.743667,-122.743672,-122.743663,-122.743654,-122.743626,-122.743671,-122.743681,-122.743711,-122.743745,-122.743746,-122.743758,-122.743798,-122.743799,-122.743809,-122.743785,-122.743803,-122.743805,-122.743813,-122.743815,-122.743828,-122.743847,-122.743856,-122.743859,-122.743859,-122.743862,-122.764464,-122.764486,-122.764472,-122.764459,-122.764458,-122.764439,-122.764436,-122.764412,-122.765076,-122.76609,-122.77215,-122.774659,-122.779838,-122.78234,-122.783624,-122.784232,-122.784864,-122.784768,-122.784769,-122.78477,-122.784771,-122.795111,-122.792699,-122.795914,-122.796057,-122.803132,-122.804585,-122.805432,-122.805481,-122.826005,-122.826222,-122.826342,-122.846978,-122.846905,-122.846849,-122.866745,-122.867592,-122.867495,-122.868303,-122.887963,-122.887837,-122.908992,-122.909078,-122.918725,-122.929128,-122.929193],"lat":[45.671015,45.67835,45.69381,45.698697,45.721482,45.721378,45.721418,45.721416,45.720946,45.72865,45.728665,45.7285767375573,45.699637,45.6980030214684,45.680437,45.657138,45.6564319354118,45.6468852157137,45.644138,45.637438,45.6249517318773,45.6248398415969,45.624739,45.6181727840074,45.6180749177675,45.618039,45.609739,45.6092842265807,45.6078989364008,45.607639,45.6052506713647,45.6047425360023,45.6041005214526,45.60394,45.5974429961583,45.5972128260687,45.5971575305685,45.597046180342,45.596768,45.5961361625816,45.589632,45.5859286680353,45.5840412856794,45.583281,45.579761,45.5786549714616,45.578305,45.5768358833279,45.5680385200064,45.567313,45.563585,45.5667315782601,45.567633,45.5710983445711,45.5726047893983,45.574541,45.5755594821359,45.575941,45.5740234392524,45.569441,45.558502299525,45.5557737334935,45.548241,45.543541,45.5435418617228,45.543841,45.544321,45.5450981314783,45.547745,45.5477731000169,45.564141,45.5672822170685,45.577696,45.5803711516712,45.584508,45.582945,45.582967,45.582573,45.582617,45.581409,45.583516,45.5841961560057,45.609516,45.615151,45.61593,45.622812,45.624839,45.632784,45.6359407622737,45.643559,45.644951,45.644169,45.6491618990508,45.610761,45.608288,45.607635,45.605163,45.601297,45.598698,45.597109,45.593684,45.591609,45.589685,45.587287,45.585484,45.582447,45.581241,45.579733,45.576484,45.575168,45.571163,45.568211,45.566826,45.566723,45.564983,45.56255,45.561935,45.561121,45.559517,45.55686,45.55619,45.549992,45.548941,45.547614,45.546673,45.543205,45.537275,45.535329,45.532567,45.530303,45.529082,45.526749,45.524655,45.520828,45.51853,45.514896,45.513388,45.512631,45.512252,45.512408,45.513125,45.514295,45.515751,45.514598,45.514103,45.508715,45.506786,45.504495,45.501814,45.499168,45.496923,45.495096,45.492844,45.489377,45.489006,45.486638,45.486502,45.483377,45.481329,45.47907,45.476188,45.476109,45.474619,45.472492,45.470184,45.467466,45.465469,45.46333,45.461675,45.461674,45.460226,45.460237,45.461403,45.461534,45.46058,45.461299,45.460039,45.460828,45.460837,45.460935,45.461422,45.461412,45.461394,45.461439,45.46149,45.461529,45.461502,45.461426,45.461222,45.46123,45.461276,45.4613,45.461421,45.461581,45.461579,45.461134,45.461001,45.460974,45.460941,45.461127,45.461135,45.461173,45.461184,45.461183,45.461176,45.461138,45.461132,45.460982,45.461028,45.46107,45.461107,45.461187,45.461252,45.461256,45.46126,45.461262,45.461273,45.461296,45.461318,45.461353,45.461058,45.461045,45.461053,45.461062,45.461307,45.461365,45.46138,45.461392,45.461518,45.461494,45.461487,45.461483,45.461522,45.46149,45.461458,45.461458,45.461458,45.461457,45.461457,45.461457,45.461453,45.461453,45.461454,45.461464,45.461486,45.461488,45.461493,45.461505,45.461501,45.461493,45.461481,45.461473,45.460889,45.460832,45.460933,45.460908,45.461451,45.461444,45.461451,45.46155,45.461474,45.461476,45.461482,45.458671,45.458669,45.458318,45.458314,45.458066,45.457819,45.454341,45.453242,45.445741,45.445281,45.443983,45.441424,45.439584,45.436059,45.432811,45.432718,45.432668,45.432702,45.432743,45.432743,45.432792,45.432795,45.432867,45.432841,45.432841,45.43301,45.433041,45.433041,45.433041,45.433056,45.433038,45.433037,45.433042,45.433056,45.433079,45.433113,45.433135,45.433137,45.433167,45.43324,45.433199,45.433238,45.433268,45.433294,45.435079,45.442944,45.444663,45.447284,45.447693,45.454892,45.456685,45.458486,45.465576,45.467532,45.469466,45.476439,45.476442,45.477961,45.484201,45.487084,45.48725,45.488258,45.494401,45.494665,45.497618,45.505017,45.506834,45.507374,45.507886,45.508181,45.509582,45.512509,45.5144,45.515754,45.516665,45.519509,45.519562,45.526737,45.528166,45.529634,45.529727,45.531184,45.531344,45.533822,45.533858,45.533852,45.533815,45.533809,45.533897,45.533946,45.533971,45.533982,45.533994,45.54232,45.543979,45.545158,45.5484,45.548433,45.54935,45.552082,45.555695,45.555689,45.556182,45.555687,45.562911,45.563041,45.568063,45.577521,45.577516,45.581018,45.591836,45.591881,45.591878,45.606226,45.606223,45.606352,45.620466,45.620763,45.635228,45.635399,45.635313,45.671015]}]],[[{"lng":[-119.672228,-119.667065,-119.603647,-119.593374,-119.552894,-119.544565,-119.306611,-119.306043,-119.162966,-119.002263,-118.946612,-118.675353,-118.518689,-118.468871,-118.469598,-118.469023,-118.464283,-118.457035,-118.456019,-118.452852,-118.448093,-118.446315,-118.446726,-118.445887,-118.444209,-118.44167,-118.437351,-118.436403,-118.437612,-118.437462,-118.438524,-118.438268,-118.437099,-118.438286,-118.439339,-118.4361,-118.433878,-118.430751,-118.425078,-118.42272,-118.418766,-118.416289,-118.411093,-118.408772,-118.405273,-118.404535,-118.40065,-118.39872,-118.39477,-118.392626,-118.389864,-118.390399,-118.390619,-118.387479,-118.38708,-118.387501,-118.386538,-118.381016,-118.380085,-118.378083,-118.375376,-118.373475,-118.370856,-118.368541,-118.367815,-118.366738,-118.364214,-118.359455,-118.358389,-118.356759,-118.356323,-118.351765,-118.350693,-118.34662,-118.342078,-118.339081,-118.336217,-118.3346,-118.331747,-118.32962,-118.329464,-118.324554,-118.323544,-118.321271,-118.320187,-118.318969,-118.315687,-118.314562,-118.311985,-118.308527,-118.308807,-118.307603,-118.305238,-118.304524,-118.302714,-118.299819,-118.298941,-118.299031,-118.296386,-118.292543,-118.290194,-118.287892,-118.286304,-118.284328,-118.282246,-118.28229,-118.280496,-118.278403,-118.277008,-118.276006,-118.274333,-118.272668,-118.270121,-118.267939,-118.264747,-118.263148,-118.260454,-118.256409,-118.254562,-118.251326,-118.244662,-118.243553,-118.244533,-118.24364,-118.245043,-118.244382,-118.24161,-118.237322,-118.23623,-118.233636,-118.229663,-118.227547,-118.226449,-118.223449,-118.225709,-118.226727,-118.226561,-118.22828,-118.231337,-118.232128,-118.231634,-118.227791,-118.229421,-118.232795,-118.235115,-118.237399,-118.236831,-118.234808,-118.235656,-118.235589,-118.236369,-118.235329,-118.231462,-118.232402,-118.230979,-118.229972,-118.226627,-118.224904,-118.228056,-118.22816,-118.227459,-118.228076,-118.23518,-118.236861,-118.24055,-118.242499,-118.246533,-118.253802,-118.258237,-118.261829,-118.264012,-118.267786,-118.2759,-118.279179,-118.283489,-118.2872,-118.289794,-118.295659,-118.296234,-118.294716,-118.294909,-118.293566,-118.29906,-118.302862,-118.306764,-118.306817,-118.309246,-118.312281,-118.314454,-118.3187,-118.317934,-118.313907,-118.308421,-118.30847,-118.310056,-118.311173,-118.308837,-118.307233,-118.307522,-118.304572,-118.303366,-118.300975,-118.296269,-118.295068,-118.294827,-118.296548,-118.298077,-118.2978,-118.296578,-118.298355,-118.299459,-118.294383,-118.293393,-118.294019,-118.294094,-118.292122,-118.290151,-118.284994,-118.283385,-118.28311,-118.286294,-118.287422,-118.28984,-118.289351,-118.288299,-118.286739,-118.286281,-118.286743,-118.285439,-118.289862,-118.292079,-118.294194,-118.296443,-118.29877,-118.300094,-118.302565,-118.305462,-118.306628,-118.311639,-118.316347,-118.319306,-118.321741,-118.325783,-118.329785,-118.332304,-118.336355,-118.339207,-118.343374,-118.346502,-118.350798,-118.35243,-118.358121,-118.361673,-118.365587,-118.367621,-118.372775,-118.376666,-118.379786,-118.381491,-118.383411,-118.383321,-118.385176,-118.387277,-118.387177,-118.391704,-118.391656,-118.394052,-118.393659,-118.395839,-118.40025,-118.403611,-118.413647,-118.417419,-118.418867,-118.418247,-118.419907,-118.419381,-118.422747,-118.425086,-118.43182,-118.432064,-118.433707,-118.435673,-118.437712,-118.440003,-118.443456,-118.445862,-118.45227,-118.459157,-118.460487,-118.461866,-118.460802,-118.461528,-118.464244,-118.468284,-118.470581,-118.473427,-118.476922,-118.480904,-118.483704,-118.488174,-118.491292,-118.492404,-118.495257,-118.495729,-118.496169,-118.496583,-118.496787,-118.497422,-118.497865,-118.498161,-118.498373,-118.498457,-118.499774,-118.501794,-118.505765,-118.507765,-118.509705,-118.513679,-118.516539,-118.518181,-118.51944,-118.519174,-118.516452,-118.51749,-118.51765,-118.518688,-118.517591,-118.513986,-118.512691,-118.511088,-118.510957,-118.50892,-118.507077,-118.507257,-118.504437,-118.504435,-118.500889,-118.497947,-118.493278,-118.488713,-118.485639,-118.48214,-118.47732,-118.473527,-118.472734,-118.463113,-118.460962,-118.456063,-118.453139,-118.451401,-118.446702,-118.441788,-118.438184,-118.436806,-118.433626,-118.432342,-118.429638,-118.425197,-118.422329,-118.41909,-118.417036,-118.414113,-118.412928,-118.41088,-118.410214,-118.404947,-118.403639,-118.402581,-118.399942,-118.393181,-118.391024,-118.388087,-118.38634,-118.386038,-118.379855,-118.377906,-118.375037,-118.372365,-118.3711,-118.368572,-118.36454,-118.362249,-118.360273,-118.355851,-118.354824,-118.353557,-118.343684,-118.343208,-118.342172,-118.342194,-118.344374,-118.341779,-118.341699,-118.342567,-118.341934,-118.338063,-118.338852,-118.337588,-118.336404,-118.333246,-118.329297,-118.319431,-118.316589,-118.314537,-118.312564,-118.309704,-118.311853,-118.311696,-118.309328,-118.305778,-118.305777,-118.306961,-118.308934,-118.311222,-118.310984,-118.315622,-118.314069,-118.316873,-118.315482,-118.31769,-118.317296,-118.31982,-118.322737,-118.323526,-118.32617,-118.327739,-118.328495,-118.332254,-118.334252,-118.337408,-118.337886,-118.343274,-118.343872,-118.345607,-118.346866,-118.346234,-118.347614,-118.347966,-118.346739,-118.349305,-118.351025,-118.352379,-118.354821,-118.354205,-118.356315,-118.358417,-118.359224,-118.364066,-118.365535,-118.369628,-118.37153,-118.372225,-118.370803,-118.371036,-118.368806,-118.371346,-118.374236,-118.374509,-118.373523,-118.374563,-118.373195,-118.372863,-118.370202,-118.367772,-118.366115,-118.364615,-118.365086,-118.363427,-118.360667,-118.357986,-118.362312,-118.367042,-118.36365,-118.36231,-118.360732,-118.36514,-118.367973,-118.36939,-118.372852,-118.375367,-118.376741,-118.378302,-118.380034,-118.383108,-118.386097,-118.388293,-118.39201,-118.394593,-118.398703,-118.402845,-118.405392,-118.408786,-118.411069,-118.41351,-118.418155,-118.419336,-118.420911,-118.421542,-118.422173,-118.421545,-118.420601,-118.420366,-118.418457,-118.420684,-118.423597,-118.422102,-118.422418,-118.42895,-118.429108,-118.428322,-118.430919,-118.431147,-118.434066,-118.434853,-118.435954,-118.434932,-118.43501,-118.431707,-118.425493,-118.427067,-118.428483,-118.428326,-118.424394,-118.422586,-118.421329,-118.417555,-118.413703,-118.409774,-118.40889,-118.407612,-118.410955,-118.413314,-118.420455,-118.430374,-118.432812,-118.433813,-118.433579,-118.432384,-118.433621,-118.435357,-118.43437,-118.436986,-118.440356,-118.447799,-118.452455,-118.456729,-118.457563,-118.458579,-118.461061,-118.46887,-118.469096,-118.467883,-118.47266,-118.474848,-118.478595,-118.478727,-118.48124,-118.481412,-118.482345,-118.484647,-118.486512,-118.488681,-118.490468,-118.49507,-118.496152,-118.497321,-118.498411,-118.500117,-118.49732,-118.497499,-118.447185,-118.354145,-118.354122,-118.23217,-118.232214,-118.233908,-118.228843,-118.228541,-118.227645,-118.347856,-118.347859,-118.466299,-118.467308,-118.587125,-118.587172,-118.799711,-118.81689,-118.816931,-118.857192,-118.867264,-118.932024,-119.614325,-119.657183,-119.656838,-119.654993,-119.655517,-119.655248,-119.655108,-119.653696,-119.653832,-119.653673,-119.653885,-119.653538,-119.653476,-119.653347,-119.653184,-119.652431,-119.671532,-119.672228],"lat":[44.995117,44.994664,44.994539,44.99531,44.995311,44.995689,44.995993,44.995696,44.996241,44.996558,44.997439,44.997662,44.995877,44.995176,44.992707,44.991737,44.989822,44.990257,44.989514,44.989289,44.990623,44.990024,44.988471,44.986767,44.986752,44.985326,44.984781,44.98298,44.980277,44.978587,44.977115,44.975192,44.971665,44.968054,44.96625,44.96242,44.96256,44.963891,44.963809,44.965656,44.967006,44.968752,44.971192,44.973309,44.975031,44.976476,44.975912,44.97436,44.973976,44.972544,44.972402,44.974115,44.97756,44.979407,44.980483,44.983786,44.983712,44.98129,44.979488,44.980115,44.981894,44.981597,44.982434,44.984037,44.985957,44.986714,44.990763,44.992301,44.992174,44.990605,44.988214,44.987824,44.987332,44.986988,44.983748,44.979593,44.978879,44.976675,44.975827,44.973393,44.972329,44.971889,44.972832,44.973044,44.975415,44.975929,44.974252,44.972586,44.971568,44.972016,44.970771,44.969659,44.969209,44.968488,44.968559,44.963839,44.963426,44.96063,44.960768,44.962913,44.962755,44.964509,44.965046,44.964459,44.964726,44.963114,44.962104,44.961771,44.96023,44.957896,44.957348,44.957659,44.957313,44.958731,44.95929,44.958896,44.956655,44.956934,44.956457,44.956351,44.958396,44.956525,44.951086,44.950096,44.945198,44.94431,44.943198,44.942695,44.941213,44.940104,44.941695,44.939778,44.939575,44.93691,44.933778,44.931409,44.930012,44.926032,44.924687,44.923482,44.921531,44.918361,44.913854,44.911514,44.91053,44.908385,44.906927,44.904173,44.902902,44.901367,44.898643,44.897046,44.894063,44.891028,44.887149,44.882349,44.878634,44.875568,44.872332,44.870332,44.867783,44.865544,44.862587,44.86166,44.862344,44.863165,44.864071,44.864851,44.863351,44.866013,44.866412,44.869386,44.866573,44.866271,44.865007,44.865367,44.866421,44.863043,44.862086,44.859376,44.856606,44.853018,44.850451,44.848153,44.846614,44.843855,44.841107,44.840039,44.838066,44.836274,44.834937,44.832422,44.830613,44.828794,44.824802,44.823236,44.821229,44.821148,44.819407,44.818712,44.81733,44.816426,44.816164,44.813191,44.809344,44.807807,44.802979,44.800259,44.799211,44.798705,44.796442,44.790167,44.787936,44.787259,44.784664,44.780412,44.77925,44.773003,44.772211,44.77072,44.767331,44.767165,44.765439,44.763371,44.762708,44.759278,44.757123,44.754323,44.750975,44.749868,44.747389,44.746564,44.74698,44.746248,44.746025,44.747643,44.746949,44.74528,44.744241,44.743986,44.742082,44.74151,44.74162,44.74358,44.742467,44.742609,44.743944,44.744444,44.743912,44.743996,44.744738,44.745573,44.745474,44.747126,44.747213,44.745628,44.745249,44.744357,44.742041,44.740717,44.738868,44.739093,44.737389,44.735949,44.734328,44.731398,44.728998,44.727872,44.726005,44.72647,44.724808,44.727122,44.726986,44.724884,44.722776,44.721846,44.718693,44.719488,44.718554,44.719766,44.721091,44.720729,44.721555,44.721547,44.722886,44.724173,44.723436,44.719166,44.715774,44.712657,44.710861,44.708948,44.707521,44.706374,44.705666,44.704,44.705289,44.709199,44.710035,44.71003,44.710944,44.712393,44.713621,44.712865,44.712425,44.712027,44.711729,44.711606,44.711339,44.711163,44.710958,44.710678,44.710619,44.709055,44.708664,44.709331,44.708903,44.706237,44.7061,44.704765,44.706081,44.705886,44.704031,44.702462,44.695931,44.692755,44.691562,44.690074,44.688532,44.684021,44.681049,44.679134,44.677878,44.675417,44.67433,44.669929,44.665556,44.665925,44.665698,44.663566,44.664484,44.663639,44.661871,44.66142,44.658729,44.656632,44.65559,44.656297,44.655396,44.653084,44.652859,44.650017,44.652451,44.653206,44.654376,44.652691,44.652595,44.653966,44.654828,44.652801,44.648687,44.647164,44.646543,44.644739,44.644169,44.643025,44.641444,44.641388,44.643381,44.643539,44.642871,44.643001,44.641555,44.642928,44.644419,44.64645,44.645905,44.646102,44.645121,44.643484,44.643038,44.639823,44.639769,44.637965,44.639377,44.639263,44.635601,44.631821,44.631204,44.628403,44.626656,44.625024,44.621341,44.618969,44.617901,44.616775,44.61249,44.61098,44.609502,44.610007,44.608374,44.608771,44.605442,44.603863,44.601609,44.597549,44.595679,44.592251,44.591181,44.589939,44.58881,44.587851,44.58605,44.585317,44.582581,44.581034,44.577082,44.575043,44.572539,44.570658,44.569192,44.567896,44.566543,44.564173,44.562368,44.56119,44.562207,44.563778,44.565112,44.564453,44.565182,44.567029,44.562544,44.560056,44.559716,44.556217,44.554977,44.553654,44.551086,44.550466,44.548608,44.548037,44.54759,44.545392,44.542545,44.541274,44.539108,44.536041,44.537216,44.538112,44.53281,44.531191,44.528638,44.526215,44.523791,44.521255,44.519056,44.514035,44.512089,44.509207,44.507891,44.506397,44.50479,44.502494,44.498025,44.496334,44.493629,44.491714,44.488219,44.485906,44.484385,44.480101,44.478912,44.474856,44.474066,44.471699,44.469162,44.466621,44.466172,44.462786,44.459231,44.45958,44.461433,44.462276,44.45974,44.458504,44.458337,44.456869,44.457882,44.457777,44.456458,44.454457,44.452648,44.452872,44.454282,44.455921,44.456766,44.455072,44.453439,44.448984,44.444531,44.443008,44.438442,44.432468,44.428179,44.426207,44.423503,44.421752,44.416737,44.414309,44.411717,44.40997,44.4088,44.407153,44.403825,44.401907,44.399426,44.397508,44.39858,44.398748,44.397454,44.394828,44.394126,44.391195,44.388993,44.385782,44.383807,44.380988,44.378619,44.372909,44.370845,44.373036,44.373543,44.371744,44.369882,44.36914,44.368133,44.364889,44.362848,44.359247,44.356125,44.353977,44.352126,44.350936,44.350716,44.349406,44.346428,44.344848,44.340343,44.336551,44.334584,44.325517,44.322048,44.319045,44.318331,44.315917,44.313051,44.309518,44.306626,44.304536,44.302617,44.297932,44.294188,44.289246,44.288546,44.287046,44.28383,44.278536,44.277057,44.277036,44.255248,44.255211,44.255384,44.256824,44.257343,44.256129,44.212548,44.21255,44.183239,44.039862,44.039075,44.040388,44.040374,44.040375,44.040266,44.046995,44.047775,44.047828,43.960733,43.960227,43.960462,43.960374,43.959593,43.95892,44.220277,44.220276,44.307045,44.34547,44.389206,44.38917,44.454961,44.461288,44.534131,44.621785,44.652251,44.652252,44.762701,44.823299,44.823343,44.995117]}]],[[{"lng":[-123.816709,-123.734996,-123.735153,-123.715538,-123.715675,-123.715866,-123.72014,-123.720065,-123.720071,-123.699976,-123.68952,-123.679097,-123.66875,-123.648669,-123.608115,-123.597677,-123.59763,-123.597233,-123.596134,-123.596674,-123.596919,-123.596929,-123.602817,-123.602794,-123.603143,-123.602609,-123.580966,-123.54132,-123.47056,-123.438419,-123.414116,-123.409764,-123.339138,-123.316612,-123.301882,-123.240276,-123.23521,-123.221593,-123.201917,-123.182025,-123.149025,-123.147507,-123.147489,-123.145982,-123.143316,-123.1366,-123.133244,-123.126206,-123.12453,-123.121299,-123.119339,-123.119212,-123.117517,-123.116892,-123.114522,-123.111736,-123.105532,-123.100643,-123.092509,-123.089254,-123.087313,-123.086173,-123.084184,-123.07836,-123.074838,-123.073643,-123.073132,-123.074291,-123.078206,-123.088313,-123.095339,-123.09675,-123.101193,-123.105311,-123.105836,-123.108685,-123.110063,-123.112528,-123.119519,-123.121978,-123.126206,-123.133623,-123.136988,-123.14252,-123.150434,-123.15707,-123.16132,-123.164428,-123.17088,-123.171739,-123.172124,-123.171855,-123.169674,-123.17011,-123.171626,-123.174226,-123.179922,-123.181816,-123.183175,-123.183449,-123.182812,-123.18291,-123.18392,-123.187849,-123.19519,-123.198028,-123.198645,-123.198355,-123.19701,-123.191431,-123.18719,-123.184161,-123.183202,-123.183011,-123.185375,-123.18564,-123.19195,-123.195441,-123.203044,-123.206301,-123.214573,-123.221793,-123.227875,-123.232606,-123.251209,-123.251831,-123.25212,-123.253373,-123.254317,-123.256178,-123.260251,-123.260791,-123.260739,-123.260151,-123.250991,-123.247404,-123.24292,-123.242113,-123.241754,-123.24579,-123.248391,-123.250254,-123.253376,-123.251728,-123.250029,-123.245055,-123.240081,-123.238067,-123.233093,-123.231079,-123.228001,-123.22581,-123.222672,-123.218023,-123.214683,-123.212619,-123.211967,-123.214343,-123.215082,-123.214409,-123.214778,-123.219354,-123.221019,-123.220156,-123.219144,-123.214276,-123.213426,-123.213992,-123.216169,-123.216462,-123.213822,-123.211785,-123.211866,-123.211306,-123.209831,-123.208492,-123.206317,-123.205287,-123.207587,-123.209194,-123.212903,-123.215459,-123.21886,-123.224857,-123.227466,-123.228054,-123.227685,-123.225841,-123.222195,-123.21938,-123.219345,-123.220377,-123.222904,-123.226797,-123.229311,-123.229331,-123.229324,-123.229146,-123.22896,-123.227668,-123.225099,-123.22345,-123.223614,-123.229297,-123.233258,-123.235868,-123.238668,-123.242821,-123.244952,-123.245157,-123.244701,-123.242288,-123.239283,-123.23416,-123.230813,-123.22595,-123.223754,-123.221167,-123.219011,-123.219661,-123.222699,-123.226797,-123.229529,-123.23319,-123.235048,-123.235102,-123.233245,-123.230581,-123.229399,-123.228599,-123.228518,-123.229898,-123.232316,-123.237425,-123.240744,-123.245334,-123.245678,-123.244844,-123.239365,-123.236564,-123.229862,-123.224557,-123.220295,-123.21691,-123.217585,-123.216802,-123.217302,-123.216178,-123.214125,-123.211304,-123.204394,-123.200105,-123.197359,-123.193766,-123.193097,-123.193752,-123.190897,-123.18975,-123.190365,-123.193657,-123.193575,-123.191102,-123.187851,-123.183671,-123.180388,-123.200385,-123.224885,-123.230044,-123.248679,-123.288655,-123.328667,-123.367696,-123.371408,-123.371411,-123.451272,-123.455686,-123.471685,-123.472186,-123.532858,-123.556039,-123.573614,-123.59329,-123.593513,-123.715377,-123.715386,-123.723588,-123.767931,-123.775598,-123.775789,-123.816525,-123.816709],"lat":[44.344622,44.345778,44.36035,44.360458,44.379969,44.389495,44.389506,44.432329,44.433374,44.433788,44.433582,44.433928,44.432935,44.43342,44.433671,44.433109,44.46932,44.477454,44.477454,44.541804,44.545624,44.651139,44.651159,44.702125,44.709242,44.721154,44.719415,44.72127,44.720722,44.720622,44.720552,44.720531,44.720059,44.719994,44.719835,44.719914,44.720146,44.720125,44.720099,44.720085,44.720225,44.717047,44.714848,44.711407,44.70831,44.702178,44.700002,44.696014,44.693903,44.691353,44.684493,44.682083,44.678592,44.676966,44.675549,44.674826,44.674763,44.675959,44.675887,44.674727,44.672546,44.66814,44.665294,44.662326,44.659373,44.657331,44.652359,44.649613,44.646585,44.643195,44.641107,44.640814,44.639818,44.639202,44.63915,44.639262,44.639801,44.640594,44.640896,44.640363,44.639291,44.638056,44.637775,44.63787,44.637507,44.637269,44.637619,44.637507,44.634245,44.632428,44.628866,44.62779,44.624542,44.622674,44.621011,44.620036,44.619901,44.619,44.61745,44.616087,44.613029,44.611036,44.609246,44.60723,44.604953,44.602857,44.60042,44.599046,44.59756,44.595896,44.595583,44.594289,44.593077,44.590002,44.587298,44.587179,44.585814,44.585615,44.586063,44.586028,44.585376,44.584597,44.583056,44.581496,44.574626,44.574095,44.573848,44.572781,44.571477,44.566167,44.559351,44.557491,44.556365,44.555148,44.551983,44.550583,44.548154,44.547324,44.544575,44.539654,44.536969,44.532434,44.52887,44.526486,44.525947,44.526172,44.528059,44.527969,44.524644,44.522623,44.516608,44.513286,44.510982,44.51022,44.507681,44.504978,44.501218,44.495079,44.494188,44.491014,44.488627,44.486962,44.484751,44.482585,44.481805,44.479649,44.476371,44.473803,44.471695,44.468473,44.460622,44.457143,44.452756,44.450269,44.448576,44.447397,44.445745,44.443038,44.437074,44.435239,44.434572,44.434638,44.434205,44.434126,44.433293,44.431889,44.42996,44.426664,44.422371,44.419436,44.416461,44.415712,44.416941,44.417256,44.415073,44.414213,44.414127,44.41312,44.41221,44.406912,44.39935,44.395505,44.393452,44.388135,44.386089,44.385229,44.384887,44.385352,44.384143,44.382254,44.380821,44.377715,44.374888,44.37205,44.371131,44.370322,44.36901,44.366149,44.362497,44.35993,44.359588,44.360124,44.359847,44.358396,44.356979,44.354622,44.352618,44.348468,44.345995,44.344606,44.342591,44.340852,44.339869,44.338879,44.337789,44.33363,44.332099,44.330984,44.329186,44.328999,44.330779,44.331266,44.32943,44.324952,44.32066,44.317272,44.313726,44.310808,44.309747,44.309222,44.308716,44.308829,44.308573,44.306974,44.305646,44.303354,44.29984,44.295892,44.294963,44.292272,44.290742,44.287587,44.285562,44.28493,44.283725,44.283725,44.283725,44.283725,44.283726,44.283724,44.283725,44.283719,44.283725,44.281021,44.280496,44.280647,44.281185,44.281471,44.281523,44.281402,44.282597,44.281915,44.276699,44.280267,44.283946,44.283944,44.283606,44.283547,44.316167,44.315303,44.344622]}]],[[{"lng":[-121.031202,-121.026348,-121.024374,-121.022556,-121.019811,-121.018483,-121.018588,-121.017429,-121.01569,-121.01079,-121.007455,-121.005447,-121.000973,-120.997673,-120.992973,-120.990473,-120.988673,-120.986474,-120.985498,-120.982776,-120.979647,-120.973089,-120.972589,-120.97387,-120.974381,-120.973344,-120.97218,-120.969577,-120.966974,-120.963672,-120.959771,-120.956471,-120.955773,-120.954171,-120.947171,-120.946071,-120.945771,-120.946472,-120.953872,-120.955372,-120.955072,-120.953672,-120.949472,-120.946372,-120.940771,-120.938471,-120.935871,-120.93377,-120.93237,-120.932169,-120.933068,-120.935868,-120.939568,-120.939628,-120.938472,-120.934171,-120.930471,-120.923671,-120.921771,-120.920471,-120.919771,-120.920475,-120.920371,-120.918671,-120.914371,-120.909271,-120.904671,-120.901065,-120.899371,-120.899771,-120.898171,-120.89428,-120.889071,-120.883445,-120.883039,-120.881064,-120.879164,-120.877522,-120.872479,-120.868265,-120.866962,-120.865759,-120.866075,-120.868235,-120.868569,-120.86607,-120.86657,-120.86157,-120.86267,-120.86287,-120.86209,-120.85917,-120.854872,-120.852271,-120.84987,-120.84947,-120.851771,-120.856371,-120.859571,-120.863971,-120.865071,-120.865771,-120.865371,-120.862871,-120.861871,-120.861471,-120.860972,-120.859072,-120.856571,-120.847671,-120.845671,-120.837971,-120.836073,-120.835571,-120.837371,-120.837471,-120.839171,-120.839071,-120.838172,-120.833377,-120.833178,-120.83458,-120.838981,-120.838881,-120.837783,-120.836184,-120.834585,-120.828587,-120.82629,-120.825731,-120.827084,-120.833877,-120.838772,-120.841972,-120.853673,-120.854473,-120.864073,-120.865268,-120.869928,-120.874893,-120.877966,-120.882656,-120.884318,-120.884777,-120.884644,-120.884983,-120.890264,-120.896833,-120.898438,-120.899356,-120.903006,-120.908459,-120.909382,-120.908205,-120.906528,-120.905657,-120.905899,-120.904815,-120.903013,-120.896872,-120.895674,-120.895397,-120.896478,-120.898788,-120.901176,-120.906075,-120.909275,-120.911675,-120.911282,-120.906375,-120.904375,-120.903975,-120.904775,-120.907361,-120.909223,-120.912191,-120.914281,-120.914976,-120.915795173154,-120.913476,-120.895575,-120.885616086084,-120.870042,-120.855674,-120.836141479114,-120.788872,-120.724171,-120.68937,-120.668869,-120.6535343441,-120.649368,-120.649368,-120.646168,-120.646068,-120.643668,-120.640368,-120.638568,-120.635868,-120.631668,-120.629067,-120.624467,-120.618567,-120.612267,-120.609967,-120.606167,-120.604867,-120.603466,-120.603766,-120.602466,-120.600466,-120.593766,-120.587066,-120.583366,-120.577565,-120.574265,-120.572265,-120.569465,-120.567465,-120.566965,-120.560065,-120.558264,-120.556464,-120.553064,-120.552064,-120.551164,-120.549064,-120.547364,-120.544783,-120.539245,-120.535308,-120.531013,-120.528516,-120.524742,-120.520924,-120.517573,-120.515688,-120.513313,-120.510188,-120.508107,-120.506384,-120.499805,-120.498461,-120.496624,-120.493853,-120.490833,-120.488779,-120.488689,-120.489739,-120.492223,-120.492223,-120.491732,-120.489585,-120.485156,-120.48244,-120.48231,-120.479903,-120.479474,-120.478341,-120.47836,-120.479181,-120.480276,-120.482367,-120.485326,-120.486421,-120.484741,-120.481042,-120.479303,-120.477833,-120.478087,-120.477475,-120.472696,-120.469915,-120.47018,-120.46897,-120.46795,-120.464725,-120.459735,-120.45746,-120.453915,-120.452159,-120.449588,-120.44422,-120.440538,-120.438299,-120.439925,-120.444612,-120.446258,-120.446592,-120.444248,-120.438889,-120.432693,-120.428135,-120.426305,-120.421999,-120.416052,-120.411699,-120.410742,-120.409413,-120.408982,-120.409128,-120.408536,-120.40536,-120.404938,-120.402654,-120.402578,-120.404832,-120.407117,-120.407663,-120.407038,-120.405673,-120.402107,-120.401323,-120.392574,-120.390763,-120.388305,-120.386122,-120.385845,-120.384579,-120.381856,-120.377466,-120.372265,-120.365267,-120.359875,-120.35798,-120.357804,-120.359512,-120.365401,-120.369313,-120.372139,-120.375793,-120.376156,-120.380486,-120.380493,-120.379469,-120.377837,-120.376304,-120.370994,-120.367013,-120.365217,-120.364122,-120.360771,-120.359976,-120.360827,-120.363246,-120.364955,-120.365655,-120.367855,-120.373427,-120.377756,-120.382056,-120.386686,-120.394456,-120.399056,-120.405557,-120.409557,-120.414957,-120.422581,-120.426856,-120.426057,-120.423357,-120.424257,-120.423257,-120.420557,-120.417857,-120.412857,-120.411057,-120.407256,-120.407022,-120.409948,-120.416409,-120.421449,-120.422903,-120.429082,-120.43323,-120.438779,-120.441284,-120.446592,-120.449907,-120.45441,-120.459937,-120.462291,-120.46966,-120.472759,-120.477559,-120.481228,-120.483859,-120.490359,-120.495859,-120.493459,-120.491759,-120.489859,-120.486359,-120.482359,-120.481559,-120.483459,-120.489859,-120.493659,-120.495159,-120.496859,-120.496059,-120.492159,-120.487859,-120.484435,-120.482941,-120.483658,-120.486758,-120.492259,-120.493959,-120.501159,-120.501859,-120.505859,-120.506459,-120.506059,-120.502959,-120.494059,-120.489058,-120.484158,-120.482958,-120.484258,-120.489258,-120.492258,-120.495759,-120.498759,-120.501159,-120.502659,-120.506259,-120.507959,-120.509659,-120.514759,-120.519859,-120.525059,-120.527559,-120.528659,-120.519359,-120.518459,-120.523059,-120.525259,-120.528159,-120.530159,-120.532059,-120.532559,-120.529759,-120.522659,-120.515159,-120.513358,-120.512558,-120.513158,-120.514958,-120.516659,-120.521859,-120.524059,-120.523459,-120.524459,-120.527059,-120.532059,-120.534459,-120.534659,-120.531859,-120.530659,-120.533659,-120.533659,-120.535559,-120.540159,-120.543059,-120.543359,-120.541459,-120.533958,-120.532458,-120.531258,-120.530458,-120.531258,-120.530758,-120.530958,-120.531958,-120.534358,-120.539658,-120.541258,-120.539358,-120.535158,-120.529458,-120.527358,-120.528058,-120.527458,-120.530358,-120.538758,-120.540458,-120.540758,-120.538858,-120.531858,-120.525558,-120.524658,-120.524057,-120.524457,-120.527757,-120.531558,-120.534658,-120.536858,-120.537758,-120.538558,-120.540358,-120.542258,-120.545458,-120.548158,-120.547758,-120.546658,-120.544258,-120.542758,-120.543158,-120.544858,-120.547358,-120.553358,-120.555558,-120.553158,-120.549158,-120.547858,-120.542858,-120.541758,-120.540257,-120.540289,-120.541857,-120.545158,-120.546358,-120.547057,-120.544657,-120.541657,-120.538157,-120.535957,-120.533657,-120.534457,-120.535757,-120.540657,-120.542857,-120.550957,-120.554457,-120.556057,-120.552057,-120.550663,-120.551139,-120.550357,-120.546457,-120.544157,-120.542956,-120.541656,-120.543656,-120.545356,-120.544856,-120.541956,-120.540056,-120.534156,-120.530056,-120.528456,-120.525956,-120.524455,-120.523855,-120.524455,-120.527555,-120.529355,-120.533055,-120.537556,-120.540256,-120.542856,-120.543008,-120.541755,-120.540955,-120.536755,-120.534055,-120.532555,-120.531655,-120.529055,-120.524155,-120.521555,-120.520455,-120.521254,-120.519354,-120.516054,-120.509454,-120.506254,-120.502854,-120.497954,-120.493553,-120.48849,-120.484853,-120.481653,-120.480953,-120.481153,-120.482353,-120.487153,-120.487653,-120.485552,-120.483352,-120.480152,-120.474752,-120.472652,-120.473652,-120.476752,-120.480152,-120.482552,-120.484052,-120.483552,-120.480252,-120.476852,-120.472951,-120.469549,-120.468551,-120.468951,-120.471551,-120.474951,-120.476251,-120.476751,-120.476251,-120.475351,-120.466995,-120.464991,-120.46295,-120.457069,-120.45225,-120.44886,-120.450097,-120.453041,-120.45505,-120.45865,-120.46045,-120.46215,-120.465706,-120.463787,-120.460249,-120.458449,-120.458449,-120.461049,-120.460549,-120.461249,-120.463448,-120.463648,-120.462548,-120.464548,-120.467448,-120.468449,-120.468849,-120.470649,-120.476849,-120.479249,-120.482849,-120.486949,-120.491949,-120.494749,-120.498149,-120.50115,-120.50345,-120.506864,-120.51005,-120.51485,-120.512249,-120.508549,-120.504449,-120.503733,-120.504419,-120.626232,-120.688617,-120.729792,-120.730182,-120.729292,-120.729487,-120.728574,-120.726329,-120.727391,-120.727052,-120.728455,-120.727736,-120.726605,-120.725299,-120.722581,-120.721768,-120.720072,-120.718099,-120.719022,-120.718381,-120.718645,-120.722032,-120.722779,-120.72414,-120.72332,-120.724375,-120.723166,-120.726786,-120.727515,-120.731003,-120.733197,-120.734189,-120.737715,-120.739885,-120.742358,-120.744025,-120.745747,-120.74657,-120.747881,-120.74927,-120.75116,-120.753057,-120.75508,-120.757615,-120.761281,-120.761838,-120.76099,-120.764167,-120.765987,-120.76907,-120.769379,-120.767914,-120.767269,-120.769803,-120.770957,-120.771887,-120.776469,-120.779175,-120.781447,-120.785207,-120.789015,-120.790705,-120.791689,-120.793721,-120.79614,-120.797512,-120.799513,-120.801544,-120.802598,-120.804459,-120.807057,-120.810019,-120.810337,-120.814098,-120.816572,-120.818038,-120.82114,-120.824421,-120.826779,-120.828702,-120.830944,-120.8339,-120.83473,-120.837282,-120.838408,-120.841194,-120.846485,-120.848278,-120.850241,-120.852133,-120.855029,-120.857412,-120.858274,-120.862649,-120.866917,-120.869892,-120.874104,-120.880732,-120.883252,-120.885464,-120.889357,-120.890777,-120.891826,-120.893665,-120.89586,-120.896262,-120.900336,-120.903867,-120.906598,-120.907903,-120.91103,-120.913498,-120.915516,-120.920404,-120.921218,-120.918168,-120.919952,-120.92356,-120.925671,-120.928255,-120.929924,-120.930986,-120.932135,-120.933105,-120.934796,-120.937582,-120.939568,-120.940399,-120.941741,-120.943269,-120.944643,-120.945892,-120.948817,-120.949477,-120.95345,-120.955009,-120.952541,-120.952936,-120.95377,-120.960641,-120.96269,-120.965499,-120.969286,-120.971202,-120.976906,-120.978751,-120.979915,-120.981623,-120.982904,-120.984454,-120.987364,-120.987691,-120.990604,-120.992661,-120.994305,-120.996115,-120.996341,-120.998011,-121.002122,-121.004846,-121.005607,-121.00779,-121.009205,-121.012104,-121.013426,-121.012758,-121.01339,-121.015251,-121.017818,-121.018916,-121.019213,-121.017603,-121.017866,-121.022616,-121.024,-121.024294,-121.023358,-121.021783,-121.020802,-121.023205,-121.02369,-121.019103,-121.020535,-121.022339,-121.024289,-121.020562,-121.022387,-121.022886,-121.025146,-121.025194,-121.023648,-121.023799,-121.0217,-121.022667,-121.022588,-121.023321,-121.022639,-121.024033,-121.022217,-121.020367,-121.018924,-121.019468,-121.023617,-121.024876,-121.024135,-121.021053,-121.017426,-121.017771,-121.020739,-121.028421,-121.03044,-121.031202],"lat":[45.285857,45.288917,45.289725,45.291386,45.294684,45.297022,45.301504,45.30514,45.307148,45.309269,45.31006,45.309698,45.307644,45.306544,45.307444,45.309344,45.312644,45.318543,45.320256,45.321963,45.322652,45.320315,45.319027,45.316643,45.312945,45.309899,45.308635,45.307437,45.30694,45.306845,45.307945,45.310345,45.313445,45.316745,45.323445,45.325045,45.327145,45.331345,45.333445,45.334445,45.335645,45.337245,45.337645,45.336745,45.332645,45.331345,45.330844,45.331343,45.332443,45.336443,45.337843,45.340244,45.342046,45.345588,45.346845,45.347745,45.347745,45.347345,45.348045,45.349245,45.351645,45.356144,45.359344,45.361345,45.362645,45.362145,45.360745,45.361596,45.364245,45.370245,45.374445,45.378322,45.383145,45.387278,45.390457,45.392552,45.392414,45.391687,45.388216,45.38852,45.389224,45.391231,45.393451,45.397879,45.401146,45.409346,45.412746,45.422746,45.425346,45.427346,45.428414,45.428645,45.426945,45.427145,45.428545,45.431445,45.433645,45.434645,45.435846,45.439046,45.440546,45.445046,45.446046,45.448446,45.450346,45.454546,45.456246,45.459946,45.461546,45.461946,45.462746,45.467346,45.469146,45.471246,45.474546,45.475646,45.479546,45.483245,45.485645,45.493046,45.494646,45.497345,45.501841,45.502441,45.504841,45.506742,45.507742,45.509945,45.511466,45.514077,45.515307,45.515968,45.515946,45.517546,45.521846,45.523446,45.528746,45.528848,45.528391,45.526944,45.526771,45.527564,45.529435,45.531695,45.538782,45.539326,45.541614,45.54268,45.543979,45.549261,45.553406,45.558241,45.561148,45.564497,45.565662,45.568928,45.571842,45.576068,45.579033,45.585914,45.586685,45.589342,45.592333,45.596399,45.598387,45.600345,45.602445,45.605245,45.608839,45.613245,45.615745,45.617145,45.621645,45.626731,45.627939,45.632496,45.634693,45.636345,45.641301218792,45.640045,45.642945,45.6500815780723,45.661242,45.671545,45.6758434879127,45.686246,45.706446,45.715847,45.730147,45.7372486812962,45.732947,45.730246,45.726146,45.723946,45.722346,45.721046,45.720846,45.721546,45.720646,45.721346,45.722047,45.721447,45.717847,45.715847,45.714547,45.713047,45.706647,45.704747,45.702847,45.702247,45.701548,45.701648,45.700048,45.698648,45.696048,45.695448,45.693748,45.690648,45.686048,45.682348,45.681648,45.679448,45.678348,45.677548,45.672548,45.670148,45.669048,45.669195,45.671165,45.671852,45.671899,45.671177,45.668983,45.667379,45.666867,45.66608,45.66596,45.665119,45.663944,45.661515,45.656275,45.655788,45.655522,45.656147,45.655946,45.654991,45.654794,45.651677,45.648977,45.648871,45.643504,45.643312,45.645171,45.645177,45.645166,45.645151,45.644858,45.642019,45.640653,45.639518,45.639181,45.639391,45.638269,45.637158,45.635036,45.634178,45.633047,45.630668,45.628747,45.627752,45.626368,45.624827,45.622829,45.620066,45.619321,45.619673,45.621577,45.622016,45.624286,45.62586,45.626584,45.627031,45.626112,45.622848,45.621291,45.618006,45.615692,45.613944,45.607454,45.602365,45.598438,45.597302,45.597164,45.597602,45.597026,45.596067,45.595318,45.592508,45.589052,45.583655,45.581893,45.576728,45.574605,45.569936,45.567051,45.565666,45.563101,45.559754,45.557779,45.556725,45.555641,45.554154,45.551701,45.549859,45.548723,45.546732,45.54431,45.541528,45.538808,45.537535,45.537733,45.537249,45.535359,45.533713,45.531459,45.530316,45.53113,45.531392,45.530644,45.528385,45.527588,45.523731,45.521584,45.519428,45.518166,45.518095,45.516641,45.515253,45.51424,45.51263,45.509832,45.508034,45.505691,45.501064,45.49725,45.49655,45.49525,45.493714,45.49295,45.49445,45.496787,45.49705,45.49695,45.49745,45.49825,45.49875,45.50051,45.49795,45.49395,45.49195,45.48605,45.48365,45.48285,45.48305,45.48255,45.48185,45.47445,45.473147,45.470332,45.468636,45.468017,45.469243,45.471716,45.472994,45.475768,45.478877,45.48369,45.485275,45.485194,45.480212,45.478808,45.476929,45.476149,45.472649,45.471983,45.470249,45.468949,45.465349,45.462649,45.462049,45.462449,45.461749,45.459549,45.456549,45.455349,45.453649,45.451849,45.450549,45.446949,45.444049,45.443649,45.442549,45.440716,45.438548,45.435549,45.434349,45.434249,45.434549,45.433999,45.433249,45.431749,45.430649,45.428249,45.427949,45.428249,45.426949,45.422849,45.420549,45.419249,45.416849,45.417349,45.418649,45.419049,45.418749,45.417249,45.407749,45.405749,45.405049,45.404349,45.405449,45.405249,45.403449,45.400349,45.396349,45.394649,45.388849,45.387249,45.386549,45.385449,45.383249,45.381549,45.380449,45.381849,45.381149,45.380649,45.378649,45.376849,45.375649,45.375749,45.377849,45.376849,45.373549,45.372549,45.371849,45.371249,45.370249,45.368449,45.366149,45.363849,45.358149,45.352949,45.351749,45.349949,45.347649,45.346049,45.345249,45.344149,45.343649,45.342049,45.339249,45.336549,45.335149,45.332249,45.331449,45.331449,45.330649,45.329349,45.327749,45.328449,45.328149,45.324249,45.320949,45.319149,45.317549,45.315849,45.314749,45.311549,45.309749,45.309049,45.305749,45.304049,45.30015,45.29915,45.295949,45.294749,45.295049,45.296349,45.297849,45.302749,45.304349,45.304549,45.302549,45.298349,45.296449,45.295549,45.291449,45.288049,45.285649,45.284449,45.284449,45.283249,45.281249,45.279649,45.281049,45.281049,45.279649,45.279049,45.276049,45.274864,45.271849,45.269049,45.267249,45.262949,45.261649,45.261649,45.262449,45.26185,45.25905,45.25585,45.25495,45.253255,45.253849,45.253349,45.252749,45.250449,45.246649,45.244146,45.242426,45.240849,45.237249,45.236649,45.235149,45.231949,45.228449,45.223949,45.222449,45.220249,45.219849,45.22325,45.22465,45.22465,45.22385,45.22255,45.22035,45.21885,45.21675,45.21635,45.21665,45.21785,45.217049,45.213649,45.212507,45.210349,45.209949,45.21115,45.21125,45.21065,45.20605,45.20475,45.20445,45.20535,45.20445,45.20265,45.20105,45.19925,45.19785,45.19615,45.19555,45.19575,45.19765,45.197233,45.19485,45.19335,45.19125,45.18895,45.18665,45.18365,45.18075,45.17955,45.17945,45.18015,45.17975,45.17765,45.17565,45.17325,45.17235,45.17235,45.17155,45.17025,45.16895,45.16835,45.16595,45.16494,45.16355,45.16215,45.15955,45.15775,45.15645,45.15415,45.15185,45.15105,45.146686,45.144196,45.14405,45.145483,45.14545,45.143185,45.140883,45.139253,45.13945,45.13885,45.13795,45.13505,45.130127,45.125985,45.12315,45.12065,45.11945,45.11625,45.11165,45.10865,45.10515,45.10375,45.10115,45.10015,45.10155,45.10285,45.10695,45.10855,45.11165,45.11015,45.10505,45.10435,45.10585,45.10575,45.10455,45.1041,45.10265,45.102778,45.10135,45.09465,45.09095,45.08725,45.08565,45.083477,45.083477,45.083589,45.083695,45.083731,45.085907,45.086873,45.088765,45.089885,45.091092,45.093143,45.095639,45.097334,45.099715,45.100225,45.103616,45.105245,45.106348,45.106596,45.111056,45.114616,45.117583,45.119629,45.121757,45.124848,45.126089,45.127872,45.129578,45.130522,45.131673,45.132358,45.133054,45.135077,45.134533,45.1344,45.134805,45.136159,45.136322,45.137567,45.139557,45.140314,45.142267,45.142428,45.144024,45.144321,45.143845,45.144461,45.145745,45.149272,45.150189,45.153147,45.155435,45.156511,45.157141,45.158737,45.160367,45.162337,45.162694,45.162405,45.163256,45.162708,45.164184,45.163077,45.163302,45.164828,45.165086,45.164483,45.165388,45.165421,45.166442,45.167929,45.168318,45.167194,45.170074,45.170973,45.172641,45.172219,45.172811,45.175916,45.17698,45.175965,45.176743,45.178981,45.179206,45.180176,45.181246,45.184218,45.185869,45.1877,45.189509,45.190206,45.189711,45.193073,45.193862,45.195112,45.19465,45.196764,45.198991,45.198138,45.199481,45.200624,45.199802,45.202305,45.202158,45.201016,45.200704,45.202121,45.203031,45.203406,45.202794,45.203096,45.200337,45.199614,45.199505,45.198189,45.197811,45.198744,45.201804,45.20288,45.201783,45.20033,45.199781,45.200555,45.203523,45.203315,45.201543,45.200106,45.2006,45.199612,45.198147,45.198131,45.200084,45.200797,45.200171,45.200435,45.201916,45.201454,45.200533,45.199129,45.196589,45.196232,45.197026,45.198343,45.198167,45.200064,45.199855,45.200423,45.19887,45.198832,45.200164,45.20007,45.197788,45.198917,45.200376,45.204264,45.204362,45.203313,45.204881,45.206422,45.208369,45.20892,45.20822,45.209422,45.211071,45.211051,45.208977,45.210143,45.21213,45.212996,45.213307,45.212389,45.212678,45.215473,45.216733,45.217611,45.217972,45.218455,45.219531,45.220811,45.22145,45.222909,45.22377,45.225219,45.227813,45.229872,45.23038,45.232197,45.235346,45.236331,45.237762,45.23835,45.239548,45.241133,45.241928,45.245501,45.246643,45.249845,45.251226,45.261002,45.264107,45.264793,45.266282,45.268668,45.270476,45.271766,45.275176,45.27644,45.278573,45.281969,45.284738,45.28618,45.284328,45.28481,45.285857]}]],[[{"lng":[-123.260791,-123.260251,-123.256178,-123.254317,-123.253373,-123.25212,-123.251831,-123.251209,-123.232606,-123.227875,-123.221793,-123.214573,-123.206301,-123.203044,-123.195441,-123.19195,-123.18564,-123.185375,-123.183011,-123.183202,-123.184161,-123.18719,-123.191431,-123.19701,-123.198355,-123.198645,-123.198028,-123.19519,-123.187849,-123.18392,-123.18291,-123.182812,-123.183449,-123.183175,-123.181816,-123.179922,-123.174226,-123.171626,-123.17011,-123.169674,-123.171855,-123.172124,-123.171739,-123.17088,-123.164428,-123.16132,-123.15707,-123.150434,-123.14252,-123.136988,-123.133623,-123.126206,-123.121978,-123.119519,-123.112528,-123.110063,-123.108685,-123.105836,-123.105311,-123.101193,-123.09675,-123.095339,-123.088313,-123.078206,-123.074291,-123.073132,-123.073643,-123.074838,-123.07836,-123.084184,-123.086173,-123.087313,-123.089254,-123.092509,-123.100643,-123.105532,-123.111736,-123.114522,-123.116892,-123.117517,-123.119212,-123.119339,-123.121299,-123.12453,-123.126206,-123.133244,-123.1366,-123.143316,-123.145982,-123.147489,-123.147507,-123.149025,-123.150297,-123.150763,-123.150429,-123.146582,-123.137819,-123.133529,-123.132445,-123.1327,-123.135106,-123.137757,-123.140884,-123.143843,-123.142191,-123.139759,-123.13696,-123.133831,-123.12769,-123.123007,-123.120155,-123.119733,-123.120253,-123.118721,-123.113025,-123.111578,-123.107712,-123.106032,-123.105377,-123.100881,-123.099242,-123.095772,-123.092658,-123.089503,-123.086457,-123.081389,-123.078903,-123.076375,-123.07173,-123.066818,-123.062154,-123.061117,-123.060721,-123.061431,-123.061853,-123.060106,-123.055342,-123.053026,-123.050025,-123.044987,-123.043527,-123.042037,-123.041354,-123.040809,-123.039988,-123.039828,-123.039451,-123.041897,-123.042756,-123.041567,-123.03941,-123.035804,-123.034095,-123.031884,-123.027127,-123.024002,-123.019999,-123.018153,-123.016667,-123.015825,-123.015148,-123.01509,-123.01474,-123.013866,-123.013824,-123.014433,-123.015049,-123.015765,-123.016551,-123.017345,-123.018679,-123.018747,-123.018734,-123.018598,-123.018367,-123.018107,-123.015982,-123.014599,-123.01383,-123.013065,-123.012491,-123.01133,-123.010604,-123.007595,-123.006847,-123.005477,-123.004903,-123.001831,-123.000013,-122.998717,-122.996297,-122.996025,-122.997623,-122.998293,-122.996175,-122.993648,-122.991695,-122.990027,-122.988675,-122.986746,-122.985042,-122.979769,-122.975862,-122.974427,-122.973649,-122.973993,-122.97364,-122.97265,-122.971694,-122.969086,-122.964661,-122.962703,-122.957256,-122.955481,-122.949349,-122.947659,-122.943228,-122.937846,-122.93408,-122.931922,-122.929381,-122.929887,-122.928097,-122.925638,-122.922578,-122.919464,-122.919518,-122.916886,-122.913298,-122.909888,-122.909232,-122.906842,-122.90538,-122.902456,-122.900612,-122.899397,-122.897648,-122.895184,-122.892398,-122.891829,-122.890258,-122.884958,-122.882731,-122.87453,-122.873245,-122.873219,-122.871689,-122.868847,-122.864965,-122.861237,-122.856157,-122.852323,-122.849696,-122.8471,-122.846935,-122.848492,-122.847178,-122.845145,-122.842851,-122.839763,-122.839136,-122.832797,-122.828925,-122.825426,-122.821487,-122.819465,-122.815899,-122.813769,-122.813636,-122.812321,-122.807949,-122.805408,-122.803195,-122.804166,-122.800709,-122.794418,-122.793327,-122.787691,-122.783465,-122.779831,-122.778248,-122.773998,-122.768613,-122.765303,-122.763398,-122.762124,-122.759186,-122.757763,-122.753221,-122.748027,-122.743446,-122.737302,-122.732714,-122.729355,-122.727945,-122.726418,-122.724795,-122.721705,-122.719631,-122.715588,-122.713778,-122.705411,-122.700531,-122.696463,-122.694844,-122.690864,-122.683555,-122.680574,-122.677492,-122.670774,-122.66985,-122.660327,-122.653472,-122.65029,-122.645826,-122.64073,-122.639144,-122.634129,-122.627139,-122.621327,-122.620463,-122.618014,-122.61524,-122.607766,-122.603458,-122.599469,-122.597363,-122.582836,-122.576929,-122.572269,-122.5701,-122.569953,-122.568548,-122.568195,-122.56693,-122.564402,-122.56151,-122.553888,-122.546669,-122.542407,-122.541561,-122.538944,-122.536666,-122.532911,-122.531042,-122.521912,-122.52029,-122.522561,-122.52245,-122.520625,-122.520605,-122.519439,-122.511612,-122.50559,-122.503151,-122.496565,-122.487637,-122.484798,-122.480122,-122.477499,-122.475677,-122.475968,-122.475835,-122.473551,-122.469302,-122.46124,-122.457333,-122.454774,-122.443897,-122.443103,-122.442151,-122.441817,-122.44036,-122.436918,-122.435041,-122.431319,-122.428316,-122.423287,-122.419433,-122.412346,-122.411213,-122.410988,-122.410944,-122.411198,-122.41099,-122.41,-122.408208,-122.406298,-122.4027,-122.400882,-122.397991,-122.394416,-122.39138,-122.38863,-122.382079,-122.378629,-122.372462,-122.370076,-122.362732,-122.35614,-122.354329,-122.34955,-122.343213,-122.340708,-122.334685,-122.333374,-122.328534,-122.325742,-122.32137,-122.318858,-122.317447,-122.311568,-122.308786,-122.306909,-122.302935,-122.300164,-122.292897,-122.288569,-122.282872,-122.278591,-122.276675,-122.27376,-122.274,-122.273067,-122.271886,-122.269612,-122.264381,-122.261423,-122.259394,-122.255448,-122.255066,-122.253592,-122.250044,-122.247582,-122.246528,-122.245971,-122.242203,-122.23706,-122.237408,-122.23292,-122.231438,-122.23037,-122.22769,-122.224659,-122.222145,-122.220719,-122.218413,-122.21445,-122.210663,-122.207421,-122.204021,-122.199334,-122.198685,-122.198046,-122.196732,-122.193924,-122.189405,-122.184557,-122.179739,-122.178684,-122.174251,-122.171843,-122.166572,-122.164191,-122.161118,-122.156292,-122.154325,-122.152774,-122.149224,-122.14237,-122.138702,-122.132685,-122.130972,-122.128698,-122.124247,-122.122466,-122.121442,-122.119821,-122.119828,-122.118702,-122.11344,-122.110688,-122.108719,-122.107563,-122.103815,-122.100326,-122.096559,-122.09404,-122.088617,-122.086244,-122.08412,-122.081091,-122.077104,-122.075401,-122.074393,-122.071823,-122.069796,-122.068144,-122.065765,-122.063939,-122.060621,-122.058813,-122.056484,-122.054415,-122.050762,-122.047028,-122.046094,-122.045304,-122.040875,-122.03598,-122.034171,-122.033006,-122.030498,-122.028916,-122.026339,-122.024106,-122.020851,-122.01847,-122.016709,-122.015715,-122.011684,-122.008804,-122.005291,-122.003216,-122.001009,-121.999761,-121.996208,-121.992926,-121.984527,-121.981681,-121.980176,-121.977179,-121.974303,-121.973503,-121.971604,-121.967345,-121.966375,-121.964997,-121.963805,-121.799562,-121.800402,-121.800929,-121.799675,-121.799241,-121.800345,-121.800936,-121.800563,-121.801611,-121.801092,-121.798296,-121.798435,-121.798805,-121.799036,-121.798969,-121.79865,-121.797993,-121.797622,-121.797991,-121.799566,-121.799432,-121.797945,-121.800054,-121.801352,-121.80273,-121.802244,-121.80419,-121.805488,-121.805763,-121.808206,-121.807491,-121.80941,-121.810189,-121.811566,-121.81069,-121.806559,-121.804756,-121.802325,-121.802162,-121.800331,-121.798646,-121.800926,-121.800216,-121.795192,-121.795273,-121.793895,-121.79518,-121.796859,-121.798363,-121.799965,-121.799081,-121.800051,-121.79921,-121.800617,-121.801265,-121.800708,-121.801798,-121.803133,-121.802093,-121.802801,-121.803286,-121.804825,-121.807092,-121.806817,-121.807657,-121.811331,-121.813604,-121.8138,-121.815832,-121.816317,-121.816073,-121.813482,-121.812509,-121.813074,-121.811212,-121.809419,-121.809382,-121.809865,-121.814698,-121.815638,-121.818283,-121.819453,-121.823104,-121.824155,-121.82561,-121.829007,-121.832405,-121.834668,-121.839796,-121.843914,-121.844861,-121.84688,-121.847359,-121.848875,-121.84938,-121.847034,-121.845971,-121.844366,-121.843049,-121.844256,-121.844453,-121.843955,-121.847093,-121.849512,-121.849462,-121.847634,-121.847291,-121.848791,-121.848139,-121.848677,-121.847502,-121.844408,-121.84291,-121.841128,-121.841535,-121.844711,-121.846615,-121.846191,-121.847578,-121.847561,-121.845745,-121.84552,-121.845334,-121.844403,-121.845531,-121.843146,-121.843244,-121.841332,-121.842528,-121.845745,-121.845128,-121.846519,-121.846756,-121.846123,-121.843218,-121.843138,-121.843906,-121.843159,-121.845488,-121.846471,-121.843678,-121.845412,-121.844616,-121.843342,-121.841952,-121.843679,-121.844914,-121.845989,-121.843458,-121.842406,-121.839822,-121.83738,-121.836875,-121.837076,-121.839415,-121.84041,-121.8439,-121.843443,-121.841828,-121.840536,-121.838253,-121.837607,-121.838718,-121.838718,-121.83956,-121.838263,-121.839298,-121.840783,-121.840443,-121.838989,-121.838745,-121.840333,-121.840437,-121.838501,-121.83719,-121.838672,-121.838296,-121.838676,-121.839829,-121.840178,-121.841105,-121.840588,-121.841346,-121.837029,-121.832349,-121.829123,-121.825631,-121.824693,-121.824493,-121.825031,-121.824508,-121.822017,-121.820794,-121.820058,-121.818602,-121.819172,-121.814002,-121.812668,-121.807791,-121.80525,-121.800871,-121.799426,-121.960126,-121.964517,-122.028016,-122.027996,-122.228368,-122.264527,-122.264527,-122.32715,-122.32949,-122.332446,-122.331478,-122.328531,-122.325744,-122.328729,-122.327313,-122.330673,-122.331857,-122.334249,-122.336791,-122.339923,-122.340612,-122.347714,-122.352623,-122.354488,-122.355447,-122.35689,-122.358069,-122.361244,-122.363745,-122.364257,-122.367197,-122.371128,-122.373799,-122.379589,-122.38457,-122.384561,-122.404781,-122.404748,-122.425089,-122.425081,-122.426446,-122.430218,-122.434885,-122.438796,-122.442879,-122.445272,-122.448436,-122.451074,-122.456337,-122.457892,-122.463518,-122.465628,-122.468798,-122.470829,-122.47368,-122.478045,-122.479635,-122.484305,-122.488381,-122.492272,-122.497,-122.499506,-122.503182,-122.507203,-122.510561,-122.511964,-122.512251,-122.513425,-122.519391,-122.522442,-122.528191,-122.529542,-122.531171,-122.532942,-122.532614,-122.533745,-122.535382,-122.539632,-122.543711,-122.545794,-122.548543,-122.549707,-122.551917,-122.554953,-122.558723,-122.562413,-122.565493,-122.567339,-122.570153,-122.573085,-122.577232,-122.57778,-122.575169,-122.5754,-122.57677,-122.579831,-122.582028,-122.585624,-122.588363,-122.591986,-122.593471,-122.599071,-122.604621,-122.608342,-122.611738,-122.617391,-122.622312,-122.624857,-122.631432,-122.637437,-122.639699,-122.640716,-122.644082,-122.64493,-122.645763,-122.644542,-122.64679,-122.646853,-122.651583,-122.652553,-122.655773,-122.657909,-122.663697,-122.665931,-122.668915,-122.670787,-122.674283,-122.676247,-122.678543,-122.680863,-122.683333,-122.686703,-122.689353,-122.692063,-122.693973,-122.696412,-122.696076,-122.700224,-122.704483,-122.706473,-122.710473,-122.71472,-122.717134,-122.721184,-122.722692,-122.724937,-122.725089,-122.725697,-122.727574,-122.731121,-122.738128,-122.742034,-122.744584,-122.746347,-122.749834,-122.753255,-122.758014,-122.758905,-122.762735,-122.768734,-122.771265,-122.774074,-122.776319,-122.779134,-122.781625,-122.784205,-122.788615,-122.791085,-122.795605,-122.798259,-122.802825,-122.804727,-122.807156,-122.811705,-122.814416,-122.817065,-122.819352,-122.823015,-122.82527,-122.829074,-122.828717,-122.830352,-122.830451,-122.833148,-122.835135,-122.837442,-122.839919,-122.843403,-122.845096,-122.846854,-122.849343,-122.852796,-122.856452,-122.860134,-122.861992,-122.865465,-122.865545,-122.872923,-122.884125,-122.903999,-122.905755,-122.979199,-122.97952,-122.985827,-123.038121,-123.038427,-123.040799,-123.060853,-123.07167,-123.127696,-123.165428,-123.166002,-123.164226,-123.160434,-123.15787,-123.15911,-123.155708,-123.152389,-123.150627,-123.15034,-123.1512,-123.153386,-123.156542,-123.159533,-123.163604,-123.166868,-123.169341,-123.171308,-123.174204,-123.175342,-123.17878,-123.178903,-123.177701,-123.17501,-123.174938,-123.174054,-123.174174,-123.175133,-123.175977,-123.179931,-123.180388,-123.183671,-123.187851,-123.191102,-123.193575,-123.193657,-123.190365,-123.18975,-123.190897,-123.193752,-123.193097,-123.193766,-123.197359,-123.200105,-123.204394,-123.211304,-123.214125,-123.216178,-123.217302,-123.216802,-123.217585,-123.21691,-123.220295,-123.224557,-123.229862,-123.236564,-123.239365,-123.244844,-123.245678,-123.245334,-123.240744,-123.237425,-123.232316,-123.229898,-123.228518,-123.228599,-123.229399,-123.230581,-123.233245,-123.235102,-123.235048,-123.23319,-123.229529,-123.226797,-123.222699,-123.219661,-123.219011,-123.221167,-123.223754,-123.22595,-123.230813,-123.23416,-123.239283,-123.242288,-123.244701,-123.245157,-123.244952,-123.242821,-123.238668,-123.235868,-123.233258,-123.229297,-123.223614,-123.22345,-123.225099,-123.227668,-123.22896,-123.229146,-123.229324,-123.229331,-123.229311,-123.226797,-123.222904,-123.220377,-123.219345,-123.21938,-123.222195,-123.225841,-123.227685,-123.228054,-123.227466,-123.224857,-123.21886,-123.215459,-123.212903,-123.209194,-123.207587,-123.205287,-123.206317,-123.208492,-123.209831,-123.211306,-123.211866,-123.211785,-123.213822,-123.216462,-123.216169,-123.213992,-123.213426,-123.214276,-123.219144,-123.220156,-123.221019,-123.219354,-123.214778,-123.214409,-123.215082,-123.214343,-123.211967,-123.212619,-123.214683,-123.218023,-123.222672,-123.22581,-123.228001,-123.231079,-123.233093,-123.238067,-123.240081,-123.245055,-123.250029,-123.251728,-123.253376,-123.250254,-123.248391,-123.24579,-123.241754,-123.242113,-123.24292,-123.247404,-123.250991,-123.260151,-123.260739,-123.260791],"lat":[44.557491,44.559351,44.566167,44.571477,44.572781,44.573848,44.574095,44.574626,44.581496,44.583056,44.584597,44.585376,44.586028,44.586063,44.585615,44.585814,44.587179,44.587298,44.590002,44.593077,44.594289,44.595583,44.595896,44.59756,44.599046,44.60042,44.602857,44.604953,44.60723,44.609246,44.611036,44.613029,44.616087,44.61745,44.619,44.619901,44.620036,44.621011,44.622674,44.624542,44.62779,44.628866,44.632428,44.634245,44.637507,44.637619,44.637269,44.637507,44.63787,44.637775,44.638056,44.639291,44.640363,44.640896,44.640594,44.639801,44.639262,44.63915,44.639202,44.639818,44.640814,44.641107,44.643195,44.646585,44.649613,44.652359,44.657331,44.659373,44.662326,44.665294,44.66814,44.672546,44.674727,44.675887,44.675959,44.674763,44.674826,44.675549,44.676966,44.678592,44.682083,44.684493,44.691353,44.693903,44.696014,44.700002,44.702178,44.70831,44.711407,44.714848,44.717047,44.720225,44.722689,44.72578,44.727611,44.731585,44.736145,44.738662,44.741157,44.743363,44.745741,44.747062,44.747632,44.748914,44.7488,44.749592,44.751258,44.752109,44.751372,44.751272,44.752475,44.753731,44.756922,44.758445,44.759483,44.759049,44.752966,44.751034,44.748844,44.746553,44.746215,44.746539,44.747551,44.747011,44.745997,44.743343,44.743073,44.743504,44.74615,44.748094,44.748042,44.747124,44.744883,44.743405,44.738869,44.737684,44.737034,44.737627,44.73849,44.738451,44.73808,44.737595,44.73726,44.736823,44.735833,44.735417,44.733589,44.731045,44.728972,44.725243,44.723498,44.721804,44.720551,44.72107,44.723951,44.725578,44.725376,44.723642,44.72213,44.721154,44.719877,44.71976,44.717341,44.714894,44.712904,44.710897,44.709128,44.707409,44.705776,44.704244,44.700354,44.699592,44.699336,44.698774,44.69816,44.697591,44.694116,44.69276,44.691887,44.691194,44.690794,44.690091,44.689732,44.68794,44.686898,44.687041,44.68809,44.688924,44.686916,44.687233,44.689016,44.690286,44.69212,44.694101,44.695699,44.696058,44.693872,44.693479,44.694026,44.695985,44.696526,44.696492,44.697578,44.698606,44.700518,44.702888,44.705845,44.707984,44.709874,44.713103,44.714277,44.715557,44.721094,44.720937,44.718634,44.717986,44.715479,44.714889,44.71578,44.716995,44.719301,44.720663,44.72222,44.721852,44.723703,44.724935,44.726906,44.728611,44.729806,44.732507,44.736472,44.737503,44.739187,44.739819,44.741044,44.743794,44.744958,44.743985,44.745129,44.747499,44.748623,44.750569,44.751034,44.751136,44.752291,44.75506,44.757137,44.758216,44.7583,44.758055,44.759186,44.760755,44.76229,44.767536,44.769308,44.772644,44.774063,44.77468,44.774362,44.770896,44.770616,44.770298,44.77072,44.771708,44.775523,44.778194,44.777942,44.779591,44.783213,44.785209,44.785434,44.786855,44.78903,44.789678,44.791578,44.791537,44.791563,44.793666,44.794422,44.79278,44.792603,44.793463,44.792765,44.793174,44.792586,44.791419,44.790249,44.790451,44.789642,44.787738,44.787808,44.789479,44.789109,44.789677,44.792106,44.793214,44.792929,44.791364,44.789338,44.781647,44.780196,44.778523,44.777245,44.777267,44.77602,44.775417,44.776088,44.777371,44.777923,44.777574,44.777719,44.780277,44.781136,44.781976,44.782401,44.784738,44.787054,44.787861,44.787851,44.789107,44.789213,44.788863,44.788271,44.784075,44.782461,44.778181,44.777804,44.777214,44.776476,44.775558,44.774732,44.774716,44.774001,44.771258,44.769646,44.768072,44.767942,44.768217,44.767362,44.766239,44.765619,44.764863,44.766226,44.766867,44.766805,44.764031,44.762046,44.760641,44.758945,44.755686,44.754101,44.753486,44.752692,44.750074,44.749763,44.751043,44.754001,44.755009,44.755819,44.75489,44.753934,44.752567,44.752096,44.752139,44.753742,44.755564,44.755633,44.755259,44.755009,44.754725,44.753858,44.753404,44.753528,44.755458,44.756134,44.754761,44.752751,44.751448,44.753528,44.752011,44.752512,44.752753,44.753124,44.753908,44.754134,44.754428,44.754739,44.755006,44.755047,44.753697,44.752316,44.753131,44.755029,44.754362,44.752082,44.752014,44.754975,44.756511,44.757428,44.757225,44.75766,44.75804,44.756864,44.755972,44.755412,44.756323,44.756705,44.758759,44.758822,44.759289,44.758914,44.75621,44.75611,44.75549,44.75525,44.754257,44.753979,44.753062,44.750634,44.747099,44.746135,44.741007,44.738496,44.735506,44.734203,44.732929,44.73179,44.729275,44.728796,44.725706,44.723565,44.722504,44.722005,44.720745,44.719361,44.717246,44.713068,44.706416,44.705106,44.70099,44.698465,44.697668,44.697071,44.696937,44.695981,44.694399,44.693239,44.694456,44.696236,44.695977,44.697184,44.69617,44.696784,44.700798,44.703218,44.703152,44.703685,44.705819,44.707001,44.708729,44.710244,44.713151,44.71368,44.715565,44.717039,44.717671,44.719643,44.724254,44.726127,44.7261,44.725179,44.721143,44.718005,44.718001,44.717151,44.715879,44.714143,44.713165,44.71193,44.710977,44.710107,44.708855,44.707172,44.706996,44.707611,44.707154,44.705825,44.704358,44.702552,44.702147,44.699471,44.698712,44.700608,44.700734,44.700448,44.698365,44.697478,44.697193,44.696426,44.696384,44.697513,44.697043,44.693644,44.692955,44.692841,44.692286,44.688731,44.688263,44.688084,44.687338,44.685799,44.685691,44.687201,44.688861,44.689948,44.690218,44.689988,44.690819,44.690836,44.690576,44.687317,44.686724,44.688618,44.68911,44.687445,44.687755,44.690406,44.689704,44.69226,44.693787,44.693635,44.691065,44.692141,44.691926,44.689168,44.685483,44.685564,44.684129,44.683888,44.683915,44.683013,44.67856,44.676467,44.672991,44.671413,44.665891,44.663489,44.660301,44.657456,44.654228,44.653849,44.653385,44.652762,44.652275,44.651538,44.650642,44.649507,44.64721,44.646223,44.643578,44.640313,44.639156,44.637365,44.63719,44.636033,44.633771,44.63302,44.631081,44.628211,44.623723,44.622239,44.617967,44.615767,44.61439,44.613731,44.611599,44.610439,44.608412,44.606225,44.605198,44.603152,44.600249,44.597702,44.596546,44.594056,44.592814,44.588985,44.582152,44.581321,44.579193,44.576399,44.573115,44.572228,44.570839,44.567833,44.566362,44.564929,44.562017,44.559782,44.555321,44.553353,44.551851,44.548444,44.546928,44.545235,44.54353,44.541745,44.539172,44.537376,44.534596,44.531585,44.527784,44.525157,44.519831,44.517546,44.514425,44.513812,44.513325,44.512108,44.512981,44.512045,44.511203,44.510048,44.50698,44.504256,44.502985,44.499335,44.495385,44.492775,44.491746,44.49109,44.488942,44.486706,44.484523,44.483275,44.483372,44.481512,44.479035,44.475957,44.473565,44.471833,44.470459,44.468364,44.466672,44.464364,44.462899,44.461925,44.459549,44.458411,44.454743,44.451388,44.447288,44.444912,44.441974,44.437707,44.433879,44.431791,44.430542,44.428753,44.426582,44.424733,44.420456,44.417873,44.414634,44.413395,44.4118,44.41103,44.409387,44.408824,44.407373,44.404103,44.4022,44.398504,44.395459,44.39263,44.390962,44.389094,44.387299,44.385609,44.383067,44.380153,44.376556,44.37563,44.372889,44.372037,44.370509,44.366867,44.365129,44.361769,44.359568,44.358276,44.357319,44.355981,44.35436,44.351721,44.346432,44.342144,44.340291,44.33971,44.336549,44.334022,44.331492,44.329789,44.327522,44.325139,44.322279,44.320984,44.318174,44.31418,44.312483,44.310141,44.308217,44.307229,44.303011,44.300168,44.299044,44.29663,44.293641,44.291095,44.289461,44.287955,44.285652,44.286844,44.285323,44.28498,44.283437,44.282624,44.280192,44.274814,44.273641,44.271389,44.26845,44.267804,44.263933,44.26195,44.260241,44.260656,44.260147,44.259495,44.25955,44.25828,44.257313,44.257238,44.256164,44.253818,44.253847,44.253847,44.25263,44.252841,44.249537,44.243382,44.240603,44.238506,44.237579,44.234719,44.231189,44.229606,44.227653,44.226938,44.227001,44.224454,44.221577,44.221659,44.220742,44.219183,44.217265,44.216311,44.213326,44.211748,44.211945,44.21102,44.20938,44.209667,44.210413,44.20944,44.211013,44.217063,44.216938,44.22058,44.220657,44.218198,44.218544,44.220296,44.221306,44.21871,44.218543,44.217388,44.216748,44.21805,44.219036,44.220805,44.222209,44.223039,44.222599,44.222878,44.222406,44.219196,44.219132,44.22148,44.221927,44.219967,44.222308,44.222611,44.22167,44.223448,44.2262,44.227819,44.22982,44.231535,44.230717,44.228581,44.226498,44.226715,44.228633,44.22987,44.231511,44.233706,44.23486,44.23431,44.235184,44.235022,44.235588,44.235344,44.232295,44.231089,44.230568,44.231617,44.230575,44.229347,44.228689,44.229146,44.228044,44.22979,44.234628,44.235358,44.236587,44.237819,44.238046,44.239178,44.24123,44.242953,44.244427,44.24447,44.244228,44.245298,44.246867,44.247801,44.249852,44.25002,44.249189,44.249458,44.249263,44.251096,44.252551,44.253458,44.25681,44.260088,44.264246,44.266384,44.267078,44.26881,44.269688,44.271093,44.270062,44.269093,44.268902,44.270633,44.271849,44.273535,44.27327,44.274128,44.274459,44.27373,44.273948,44.275387,44.275771,44.277019,44.278893,44.279938,44.27822,44.279319,44.27937,44.281603,44.280931,44.281778,44.282775,44.283162,44.285639,44.286668,44.286529,44.28823,44.285828,44.287467,44.286051,44.285909,44.28473,44.28724,44.289137,44.290066,44.290537,44.288119,44.286729,44.284609,44.283816,44.283909,44.2834,44.283459,44.28565,44.285866,44.285708,44.284724,44.284435,44.283952,44.284171,44.27983,44.276269,44.27639,44.275804,44.27432,44.276858,44.277106,44.278525,44.28097,44.282166,44.282285,44.283455,44.282129,44.281352,44.281187,44.283601,44.284282,44.284298,44.285539,44.285373,44.285586,44.286662,44.287317,44.25898,44.258952,44.258894,44.259129,44.200736,44.200616,44.200613,44.200572,44.200129,44.200745,44.200136,44.200077,44.200024,44.200016,44.200071,44.201877,44.204725,44.207989,44.211612,44.214094,44.219947,44.222689,44.2252,44.226627,44.228779,44.231343,44.233269,44.233078,44.235315,44.240113,44.245854,44.247537,44.248114,44.248645,44.251601,44.253056,44.255751,44.259514,44.261582,44.266608,44.267131,44.275152,44.277606,44.283431,44.283725,44.28493,44.285562,44.287587,44.290742,44.292272,44.294963,44.295892,44.29984,44.303354,44.305646,44.306974,44.308573,44.308829,44.308716,44.309222,44.309747,44.310808,44.313726,44.317272,44.32066,44.324952,44.32943,44.331266,44.330779,44.328999,44.329186,44.330984,44.332099,44.33363,44.337789,44.338879,44.339869,44.340852,44.342591,44.344606,44.345995,44.348468,44.352618,44.354622,44.356979,44.358396,44.359847,44.360124,44.359588,44.35993,44.362497,44.366149,44.36901,44.370322,44.371131,44.37205,44.374888,44.377715,44.380821,44.382254,44.384143,44.385352,44.384887,44.385229,44.386089,44.388135,44.393452,44.395505,44.39935,44.406912,44.41221,44.41312,44.414127,44.414213,44.415073,44.417256,44.416941,44.415712,44.416461,44.419436,44.422371,44.426664,44.42996,44.431889,44.433293,44.434126,44.434205,44.434638,44.434572,44.435239,44.437074,44.443038,44.445745,44.447397,44.448576,44.450269,44.452756,44.457143,44.460622,44.468473,44.471695,44.473803,44.476371,44.479649,44.481805,44.482585,44.484751,44.486962,44.488627,44.491014,44.494188,44.495079,44.501218,44.504978,44.507681,44.51022,44.510982,44.513286,44.516608,44.522623,44.524644,44.527969,44.528059,44.526172,44.525947,44.526486,44.52887,44.532434,44.536969,44.539654,44.544575,44.547324,44.548154,44.550583,44.551983,44.555148,44.556365,44.557491]}]],[[{"lng":[-123.664749,-123.648969,-123.645909,-123.64362,-123.642355,-123.64134,-123.641389,-123.64295,-123.644987,-123.650637,-123.65773,-123.659517,-123.663013,-123.664993,-123.664749],"lat":[46.24431,46.248461,46.248494,46.248936,46.248754,46.247981,46.247204,46.246304,46.246071,46.244072,46.243367,46.243493,46.242576,46.242691,46.24431]}],[{"lng":[-124.012634,-124.005028,-124.000212,-123.999324,-123.996234,-123.988866,-123.988429,-123.991718,-123.995997,-123.995521,-123.989817,-123.986252,-123.98031,-123.972942,-123.961739,-123.953971,-123.950506,-123.950413615329,-123.947417,-123.927038,-123.924050837444,-123.923582,-123.905277,-123.903064,-123.900449,-123.902501,-123.891762,-123.883336,-123.878821,-123.87478,-123.860943,-123.859272926153,-123.859049388323,-123.857591219399,-123.85574673717,-123.854801,-123.847572098271,-123.847209,-123.845341184316,-123.842849,-123.839603,-123.838415,-123.838415,-123.838415,-123.838415,-123.838415,-123.838415,-123.843644,-123.851904098175,-123.859911,-123.861859819695,-123.862896,-123.866643,-123.864209,-123.85776,-123.854941,-123.849652258608,-123.846209,-123.838801,-123.824412679777,-123.821834,-123.798702737971,-123.793936,-123.787774156994,-123.783204,-123.771027240351,-123.770201,-123.766873,-123.763308,-123.757589,-123.750569859726,-123.748097,-123.744294,-123.735733,-123.725279,-123.718149,-123.69343,-123.693131268615,-123.67865639816,-123.674178,-123.67538,-123.672039,-123.666751,-123.660868,-123.6535,-123.644231,-123.632347,-123.626436257279,-123.619512,-123.614521,-123.60196,-123.595982,-123.582434,-123.559617,-123.548156,-123.547659,-123.538092,-123.526391,-123.516188,-123.501245,-123.479644,-123.474844,-123.468743,-123.46455181596,-123.447592,-123.436254852847,-123.427629,-123.428054143685,-123.430987,-123.422645419531,-123.390404,-123.379541,-123.371433,-123.363743140809,-123.36375,-123.364023,-123.364329,-123.364652,-123.365152,-123.365677,-123.365373,-123.365968,-123.366516,-123.367438,-123.359614,-123.359489,-123.360303,-123.360564,-123.360427,-123.360365,-123.360627,-123.358826,-123.360794,-123.361003,-123.361622,-123.48513,-123.485086,-123.54582,-123.56717,-123.644355,-123.653642,-123.662297,-123.682896,-123.703567,-123.720001,-123.71984,-123.84338,-123.86475,-123.957356,-123.969078621366,-123.968018,-123.968984,-123.965982,-123.961544,-123.962232,-123.964606,-123.963968585885,-123.962515,-123.962736,-123.964284,-123.965946886424,-123.967231,-123.966477037815,-123.965629,-123.965756551586,-123.967625694786,-123.96763,-123.969864540348,-123.971516,-123.971831,-123.97413,-123.978446,-123.978286,-123.977933,-123.980423,-123.983825,-123.983734,-123.985063,-123.988716,-123.99304,-123.991272,-123.993703,-123.988391,-123.98571,-123.980835,-123.974998,-123.973854,-123.975067,-123.974074,-123.972927,-123.969991,-123.957438,-123.956212174103,-123.952063,-123.941831,-123.937578073856,-123.937471,-123.936976303464,-123.936393232754,-123.933810595383,-123.927891,-123.927931398902,-123.927973474601,-123.928928749063,-123.92933,-123.929984556436,-123.933366,-123.941611463287,-123.941929939178,-123.947531,-123.95919,-123.961625301618,-123.963419924031,-123.96377569977,-123.974124,-123.977403593384,-123.986469758432,-123.996766,-124.010344,-124.021428,-124.012634],"lat":[46.23685,46.23833,46.236416,46.233726,46.22978,46.22715,46.224132,46.220408,46.219092,46.216461,46.209224,46.208237,46.206921,46.212678,46.207916,46.207159,46.20577,46.2056637980039,46.202219,46.191617,46.1907284574343,46.190589,46.18069,46.176812,46.174343,46.168704,46.164978,46.168747,46.168089,46.162821,46.158597,46.1582557524132,46.1582100767413,46.1579121278649,46.1575352432675,46.157342,46.1586398125733,46.158705,46.1594863981209,46.160529,46.162163,46.166607,46.168457353916,46.168498,46.170013,46.1700320231959,46.171051,46.171545,46.1760307507397,46.180379,46.1823480586939,46.183395,46.187674,46.189527,46.190757,46.188465,46.1910179139907,46.19268,46.192211,46.1905845016097,46.190293,46.1952595302013,46.196283,46.1975788702633,46.19854,46.2040782109177,46.204454,46.206263,46.211033,46.213001,46.2078971118656,46.206099,46.203961,46.201257,46.195077,46.188989,46.189812,46.1899422023193,46.1962510864866,46.198203,46.212401,46.215474,46.218228,46.216296,46.214652,46.213172,46.213172,46.2141565865164,46.21531,46.217612,46.224749,46.226328,46.230525,46.243426,46.249018,46.259109,46.26061,46.263404,46.266153,46.271004,46.269131,46.267831,46.264531,46.2616183143491,46.249832,46.2381989727856,46.229348,46.2232991346567,46.181571,46.1759919270221,46.154428,46.150998,46.146372,46.1463246103232,46.135489,46.127255,46.125069,46.120724,46.111274,46.099071,46.08312,46.069546,46.058442,46.039528,46.039372,46.011211,45.953538,45.953402,45.879307,45.874827,45.866592,45.836657,45.808172,45.786853,45.779579,45.780021,45.775657,45.775055,45.775411,45.774548,45.77503,45.774656,45.77367,45.773735,45.77308,45.783218,45.783518,45.782754,45.783121,45.7830789476988,45.798472,45.802941,45.80642,45.837101,45.847203,45.856809,45.8589678554596,45.863891,45.869974,45.881946,45.8835462531041,45.884782,45.8883409650687,45.892344,45.8933296722535,45.9077737308722,45.907807,45.9091893558919,45.910211,45.915345,45.917156,45.918179,45.923825,45.928564,45.930863,45.931092,45.933217,45.935011,45.93575,45.938842,45.942494,45.946431,45.94906,45.951157,45.952828,45.956129,45.959261,45.961683,45.962858,45.966328,45.969139,45.974469,45.9747292171811,45.97561,45.97566,45.9772655771636,45.977306,45.978971753744,45.9809350830733,45.9896314000151,46.009564,46.010474,46.0114217704711,46.032939676254,46.041978,46.0467937578809,46.071672,46.0975516365884,46.0985512214542,46.116131,46.141675,46.1460979734688,46.1493573509761,46.1500035077577,46.168798,46.173895405281,46.1879867611841,46.20399,46.223514,46.230109,46.23685]}],[{"lng":[-124.035223,-124.032609,-124.031183,-124.025439,-124.025607,-124.02402,-124.021516,-124.020328,-124.016684,-124.013832,-124.008841,-124.008929,-124.011218,-124.018586,-124.025003,-124.028331,-124.036174,-124.035223],"lat":[46.285137,46.284973,46.28333,46.284567,46.290697,46.290834,46.286917,46.282975,46.279388,46.27331,46.26723,46.26557,46.265752,46.271995,46.274131,46.273967,46.281523,46.285137]}]],[[{"lng":[-121.805269,-121.804426,-121.80044,-121.798154,-121.793219,-121.788805,-121.784556,-121.781958,-121.781098,-121.781588,-121.781121,-121.778803,-121.779132,-121.779672,-121.78183,-121.781727,-121.779906,-121.778672,-121.770738,-121.766495,-121.755915,-121.752152,-121.751454,-121.749443,-121.744103,-121.740994,-121.737791,-121.735545,-121.730625,-121.725175,-121.720814,-121.717652,-121.716996,-121.718681,-121.718977,-121.722407,-121.722584,-121.715266,-121.714462,-121.710813,-121.707639,-121.699939,-121.698143,-121.697656,-121.696035,-121.693396,-121.691214,-121.688164,-121.683277,-121.680346,-121.672405,-121.660852,-121.65871,-121.66043,-121.660419,-121.660828,-121.659639,-121.656909,-121.653593,-121.652018,-121.651394,-121.652732,-121.653315,-121.652581,-121.652638,-121.653866,-121.657245,-121.660444,-121.661656,-121.662415,-121.662382,-121.662881,-121.664694,-121.665717,-121.667021,-121.677722,-121.682723,-121.685005,-121.687776,-121.69088,-121.693387,-121.695074,-121.696085,-121.699675,-121.69865,-121.700208,-121.702383,-121.706179,-121.70805,-121.708402,-121.710291,-121.71065,-121.710201,-121.710503,-121.711596,-121.712219,-121.715716,-121.718675,-121.723999,-121.725283,-121.727194,-121.728533,-121.729226,-121.730168,-121.731438,-121.732018,-121.733403,-121.736506,-121.738794,-121.740329,-121.743454,-121.746454,-121.747973,-121.748649,-121.749061,-121.748245,-121.74687,-121.741175,-121.738512,-121.736292,-121.73492,-121.73048,-121.727341,-121.719697,-121.715592,-121.714469,-121.712953,-121.711275,-121.710517,-121.709251,-121.705971,-121.703592,-121.69945,-121.698375,-121.697685,-121.691112,-121.689772,-121.685082,-121.682607,-121.684475,-121.686262,-121.685304,-121.684793,-121.681537,-121.682463,-121.680898,-121.689261,-121.691878,-121.696411,-121.696479,-121.635917,-121.614577,-121.481888,-121.480617,-121.480361,-121.480879,-121.480159,-121.481441,-121.481798,-121.481719,-121.482056,-121.481813,-121.481753,-121.482168,-121.440646,-121.440551,-121.441224595532,-121.423592,-121.401739,-121.383451776795,-121.372574,-121.365470443381,-121.351267011354,-121.33777,-121.312198,-121.294453886635,-121.287323,-121.251183,-121.215779,-121.204808148559,-121.200367,-121.196631142901,-121.195233,-121.196149220098,-121.196556,-121.183841,-121.170474994227,-121.167852,-121.145534,-121.140560367303,-121.139483,-121.131953,-121.129228277698,-121.123793795051,-121.123239617734,-121.1222,-121.120085996729,-121.117052,-121.120064,-121.084933,-121.071453407883,-121.06437,-121.033582,-121.007449,-120.983478,-120.977978,-120.953077,-120.943977,-120.915876,-120.915795173154,-120.914976,-120.914281,-120.912191,-120.909223,-120.907361,-120.904775,-120.903975,-120.904375,-120.906375,-120.911282,-120.911675,-120.909275,-120.906075,-120.901176,-120.898788,-120.896478,-120.895397,-120.895674,-120.896872,-120.903013,-120.904815,-120.905899,-120.905657,-120.906528,-120.908205,-120.909382,-120.908459,-120.903006,-120.899356,-120.898438,-120.896833,-120.890264,-120.884983,-120.884644,-120.884777,-120.884318,-120.882656,-120.877966,-120.874893,-120.869928,-120.865268,-120.864073,-120.854473,-120.853673,-120.841972,-120.838772,-120.833877,-120.827084,-120.825731,-120.82629,-120.828587,-120.834585,-120.836184,-120.837783,-120.838881,-120.838981,-120.83458,-120.833178,-120.833377,-120.838172,-120.839071,-120.839171,-120.837471,-120.837371,-120.835571,-120.836073,-120.837971,-120.845671,-120.847671,-120.856571,-120.859072,-120.860972,-120.861471,-120.861871,-120.862871,-120.865371,-120.865771,-120.865071,-120.863971,-120.859571,-120.856371,-120.851771,-120.84947,-120.84987,-120.852271,-120.854872,-120.85917,-120.86209,-120.86287,-120.86267,-120.86157,-120.86657,-120.86607,-120.868569,-120.868235,-120.866075,-120.865759,-120.866962,-120.868265,-120.872479,-120.877522,-120.879164,-120.881064,-120.883039,-120.883445,-120.889071,-120.89428,-120.898171,-120.899771,-120.899371,-120.901065,-120.904671,-120.909271,-120.914371,-120.918671,-120.920371,-120.920475,-120.919771,-120.920471,-120.921771,-120.923671,-120.930471,-120.934171,-120.938472,-120.939628,-120.939568,-120.935868,-120.933068,-120.932169,-120.93237,-120.93377,-120.935871,-120.938471,-120.940771,-120.946372,-120.949472,-120.953672,-120.955072,-120.955372,-120.953872,-120.946472,-120.945771,-120.946071,-120.947171,-120.954171,-120.955773,-120.956471,-120.959771,-120.963672,-120.966974,-120.969577,-120.97218,-120.973344,-120.974381,-120.97387,-120.972589,-120.973089,-120.979647,-120.982776,-120.985498,-120.986474,-120.988673,-120.990473,-120.992973,-120.997673,-121.000973,-121.005447,-121.007455,-121.01079,-121.01569,-121.017429,-121.018588,-121.018483,-121.019811,-121.022556,-121.024374,-121.026348,-121.031202,-121.03044,-121.028421,-121.020739,-121.017771,-121.017426,-121.021053,-121.024135,-121.024876,-121.023617,-121.019468,-121.018924,-121.020367,-121.022217,-121.024033,-121.022639,-121.023321,-121.022588,-121.022667,-121.0217,-121.023799,-121.023648,-121.025194,-121.025146,-121.022886,-121.022387,-121.020562,-121.024289,-121.022339,-121.020535,-121.019103,-121.02369,-121.023205,-121.020802,-121.021783,-121.023358,-121.024294,-121.024,-121.022616,-121.017866,-121.017603,-121.019213,-121.018916,-121.017818,-121.015251,-121.01339,-121.012758,-121.013426,-121.012104,-121.009205,-121.00779,-121.005607,-121.004846,-121.002122,-120.998011,-120.996341,-120.996115,-120.994305,-120.992661,-120.990604,-120.987691,-120.987364,-120.984454,-120.982904,-120.981623,-120.979915,-120.978751,-120.976906,-120.971202,-120.969286,-120.965499,-120.96269,-120.960641,-120.95377,-120.952936,-120.952541,-120.955009,-120.95345,-120.949477,-120.948817,-120.945892,-120.944643,-120.943269,-120.941741,-120.940399,-120.939568,-120.937582,-120.934796,-120.933105,-120.932135,-120.930986,-120.929924,-120.928255,-120.925671,-120.92356,-120.919952,-120.918168,-120.921218,-120.920404,-120.915516,-120.913498,-120.91103,-120.907903,-120.906598,-120.903867,-120.900336,-120.896262,-120.89586,-120.893665,-120.891826,-120.890777,-120.889357,-120.885464,-120.883252,-120.880732,-120.874104,-120.869892,-120.866917,-120.862649,-120.858274,-120.857412,-120.855029,-120.852133,-120.850241,-120.848278,-120.846485,-120.841194,-120.838408,-120.837282,-120.83473,-120.8339,-120.830944,-120.828702,-120.826779,-120.824421,-120.82114,-120.818038,-120.816572,-120.814098,-120.810337,-120.810019,-120.807057,-120.804459,-120.802598,-120.801544,-120.799513,-120.797512,-120.79614,-120.793721,-120.791689,-120.790705,-120.789015,-120.785207,-120.781447,-120.779175,-120.776469,-120.771887,-120.770957,-120.769803,-120.767269,-120.767914,-120.769379,-120.76907,-120.765987,-120.764167,-120.76099,-120.761838,-120.761281,-120.757615,-120.75508,-120.753057,-120.75116,-120.74927,-120.747881,-120.74657,-120.745747,-120.744025,-120.742358,-120.739885,-120.737715,-120.734189,-120.733197,-120.731003,-120.727515,-120.726786,-120.723166,-120.724375,-120.72332,-120.72414,-120.722779,-120.722032,-120.718645,-120.718381,-120.719022,-120.718099,-120.720072,-120.721768,-120.722581,-120.725299,-120.726605,-120.727736,-120.728455,-120.727052,-120.727391,-120.726329,-120.728574,-120.729487,-120.729292,-120.730182,-120.729792,-120.688617,-120.626232,-120.504419,-120.503733,-120.494548,-120.495748,-120.49516,-120.495548,-120.494048,-120.490647,-120.489647,-120.489347,-120.488547,-120.483347,-120.482647,-120.483647,-120.484947,-120.489047,-120.489747,-120.488046,-120.481046,-120.481346,-120.483446,-120.485646,-120.488946,-120.488946,-120.480945,-120.479545,-120.479645,-120.481745,-120.480864,-120.482573,-120.486545,-120.487646,-120.487246,-120.483767,-120.482877,-120.481248,-120.480046,-120.478688,-120.479487,-120.477168,-120.47751,-120.480902,-120.483766,-120.48367,-120.47929,-120.477712,-120.476773,-120.476778,-120.477292,-120.479707,-120.482025,-120.485982,-120.485821,-120.484919,-120.485083,-120.486572,-120.487029,-120.489133,-120.488231,-120.482655,-120.479385,-120.481685,-120.480293,-120.478641,-120.476528,-120.472884,-120.474898,-120.47708,-120.476621,-120.472776,-120.470495,-120.470127,-120.471271,-120.471074,-120.468709,-120.468899,-120.474136,-120.473566,-120.469777,-120.467323,-120.462494,-120.460798,-120.458259,-120.455771,-120.454775,-120.453485,-120.450991,-120.444521,-120.43946,-120.436328,-120.436139,-120.438784,-120.440553,-120.446918,-120.451259,-120.455737,-120.458764,-120.460126,-120.460353,-120.459592,-120.456202,-120.454706,-120.454163,-120.455204,-120.452471,-120.445746,-120.443361,-120.439561,-120.43628,-120.435567,-120.433469,-120.427549,-120.424464,-120.41846,-120.413864,-120.41258,-120.411979,-120.410794,-120.410061,-120.40829,-120.405558,-120.405045,-120.405023,-120.401587,-120.400495,-120.397282,-120.394199,-120.390315,-120.387086,-120.380249,-120.378686,-120.376617,-120.372173,-120.371441,-120.68959,-120.923309,-120.989505,-121.08948,-121.090568,-121.091897,-121.210841,-121.351973,-121.725068,-121.725068,-121.752994,-121.750261,-121.746671,-121.745258,-121.742441,-121.741864,-121.742406,-121.748587,-121.751069,-121.753182,-121.750034,-121.747874,-121.747741,-121.746221,-121.739922,-121.736936,-121.733528,-121.734223,-121.735253,-121.734396,-121.730737,-121.728208,-121.726138,-121.724519,-121.723013,-121.71822,-121.715592,-121.714854,-121.71456,-121.723005,-121.728994,-121.732821,-121.735372,-121.738297,-121.742614,-121.747297,-121.747324,-121.744585,-121.744453,-121.745436,-121.748452,-121.752417,-121.754124,-121.760379,-121.76256,-121.764083,-121.766527,-121.772236,-121.773775,-121.777156,-121.77977,-121.78285,-121.787028,-121.789703,-121.79511,-121.796127,-121.790661,-121.786735,-121.785612,-121.785593,-121.786147,-121.787787,-121.791112,-121.792162,-121.792475,-121.794783,-121.79603,-121.798502,-121.798684,-121.800131,-121.803345,-121.802626,-121.801623,-121.802935,-121.803471,-121.802547,-121.803163,-121.804406,-121.805667,-121.805269],"lat":[45.011496,45.012877,45.015183,45.01615,45.017471,45.016028,45.015132,45.015214,45.016312,45.018144,45.021486,45.026237,45.030126,45.031646,45.033698,45.034399,45.035136,45.037277,45.039837,45.03958,45.037218,45.036162,45.034836,45.034098,45.03385,45.034428,45.033616,45.034668,45.036182,45.036784,45.036915,45.037566,45.038037,45.039285,45.042325,45.044095,45.045432,45.051756,45.053214,45.055912,45.057054,45.05852,45.059579,45.061626,45.062866,45.06365,45.065692,45.067109,45.068012,45.068111,45.067683,45.066362,45.066355,45.069473,45.073623,45.075258,45.079635,45.082515,45.084943,45.086706,45.088803,45.097111,45.098582,45.099886,45.101992,45.102852,45.103177,45.104415,45.105425,45.107592,45.11335,45.114456,45.115172,45.11972,45.120519,45.12236,45.123572,45.12369,45.122474,45.11806,45.116934,45.117392,45.118883,45.12179,45.123789,45.127066,45.129102,45.131594,45.134055,45.137271,45.14039,45.143283,45.148733,45.150597,45.152824,45.153424,45.154039,45.156838,45.158354,45.159339,45.161556,45.164721,45.168594,45.170314,45.170633,45.170913,45.174913,45.176313,45.180374,45.182227,45.183795,45.18635,45.188995,45.1918,45.197559,45.2051,45.205997,45.206788,45.206156,45.206919,45.208963,45.211543,45.212044,45.211691,45.210941,45.21133,45.212368,45.215347,45.21847,45.21998,45.221466,45.2233,45.224054,45.226448,45.227391,45.229558,45.22965,45.228409,45.228988,45.230368,45.233301,45.235873,45.240067,45.243495,45.247204,45.250581,45.251348,45.254141,45.255359,45.25792,45.258059,45.257377,45.258128,45.272711,45.286679,45.294275,45.315542,45.34583,45.403625,45.435496,45.482753,45.490679,45.505055,45.519604,45.519394,45.53276,45.6973034385521,45.69399,45.692887,45.6992977172998,45.703111,45.7034861389801,45.7042362225356,45.704949,45.699925,45.6907187476547,45.687019,45.67839,45.671238,45.6559982544447,45.649829,45.6350456589765,45.629513,45.6206319670926,45.616689,45.606441,45.6061542691238,45.606098,45.607886,45.6112362771232,45.611962,45.609762,45.6115234451054,45.6150366628937,45.6153949206591,45.616067,45.6169088233693,45.618117,45.623134,45.647893,45.6509451315419,45.652549,45.650998,45.653217,45.648344,45.649345,45.656745,45.656445,45.641345,45.641301218792,45.636345,45.634693,45.632496,45.627939,45.626731,45.621645,45.617145,45.615745,45.613245,45.608839,45.605245,45.602445,45.600345,45.598387,45.596399,45.592333,45.589342,45.586685,45.585914,45.579033,45.576068,45.571842,45.568928,45.565662,45.564497,45.561148,45.558241,45.553406,45.549261,45.543979,45.54268,45.541614,45.539326,45.538782,45.531695,45.529435,45.527564,45.526771,45.526944,45.528391,45.528848,45.528746,45.523446,45.521846,45.517546,45.515946,45.515968,45.515307,45.514077,45.511466,45.509945,45.507742,45.506742,45.504841,45.502441,45.501841,45.497345,45.494646,45.493046,45.485645,45.483245,45.479546,45.475646,45.474546,45.471246,45.469146,45.467346,45.462746,45.461946,45.461546,45.459946,45.456246,45.454546,45.450346,45.448446,45.446046,45.445046,45.440546,45.439046,45.435846,45.434645,45.433645,45.431445,45.428545,45.427145,45.426945,45.428645,45.428414,45.427346,45.425346,45.422746,45.412746,45.409346,45.401146,45.397879,45.393451,45.391231,45.389224,45.38852,45.388216,45.391687,45.392414,45.392552,45.390457,45.387278,45.383145,45.378322,45.374445,45.370245,45.364245,45.361596,45.360745,45.362145,45.362645,45.361345,45.359344,45.356144,45.351645,45.349245,45.348045,45.347345,45.347745,45.347745,45.346845,45.345588,45.342046,45.340244,45.337843,45.336443,45.332443,45.331343,45.330844,45.331345,45.332645,45.336745,45.337645,45.337245,45.335645,45.334445,45.333445,45.331345,45.327145,45.325045,45.323445,45.316745,45.313445,45.310345,45.307945,45.306845,45.30694,45.307437,45.308635,45.309899,45.312945,45.316643,45.319027,45.320315,45.322652,45.321963,45.320256,45.318543,45.312644,45.309344,45.307444,45.306544,45.307644,45.309698,45.31006,45.309269,45.307148,45.30514,45.301504,45.297022,45.294684,45.291386,45.289725,45.288917,45.285857,45.28481,45.284328,45.28618,45.284738,45.281969,45.278573,45.27644,45.275176,45.271766,45.270476,45.268668,45.266282,45.264793,45.264107,45.261002,45.251226,45.249845,45.246643,45.245501,45.241928,45.241133,45.239548,45.23835,45.237762,45.236331,45.235346,45.232197,45.23038,45.229872,45.227813,45.225219,45.22377,45.222909,45.22145,45.220811,45.219531,45.218455,45.217972,45.217611,45.216733,45.215473,45.212678,45.212389,45.213307,45.212996,45.21213,45.210143,45.208977,45.211051,45.211071,45.209422,45.20822,45.20892,45.208369,45.206422,45.204881,45.203313,45.204362,45.204264,45.200376,45.198917,45.197788,45.20007,45.200164,45.198832,45.19887,45.200423,45.199855,45.200064,45.198167,45.198343,45.197026,45.196232,45.196589,45.199129,45.200533,45.201454,45.201916,45.200435,45.200171,45.200797,45.200084,45.198131,45.198147,45.199612,45.2006,45.200106,45.201543,45.203315,45.203523,45.200555,45.199781,45.20033,45.201783,45.20288,45.201804,45.198744,45.197811,45.198189,45.199505,45.199614,45.200337,45.203096,45.202794,45.203406,45.203031,45.202121,45.200704,45.201016,45.202158,45.202305,45.199802,45.200624,45.199481,45.198138,45.198991,45.196764,45.19465,45.195112,45.193862,45.193073,45.189711,45.190206,45.189509,45.1877,45.185869,45.184218,45.181246,45.180176,45.179206,45.178981,45.176743,45.175965,45.17698,45.175916,45.172811,45.172219,45.172641,45.170973,45.170074,45.167194,45.168318,45.167929,45.166442,45.165421,45.165388,45.164483,45.165086,45.164828,45.163302,45.163077,45.164184,45.162708,45.163256,45.162405,45.162694,45.162337,45.160367,45.158737,45.157141,45.156511,45.155435,45.153147,45.150189,45.149272,45.145745,45.144461,45.143845,45.144321,45.144024,45.142428,45.142267,45.140314,45.139557,45.137567,45.136322,45.136159,45.134805,45.1344,45.134533,45.135077,45.133054,45.132358,45.131673,45.130522,45.129578,45.127872,45.126089,45.124848,45.121757,45.119629,45.117583,45.114616,45.111056,45.106596,45.106348,45.105245,45.103616,45.100225,45.099715,45.097334,45.095639,45.093143,45.091092,45.089885,45.088765,45.086873,45.085907,45.083731,45.083695,45.083589,45.083477,45.083477,45.07465,45.07005,45.068279,45.06355,45.06295,45.06315,45.06095,45.05855,45.05785,45.05695,45.05635,45.05345,45.05195,45.04855,45.04715,45.04315,45.03895,45.03705,45.03415,45.03255,45.02915,45.02705,45.02115,45.01895,45.01525,45.01105,45.009024,45.007686,45.00615,45.002949,45.00165,45.000113,44.998224,44.992758,44.989763,44.988537,44.984596,44.981876,44.980374,44.978676,44.975432,44.972849,44.972941,44.972278,44.970088,44.967456,44.966344,44.965188,44.965194,44.962749,44.960692,44.959686,44.956472,44.955769,44.954047,44.951299,44.950682,44.949244,44.947337,44.945507,44.943142,44.942458,44.940262,44.935458,44.933343,44.932197,44.929493,44.927367,44.924502,44.922126,44.919343,44.916909,44.913847,44.913388,44.909661,44.908162,44.907436,44.907439,44.905528,44.903973,44.903736,44.905132,44.907264,44.908317,44.908663,44.904258,44.899629,44.894791,44.894064,44.888013,44.886701,44.884591,44.884215,44.88281,44.881199,44.878216,44.876113,44.874285,44.873867,44.872612,44.869667,44.865607,44.8644,44.863058,44.863812,44.863607,44.862316,44.860148,44.85675,44.853686,44.853468,44.853762,44.852907,44.852174,44.848417,44.845693,44.840381,44.839552,44.839274,44.838678,44.833779,44.830843,44.830109,44.829377,44.829201,44.829733,44.829257,44.826872,44.826877,44.825007,44.822846,44.821769,44.822491,44.822996,44.823135,44.823272,44.824093,44.825098,44.825067,44.8247,44.825519,44.829919,44.829919,44.832677,44.837387,44.841401,44.845514,44.847398,44.853292,44.855163,44.856706,44.86124,44.864573,44.869565,44.872298,44.875394,44.876673,44.879812,44.882059,44.88572,44.888473,44.88931,44.890799,44.891348,44.893142,44.895375,44.896167,44.89745,44.900018,44.90277,44.90613,44.906315,44.904814,44.906819,44.907761,44.910179,44.912122,44.914636,44.917166,44.91983,44.920925,44.923042,44.927539,44.93057,44.932036,44.938447,44.941233,44.941952,44.941721,44.93984,44.938213,44.936857,44.935153,44.935654,44.935457,44.934682,44.935668,44.937426,44.941371,44.945223,44.947412,44.950377,44.952248,44.95477,44.956569,44.95786,44.959666,44.964926,44.970487,44.973167,44.974963,44.976452,44.977103,44.981021,44.982743,44.987321,44.992173,44.995386,44.999614,45.002217,45.006124,45.011496]}]],[[{"lng":[-122.001944,-122.001623,-122.000095,-121.997755,-121.995526,-121.99214,-121.98666,-121.981146,-121.977014,-121.968364,-121.964918,-121.9657,-121.967951,-121.969516,-121.972147,-121.973742,-121.974541,-121.978135,-121.980509,-121.980619,-121.982442,-121.985633,-121.98691,-121.985717,-121.986267,-121.985716,-121.984519,-121.98475,-121.983119,-121.981099,-121.980832,-121.979319,-121.979573,-121.978224,-121.976117,-121.973488,-121.972889,-121.973084,-121.972422,-121.967826,-121.966917,-121.967179,-121.971795,-121.973498,-121.974607,-121.975179,-121.974629,-121.973125,-121.973588,-121.975842,-121.977,-121.978262,-121.977949,-121.975456,-121.973689,-121.975571,-121.975173,-121.978289,-121.979648,-121.981007,-121.981248,-121.975677,-121.974351,-121.974141,-121.970437,-121.971991,-121.970119,-121.968164,-121.967095,-121.963562,-121.961437,-121.965522,-121.969048,-121.969609,-121.968894,-121.96538,-121.962544,-121.960507,-121.964026,-121.966186,-121.96739,-121.967844,-121.967157,-121.967348,-121.968382,-121.966654,-121.964404,-121.964924,-121.964537,-121.963754,-121.967767,-121.97073,-121.974371,-121.97546,-121.975565,-121.974278,-121.974756,-121.973495,-121.973657,-121.975264,-121.976611,-121.977799,-121.976763,-121.976052,-121.975226,-121.974803,-121.975192,-121.9744,-121.974401,-121.976081,-121.976173,-121.974896,-121.97542,-121.975358,-121.975113,-121.972875,-121.972931,-121.968548,-121.965431,-121.962046,-121.961483,-121.959462,-121.9575,-121.956466,-121.95296,-121.95134,-121.951391,-121.952638,-121.952256,-121.947402,-121.94521,-121.943782,-121.94233,-121.937524,-121.932415,-121.931269,-121.931479,-121.93656,-121.939333,-121.936964,-121.934322,-121.931438,-121.929404,-121.928213,-121.923578,-121.920359,-121.916801,-121.916265,-121.913613,-121.911588,-121.907868,-121.905856,-121.904318,-121.901482,-121.899743,-121.898393,-121.893921,-121.892574,-121.891442,-121.888545,-121.884325,-121.876903,-121.871602,-121.869385,-121.868029,-121.86838,-121.866636,-121.865553,-121.865855,-121.869966,-121.868366,-121.86649,-121.864863,-121.865338,-121.861553,-121.862399,-121.861353,-121.861569,-121.860927,-121.858364,-121.858102,-121.859205,-121.858174,-121.858124,-121.859497,-121.859435,-121.858022,-121.85998,-121.859711,-121.857063,-121.853218,-121.851462,-121.848898,-121.84539,-121.841387,-121.836722,-121.841469,-121.84356,-121.84511,-121.845087,-121.843135,-121.837282,-121.835963,-121.83679,-121.835458,-121.832449,-121.828402,-121.830273,-121.831355,-121.833384,-121.829239,-121.829103,-121.827099,-121.825663,-121.824533,-121.824299,-121.822384,-121.822016,-121.823599,-121.825381,-121.825042,-121.825487,-121.827324,-121.828042,-121.82955,-121.832623,-121.832785,-121.835193,-121.834472,-121.832225,-121.830059,-121.825726,-121.821394,-121.820056,-121.817468,-121.815895,-121.814176,-121.81219,-121.805421,-121.802225,-121.801513,-121.799227,-121.796501,-121.793616,-121.790365,-121.789458,-121.789211,-121.787098,-121.784547,-121.779748,-121.779395,-121.777087,-121.776779,-121.773384,-121.772481,-121.771755,-121.772156,-121.771349,-121.769259,-121.769874,-121.769311,-121.770003,-121.769573,-121.768446,-121.76807,-121.769381,-121.771345,-121.770604,-121.771649,-121.771473,-121.773003,-121.772532,-121.773339,-121.772735,-121.779553,-121.782676,-121.78402,-121.783142,-121.78342,-121.781069,-121.781132,-121.782017,-121.77888,-121.776708,-121.772426,-121.772913,-121.771647,-121.773196,-121.777229,-121.778813,-121.779738,-121.777556,-121.776464,-121.77429,-121.773407,-121.774429,-121.774047,-121.774525,-121.777485,-121.7791,-121.781511,-121.78121,-121.782174,-121.781334,-121.780652,-121.782576,-121.78161,-121.78366,-121.785631,-121.785536,-121.783458,-121.785251,-121.78406,-121.779552,-121.777905,-121.778226,-121.780239,-121.783459,-121.785753,-121.785421,-121.786562,-121.78766,-121.787806,-121.789792,-121.790457,-121.78928,-121.789648,-121.793299,-121.794053,-121.797461,-121.799426,-121.800871,-121.80525,-121.807791,-121.812668,-121.814002,-121.819172,-121.818602,-121.820058,-121.820794,-121.822017,-121.824508,-121.825031,-121.824493,-121.824693,-121.825631,-121.829123,-121.832349,-121.837029,-121.841346,-121.840588,-121.841105,-121.840178,-121.839829,-121.838676,-121.838296,-121.838672,-121.83719,-121.838501,-121.840437,-121.840333,-121.838745,-121.838989,-121.840443,-121.840783,-121.839298,-121.838263,-121.83956,-121.838718,-121.838718,-121.837607,-121.838253,-121.840536,-121.841828,-121.843443,-121.8439,-121.84041,-121.839415,-121.837076,-121.836875,-121.83738,-121.839822,-121.842406,-121.843458,-121.845989,-121.844914,-121.843679,-121.841952,-121.843342,-121.844616,-121.845412,-121.843678,-121.846471,-121.845488,-121.843159,-121.843906,-121.843138,-121.776324,-121.776324,-121.674928,-121.673699,-121.636001,-121.596883,-121.59326,-121.533117,-121.473293,-121.405495,-121.291112,-121.242113,-121.2293,-121.229289,-121.199971,-121.189792,-121.149644,-121.130934,-121.107534,-121.108065,-121.108335,-121.108537,-121.102938,-121.102883,-121.102791,-121.102781,-121.102773,-121.09243,-121.028358,-120.987271,-120.987084,-120.986955,-120.986587,-120.918109,-120.748249,-120.747848,-120.37874,-120.378107,-120.298364,-120.258386,-120.257777,-120.237934,-119.897434,-119.896581,-120.225273,-120.37771,-120.377752,-120.871802,-120.87349,-120.974959,-120.974975,-121.332969,-121.39767,-121.398498,-121.464437,-121.547864,-121.600018,-121.642987,-122.002362,-122.001944],"lat":[43.616414,43.622528,43.626357,43.62704,43.626937,43.625893,43.625632,43.625894,43.625796,43.626385,43.627045,43.62779,43.627549,43.629837,43.631689,43.633715,43.635627,43.637181,43.639685,43.64254,43.644379,43.652527,43.653858,43.656292,43.661708,43.66425,43.665708,43.667019,43.670143,43.673038,43.676079,43.680825,43.683766,43.688021,43.690301,43.691409,43.692868,43.695848,43.69714,43.701406,43.702821,43.704254,43.705008,43.706227,43.708584,43.710661,43.714027,43.715821,43.7176,43.721911,43.722386,43.724446,43.725444,43.729102,43.730635,43.733585,43.735841,43.737692,43.739082,43.741516,43.742964,43.746965,43.748549,43.750364,43.750748,43.752983,43.756832,43.757767,43.759699,43.762525,43.763745,43.765176,43.76734,43.769542,43.774753,43.777706,43.77872,43.78124,43.782628,43.784709,43.78699,43.791207,43.793313,43.795743,43.800984,43.801924,43.803954,43.805798,43.808235,43.809736,43.812761,43.813036,43.811555,43.811768,43.812541,43.817418,43.821219,43.827147,43.829345,43.827875,43.827615,43.828526,43.830226,43.834914,43.83585,43.838518,43.83999,43.84128,43.843043,43.846044,43.848478,43.851243,43.851773,43.855444,43.85757,43.859351,43.861156,43.864554,43.865763,43.865003,43.866226,43.868195,43.868549,43.870083,43.871681,43.873938,43.875554,43.876552,43.878063,43.881049,43.882058,43.884603,43.886262,43.890663,43.894213,43.897504,43.898992,43.900588,43.900866,43.903343,43.904908,43.905543,43.907347,43.909181,43.908566,43.911171,43.911488,43.912347,43.912917,43.912326,43.913876,43.913363,43.914863,43.9159,43.914537,43.912269,43.910784,43.9109,43.908658,43.90867,43.907985,43.907841,43.911681,43.911859,43.914504,43.915837,43.917106,43.919789,43.920959,43.923286,43.923898,43.925795,43.930281,43.932315,43.935837,43.937103,43.939036,43.941197,43.943048,43.944787,43.945593,43.947384,43.948783,43.951404,43.952781,43.953806,43.954542,43.958507,43.961526,43.965248,43.966596,43.966335,43.967269,43.967175,43.969574,43.971232,43.972587,43.973445,43.975021,43.976239,43.979073,43.982647,43.984745,43.985983,43.987284,43.987296,43.988727,43.989247,43.990573,43.991094,43.994496,43.995395,43.99759,44.002135,44.004224,44.008066,44.010777,44.012359,44.016406,44.019426,44.021567,44.023129,44.024752,44.029158,44.03106,44.033319,44.035576,44.037024,44.039744,44.041599,44.041365,44.044147,44.047911,44.050905,44.051832,44.051201,44.052956,44.053164,44.052251,44.052691,44.05684,44.060089,44.061662,44.067131,44.071873,44.072607,44.075019,44.076541,44.077214,44.080121,44.082353,44.085138,44.088537,44.089686,44.091034,44.094858,44.095897,44.099603,44.10134,44.10395,44.106409,44.108132,44.110428,44.11205,44.115245,44.118178,44.123916,44.125254,44.12676,44.131314,44.133307,44.134981,44.137039,44.139831,44.145276,44.14625,44.148462,44.151746,44.154322,44.155202,44.158315,44.159765,44.160744,44.159933,44.16353,44.164798,44.167583,44.169488,44.171595,44.173127,44.17565,44.178687,44.181082,44.183762,44.185623,44.187627,44.190156,44.190792,44.192042,44.194255,44.194809,44.196545,44.198499,44.199392,44.201958,44.203014,44.205326,44.20542,44.207811,44.208394,44.209599,44.212595,44.215751,44.216985,44.218877,44.221483,44.224606,44.225653,44.229239,44.230903,44.233215,44.234981,44.240762,44.243505,44.245463,44.247071,44.249326,44.25152,44.252707,44.254613,44.25828,44.25955,44.259495,44.260147,44.260656,44.260241,44.26195,44.263933,44.267804,44.26845,44.271389,44.273641,44.274814,44.280192,44.282624,44.283437,44.28498,44.285323,44.286844,44.285652,44.287955,44.289461,44.291095,44.293641,44.29663,44.299044,44.300168,44.303011,44.307229,44.308217,44.310141,44.312483,44.31418,44.318174,44.320984,44.322279,44.325139,44.327522,44.329789,44.331492,44.334022,44.336549,44.33971,44.340291,44.342144,44.346432,44.351721,44.35436,44.355981,44.357319,44.358276,44.359568,44.361769,44.365129,44.366867,44.370509,44.372037,44.372889,44.37563,44.376556,44.380153,44.383067,44.385609,44.387299,44.389094,44.390962,44.39263,44.392829,44.393402,44.393387,44.393383,44.392413,44.392578,44.392612,44.393184,44.393464,44.393153,44.392893,44.392954,44.393036,44.390646,44.390631,44.390621,44.390647,44.390635,44.3906,44.32718,44.26204,44.218519,44.218487,44.20241,44.17139,44.169238,44.138125,44.137751,44.135452,44.134026,44.076292,44.047637,43.960852,43.959365,43.95731,43.871331,43.872362,43.785429,43.785545,43.785297,43.698762,43.697376,43.6982,43.611164,43.611656,43.611489,43.615946,43.615538,43.615535,43.615384,43.617437,43.616645,43.616295,43.616218,43.616607,43.616497,43.616443,43.616648,43.615498,43.616414]}]],[[{"lng":[-123.485441,-123.463883,-123.461962,-123.461849,-123.461575,-123.461181,-123.441119,-123.440737,-123.442721,-123.421968,-123.421935,-123.402146,-123.40205,-123.361147,-123.361194,-123.361131,-123.319997,-123.320211,-123.299258,-123.299438,-123.340332,-123.340499,-123.360373,-123.376916,-123.380663,-123.380216,-123.400895,-123.423273,-123.423002,-123.443849,-123.443752,-123.464087,-123.464329,-123.464357,-123.485124,-123.484725,-123.484726,-123.361028,-123.36141,-123.361046,-123.361657,-123.361225,-123.361622,-123.34041,-123.215543,-123.195899,-123.122083,-123.115179,-123.051181,-123.050674,-123.030873,-123.0317,-123.031837,-123.011137,-122.990344,-122.990368,-122.928901,-122.929146,-122.929122,-122.929145,-122.928956,-122.929193,-122.929128,-122.918725,-122.909078,-122.908992,-122.887837,-122.887963,-122.868303,-122.867495,-122.867592,-122.866745,-122.846849,-122.846905,-122.846978,-122.826342,-122.826222,-122.826005,-122.805481,-122.805432,-122.804585,-122.803132,-122.796057,-122.795914,-122.792699,-122.795111,-122.784771,-122.78477,-122.784769,-122.784768,-122.784864,-122.784232,-122.783624,-122.78234,-122.779838,-122.774659,-122.77215,-122.76609,-122.765076,-122.764412,-122.764436,-122.764439,-122.764458,-122.764459,-122.764472,-122.764486,-122.764464,-122.743862,-122.743859,-122.743859,-122.743856,-122.743847,-122.743828,-122.743815,-122.743813,-122.743805,-122.743803,-122.743785,-122.743809,-122.743799,-122.743798,-122.743758,-122.743746,-122.743745,-122.743711,-122.743681,-122.743671,-122.743626,-122.743654,-122.743663,-122.743672,-122.743667,-122.743659,-122.743649,-122.743668,-122.743673,-122.743691,-122.743703,-122.743718,-122.743721,-122.743991,-122.744006,-122.74406,-122.744029,-122.743974,-122.743963,-122.743956,-122.743942,-122.743941,-122.743848,-122.743939,-122.743942,-122.743926,-122.743921,-122.743919,-122.743915,-122.743922,-122.743933,-122.743923,-122.743923,-122.743856,-122.743798,-122.743811,-122.743868,-122.743741,-122.746817,-122.75407,-122.764942,-122.769123,-122.784896,-122.786266,-122.787507,-122.80547,-122.805556,-122.807188,-122.82066,-122.825967,-122.842499,-122.843407,-122.846494,-122.846485,-122.846503,-122.851912,-122.857175,-122.867891,-122.904945,-122.908867,-122.908861,-122.908796,-122.92113,-122.928873,-122.939204,-122.962566,-122.970229,-122.97024,-122.970294,-122.970523,-122.970332,-122.9703,-122.976592,-122.979806,-122.991396,-122.99139,-122.991393,-122.991388,-123.011653,-123.011645,-123.01129,-123.014476,-123.027879,-123.032294,-123.032161,-123.05267,-123.062894,-123.063593,-123.072998,-123.083758,-123.103125,-123.112032,-123.114641,-123.114696,-123.134658,-123.135231,-123.135427,-123.137607,-123.138987,-123.142683,-123.151954,-123.156018,-123.176888,-123.180951,-123.196977,-123.209265,-123.46488,-123.48608,-123.485441],"lat":[45.447136,45.44726,45.462109,45.466555,45.47729,45.49156,45.491273,45.50533,45.521115,45.521408,45.535376,45.535646,45.550068,45.549902,45.558462,45.578779,45.578684,45.592984,45.593017,45.607247,45.607455,45.622201,45.622502,45.622077,45.621985,45.635752,45.636083,45.636176,45.65062,45.650678,45.665126,45.66514,45.669573,45.679274,45.67925,45.694472,45.708764,45.708696,45.737128,45.743418,45.757741,45.76493,45.779579,45.779849,45.77994,45.779909,45.780154,45.780131,45.779371,45.779362,45.779159,45.765779,45.75142,45.751458,45.750835,45.736459,45.735688,45.721482,45.698697,45.69381,45.67835,45.671015,45.635313,45.635399,45.635228,45.620763,45.620466,45.606352,45.606223,45.606226,45.591878,45.591881,45.591836,45.581018,45.577516,45.577521,45.568063,45.563041,45.562911,45.555687,45.556182,45.555689,45.555695,45.552082,45.54935,45.548433,45.5484,45.545158,45.543979,45.54232,45.533994,45.533982,45.533971,45.533946,45.533897,45.533809,45.533815,45.533852,45.533858,45.533822,45.531344,45.531184,45.529727,45.529634,45.528166,45.526737,45.519562,45.519509,45.516665,45.515754,45.5144,45.512509,45.509582,45.508181,45.507886,45.507374,45.506834,45.505017,45.497618,45.494665,45.494401,45.488258,45.48725,45.487084,45.484201,45.477961,45.476442,45.476439,45.469466,45.467532,45.465576,45.458486,45.456685,45.454892,45.447693,45.447284,45.444663,45.442944,45.435079,45.433294,45.426072,45.421046,45.418855,45.415311,45.407918,45.406149,45.404972,45.402702,45.402592,45.396544,45.393033,45.391704,45.387483,45.386845,45.386122,45.381513,45.377431,45.375538,45.372181,45.371751,45.359577,45.355871,45.353992,45.346587,45.332067,45.332045,45.331994,45.331928,45.331909,45.331825,45.33182,45.33182,45.331772,45.34566,45.346276,45.346233,45.346249,45.346133,45.346154,45.34595,45.328151,45.317192,45.317228,45.317273,45.317345,45.317457,45.317476,45.338071,45.346185,45.346241,45.34628,45.346332,45.346415,45.346454,45.346919,45.348862,45.353193,45.353774,45.36077,45.360932,45.361013,45.361096,45.364991,45.368009,45.375468,45.376348,45.382183,45.390905,45.390993,45.390902,45.390891,45.404962,45.404727,45.404898,45.404896,45.405082,45.404517,45.404421,45.404393,45.404383,45.418957,45.418937,45.424348,45.433459,45.433468,45.433473,45.433489,45.433528,45.433541,45.433584,45.433599,45.433667,45.433707,45.433332,45.433199,45.447136]}]],[[{"lng":[-123.785332,-123.784207,-123.784134,-123.784497,-123.78454,-123.761994,-123.741719,-123.65482,-123.644356,-123.613925,-123.606416,-123.507617,-123.483026,-123.463518,-123.463051,-123.463132,-123.463101,-123.462321,-123.463692,-123.464112,-123.465734,-123.46488,-123.209265,-123.196977,-123.180951,-123.176888,-123.156018,-123.151954,-123.142683,-123.138987,-123.137607,-123.135427,-123.135231,-123.134658,-123.114696,-123.114641,-123.112032,-123.103125,-123.083758,-123.072998,-123.063593,-123.062894,-123.05267,-123.032161,-123.032294,-123.027879,-123.014476,-123.01129,-123.011645,-123.011653,-122.991388,-122.991393,-122.99139,-122.991396,-122.979806,-122.976592,-122.9703,-122.970332,-122.970523,-122.970294,-122.97024,-122.970229,-122.962566,-122.939204,-122.928873,-122.92113,-122.908796,-122.908861,-122.908867,-122.904945,-122.867891,-122.868073,-122.849925,-122.854691,-122.858823,-122.86352,-122.867179,-122.872906,-122.879136,-122.881015,-122.882494,-122.886812,-122.889006,-122.893198,-122.898048,-122.899528,-122.904219,-122.908708,-122.912621,-122.916561,-122.919112,-122.922836,-122.92513,-122.928984,-122.932081,-122.943419,-122.947317,-122.949691,-122.952144,-122.954429,-122.957273,-122.958818,-122.959922,-122.961195,-122.9623,-122.964021,-122.967579,-122.971659,-122.974699,-122.974911,-122.974957,-122.974937,-122.975052,-122.977037,-122.981086,-122.98831,-122.99097,-122.996046,-122.999265,-122.999811,-123.000788,-123.001497,-123.001527,-122.998984,-122.998455,-122.997702,-122.996469,-122.996087,-122.995576,-122.995366,-122.996221,-122.997737,-122.999659,-123.003867,-123.007632,-123.02609,-123.035667,-123.038475,-123.04117,-123.044146,-123.046867,-123.049012,-123.051106,-123.050918,-123.049662,-123.047009,-123.045896,-123.043892,-123.041321,-123.036649,-123.028675,-123.024949,-123.022219,-123.020521,-123.018777,-123.019124,-123.018862,-123.01624,-123.015382,-123.014505,-123.011189,-123.007746,-123.001883,-123.000726,-123.003569,-123.007346,-123.011513,-123.01801,-123.023019,-123.02705,-123.028875,-123.031407,-123.033173,-123.033292,-123.032467,-123.032027,-123.031676,-123.031177,-123.028136,-123.025303,-123.022368,-123.020187,-123.015037,-123.012235,-123.009878,-123.007494,-123.001054,-122.998002,-122.996444,-122.999042,-123.002309,-123.005564,-123.008255,-123.009998,-123.014574,-123.018118,-123.027643,-123.033439,-123.036121,-123.041478,-123.044916,-123.046115,-123.051936,-123.059397,-123.062251,-123.067619,-123.068627,-123.068271,-123.068667,-123.092128,-123.186276,-123.209454,-123.249322,-123.321413,-123.339945,-123.396679,-123.412698,-123.448934,-123.468746,-123.477905,-123.478264,-123.49442,-123.495414,-123.50222,-123.550602,-123.551215,-123.561352,-123.568496,-123.57142,-123.576563,-123.599208,-123.601657,-123.622159,-123.627081,-123.657202,-123.724368,-123.724362,-123.784016,-123.784135,-123.784487,-123.784259,-123.784192,-123.784157,-123.785567,-123.785332],"lat":[45.166922,45.173379,45.202101,45.202095,45.216294,45.216283,45.216266,45.216607,45.2171,45.217103,45.216555,45.216264,45.216134,45.216312,45.259918,45.274549,45.280192,45.338244,45.367548,45.374535,45.417388,45.433332,45.433707,45.433667,45.433599,45.433584,45.433541,45.433528,45.433489,45.433473,45.433468,45.433459,45.424348,45.418937,45.418957,45.404383,45.404393,45.404421,45.404517,45.405082,45.404896,45.404898,45.404727,45.404962,45.390891,45.390902,45.390993,45.390905,45.382183,45.376348,45.375468,45.368009,45.364991,45.361096,45.361013,45.360932,45.36077,45.353774,45.353193,45.348862,45.346919,45.346454,45.346415,45.346332,45.34628,45.346241,45.346185,45.338071,45.317476,45.317457,45.317345,45.259695,45.259697,45.257252,45.254719,45.253084,45.252972,45.253827,45.254425,45.254827,45.255211,45.256531,45.257491,45.257798,45.256622,45.256719,45.259435,45.262835,45.266203,45.267445,45.268065,45.268509,45.268635,45.268621,45.268499,45.267586,45.267485,45.26826,45.270488,45.273639,45.278695,45.280509,45.281837,45.282982,45.28388,45.284894,45.285083,45.283041,45.279979,45.279143,45.278081,45.276928,45.276226,45.273321,45.271011,45.268761,45.267714,45.264811,45.261554,45.26085,45.259347,45.257284,45.254877,45.242731,45.241311,45.239953,45.238752,45.238305,45.237426,45.233981,45.230698,45.226947,45.223696,45.22217,45.222137,45.223224,45.222789,45.222272,45.220788,45.21828,45.216583,45.214705,45.211305,45.209391,45.207266,45.204744,45.201105,45.199481,45.198918,45.199434,45.201943,45.202051,45.201121,45.199841,45.19584,45.191003,45.189247,45.181566,45.177017,45.175796,45.173053,45.170955,45.167365,45.16452,45.161321,45.159498,45.160252,45.162765,45.162905,45.161894,45.160852,45.15794,45.153831,45.150825,45.146614,45.145564,45.144999,45.144303,45.141313,45.140185,45.139431,45.138747,45.136757,45.133769,45.129273,45.127319,45.123249,45.120604,45.117631,45.114694,45.11311,45.111091,45.107235,45.105444,45.101967,45.100961,45.100555,45.098953,45.097729,45.094073,45.090273,45.089197,45.086332,45.083942,45.082673,45.078925,45.076586,45.074864,45.07486,45.074932,45.075013,45.074982,45.075073,45.075527,45.075495,45.075389,45.075365,45.075293,45.0752,45.075176,45.075175,45.075138,45.07513,45.075115,45.075553,45.075568,45.075733,45.075848,45.075899,45.075976,45.076016,45.07602,45.076056,45.076067,45.076118,45.076226,45.076777,45.076657,45.087581,45.08866,45.104049,45.130885,45.144694,45.159712,45.166922]}]],[[{"lng":[-117.977663335055,-117.717852,-117.62359560026,-117.60342451872,-117.603163,-117.504833,-117.480103,-117.479935132756,-117.47536,-117.475148,-117.439943,-117.390738,-117.382131203034,-117.353928,-117.337668,-117.280513327856,-117.216731,-117.214534,-117.212616,-117.090186778506,-117.070047,-117.051304,-116.985882,-116.940681,-116.915989,-116.911409,-116.900497,-116.892861,-116.894652,-116.89091,-116.886843,-116.880506,-116.87598,-116.874869,-116.875706,-116.873933,-116.870484,-116.869655,-116.866544,-116.859795,-116.857254,-116.84355,-116.830003,-116.819182,-116.814142,-116.796555004061,-116.796051,-116.794454975327,-116.790151,-116.787792,-116.78752,-116.788923,-116.789066,-116.788329,-116.782676,-116.7634,-116.759787,-116.755288,-116.750978,-116.745219,-116.740486,-116.736268,-116.715527,-116.711822,-116.70845,-116.698079,-116.697192,-116.687007,-116.680139,-116.665344,-116.659629,-116.646342,-116.639641,-116.635814,-116.632032,-116.60504,-116.593004,-116.577422,-116.559444,-116.553548,-116.549085,-116.546643,-116.543862684798,-116.537173,-116.535698,-116.538014,-116.536395,-116.535396,-116.528272,-116.523961,-116.512326,-116.49451,-116.487894,-116.487274,-116.487835,-116.487447,-116.484219,-116.483286,-116.482495,-116.48282653917,-116.482899,-116.482806,-116.481018,-116.475803,-116.472346,-116.471241,-116.472882,-116.469813,-116.46517,-116.463504,-116.463635,-116.471646,-116.474702,-116.476521,-116.480788,-116.483105,-116.483412,-116.481208,-116.481943,-116.48297,-116.490279,-116.502756,-116.503728,-116.503156,-116.503957,-116.506967,-116.510342,-116.513931,-116.517468,-116.522233,-116.525888,-116.527723,-116.528558,-116.52828,-116.526201,-116.523947,-116.523638,-116.527492979455,-116.535482,-116.543837,-116.548676,-116.5525,-116.554634,-116.556587,-116.557587,-116.556575,-116.554549,-116.553473,-116.553171,-116.558804,-116.558803,-116.55498,-116.554829,-116.561744,-116.563985,-116.575949,-116.581382,-116.588195,-116.592416,-116.597447,-116.619057,-116.626633,-116.653252,-116.673793,-116.674648,-116.672594,-116.672163,-116.672733,-116.674493,-116.675587,-116.681013,-116.687027,-116.687174152113,-116.695619,-116.698661,-116.703181,-116.704217,-116.708003,-116.70975,-116.708546,-116.709536,-116.724205,-116.724192007616,-116.724188,-116.725137,-116.727452,-116.728757,-116.729607,-116.731216,-116.734021,-116.742962,-116.745535,-116.746607,-116.748564,-116.752839,-116.754643,-116.774847,-116.782492,-116.783537,-116.784244,-116.783771926572,-117.022673,-117.022673,-117.091719,-117.266005,-117.266006,-117.266006,-117.320193,-117.373361,-117.476684,-117.476762,-117.496311,-117.501432,-117.520941,-117.520674,-117.522313,-117.522249,-117.542216,-117.542058,-117.561969,-117.562208,-117.582166,-117.582674,-117.582344,-117.622801,-117.622777,-117.643494,-117.643485,-117.663391,-117.664146,-117.68379,-117.683951,-117.683794,-117.683986,-117.727235,-117.727225,-117.730633,-117.745959,-117.746137,-117.767063,-117.766865,-117.787623,-117.788395,-117.74765,-117.747464,-117.747405,-117.747327,-117.97298,-117.977639,-117.977663335055],"lat":[46.0007234754428,45.999866,45.999061415294,45.9988892323573,45.998887,45.998317,45.99787,45.9978694691105,45.997855,45.997893,45.998633,45.998598,45.9980721459827,45.996349,45.998662,45.9985173847898,45.998356,45.99832,45.998321,45.9976245645994,45.99751,45.996849,45.996974,45.996274,45.995413,45.988912,45.982801,45.976373,45.969686,45.96001,45.958617,45.958508,45.95441,45.950253,45.945008,45.939894,45.932408,45.923799,45.916958,45.907264,45.904159,45.892273,45.886405,45.880938,45.877551,45.8590045012698,45.858473,45.8561406398762,45.849851,45.844267,45.840204,45.836741,45.833471,45.831928,45.825376,45.81658,45.816167,45.817061,45.818537,45.821394,45.82446,45.826179,45.826773,45.826267,45.825117,45.820852,45.820135,45.806319,45.79359,45.781998,45.780016,45.779815,45.781274,45.783642,45.784979,45.781018,45.778541,45.76753,45.755189,45.753388,45.752735,45.750972,45.7469544885719,45.737288,45.734231,45.714929,45.69665,45.691734,45.681473,45.677639,45.670224,45.655679,45.649769,45.647675,45.644302,45.643682,45.642322,45.641529,45.639916,45.6367721223766,45.636085,45.633595,45.632152,45.6317,45.629409,45.627669,45.624884,45.620604,45.617986,45.615785,45.602785,45.593647,45.59179,45.589673,45.587942,45.58516,45.582615,45.580597,45.577898,45.577008,45.574499,45.566608,45.565102,45.562754,45.560953,45.558427,45.556809,45.556281,45.55679,45.555626,45.553734,45.551818,45.551078,45.54989,45.549482,45.548234,45.54661,45.539602100419,45.525079,45.514193,45.510385,45.508311,45.507856,45.506232,45.503217,45.501388,45.500154,45.499107,45.495932,45.481188,45.480076,45.472801,45.46293,45.461213,45.460169,45.452522,45.448984,45.44292,45.427356,45.41277,45.39821,45.388037,45.351084,45.321511,45.314342,45.298023,45.288938,45.283183,45.276349,45.274867,45.27072,45.267857,45.2676428484611,45.255353,45.245552,45.2408,45.227972,45.222317,45.217243,45.207356,45.203015,45.171501,45.164945960344,45.162924,45.159072,45.156023,45.144381,45.142091,45.139934,45.138289,45.134898,45.133038,45.124878,45.122945,45.121768,45.113972,45.105536,45.09579,45.093605,45.088128,45.078265731912,45.079167,45.079734,45.080158,45.08057,45.152442,45.166539,45.166537,45.16654,45.166539,45.209973,45.209977,45.210148,45.209768,45.223598,45.253458,45.267731,45.267424,45.295956,45.295879,45.310219,45.310184,45.324359,45.338096,45.338171,45.336789,45.33687,45.365322,45.365749,45.428344,45.428365,45.441917,45.506771,45.51523,45.51478,45.61699,45.61692,45.616635,45.660736,45.660227,45.689605,45.689567,45.773515,45.773625,45.833238,45.850523,45.861072,45.860595,45.860602,46.0007234754428]}]],[[{"lng":[-120.005565,-120.005124,-120.004752,-120.004859,-120.004783,-119.999242,-119.998172,-119.998161,-119.999501176112,-119.965744,-119.908917240841,-119.907461,-119.876144,-119.868272037091,-119.868135,-119.802655,-119.772927,-119.729909361077,-119.672199870904,-119.669877,-119.623393,-119.600549,-119.571584,-119.536946521092,-119.524632,-119.487829,-119.456238441501,-119.450256,-119.432149953782,-119.432128,-119.432181,-119.432054,-119.434665,-119.434772,-119.435024,-119.434695,-119.434788,-119.434603,-119.434622,-119.43455,-119.434644,-119.434606,-119.43464,-119.248547,-119.248444,-119.248214,-119.145144,-119.14561,-119.148243,-119.147264,-119.146789,-119.146424,-119.163037,-119.162966,-119.306043,-119.306611,-119.544565,-119.552894,-119.593374,-119.603647,-119.667065,-119.672228,-119.770244,-119.781719,-119.791162,-119.790961,-119.790699,-119.790831,-119.760731,-119.759759,-119.883914,-119.882356,-119.882346,-119.897751,-120.006555,-120.005565],"lat":[45.350553,45.385771,45.501959,45.502468,45.517157,45.517539,45.68439,45.687968,45.8124817188485,45.824365,45.8280408039571,45.828135,45.834718,45.8359407146783,45.835962,45.84753,45.845578,45.8502905291199,45.8566125323665,45.856867,45.905639,45.919581,45.925456,45.913024662526,45.908605,45.906307,45.9155950765374,45.917354,45.918250445405,45.90729,45.879312,45.865421,45.864893,45.828536,45.826207,45.805961,45.802167,45.756429,45.746143,45.704977,45.704411,45.621409,45.602985,45.601935,45.573187,45.516076,45.515909,45.428579,45.255939,45.255936,45.171034,45.08294,45.082943,44.996241,44.995696,44.995993,44.995689,44.995311,44.99531,44.994539,44.994664,44.995117,44.995193,44.994816,44.994755,45.023517,45.067823,45.081253,45.081278,45.169211,45.169152,45.25596,45.256916,45.257017,45.257706,45.350553]}]],[[{"lng":[-121.3513,-121.349315,-121.349247,-121.348471,-121.332413,-121.332609,-121.332969,-120.974975,-120.974959,-120.87349,-120.871802,-120.377752,-120.37771,-120.225273,-119.896581,-119.895163,-119.895056,-119.896465,-119.896969,-119.932611,-119.931944,-119.931595,-119.943504,-119.943441,-119.943779,-119.706005,-119.705858,-119.365337,-119.365156,-119.363896,-119.363648,-119.363579,-119.359446,-119.360121480893,-119.360177,-119.444598,-119.72573,-119.790087,-119.848907,-119.872929,-119.876054,-119.986801,-119.999234,-120.046745935305,-120.088176,-120.159409852771,-120.160711,-120.188026,-120.272095999129,-120.276920753459,-120.284045,-120.325751,-120.326387,-120.328538964699,-120.328540043301,-120.413985011427,-120.489013,-120.508434445763,-120.564863,-120.61589,-120.680984,-120.786166,-120.819216277206,-120.878231,-120.879925977229,-120.879805,-120.880501,-120.880436,-120.882106,-120.882106,-120.883327,-120.899236,-120.996696,-120.996685,-121.131887,-121.349679,-121.350007,-121.35053,-121.35055,-121.3513],"lat":[42.919989,43.089928,43.111683,43.356753,43.356663,43.473058,43.616645,43.617437,43.615384,43.615535,43.615538,43.615946,43.611489,43.611656,43.611164,43.592745,43.568127,43.353816,43.179017,43.178963,42.976439,42.917005,42.917079,42.753671,42.746371,42.746605,42.748791,42.748958,42.661822,42.487079,42.220094,42.137231,42.13723,41.9943837248054,41.994384,41.995478,41.996296,41.997544,41.997281,41.997641,41.997199,41.995709,41.994944,41.9948937861312,41.99485,41.994566063361,41.9945608770155,41.994452,41.9929801905817,41.9928957238404,41.992771,41.993143,41.992586,41.9925995898795,41.992599596691,41.9931391904968,41.993613,41.9935136523275,41.993225,41.993029,41.99357,41.993809,41.9937957174251,41.993772,41.9937643415584,41.996882,42.428587,42.483263,42.483262,42.486559,42.744214,42.743806,42.743688,42.746349,42.746775,42.746644,42.833905,42.91669,42.919989,42.919989]}]],[[{"lng":[-124.015851,-124.012163,-124.006057,-124.004863,-123.996836,-123.989529,-123.987671142877,-123.97734943563,-123.976188590439,-123.975425,-123.972855462376,-123.970461,-123.968660474861,-123.968232789041,-123.968187,-123.968560618402,-123.972529,-123.976507,-123.971328,-123.970173135164,-123.964276,-123.958061,-123.962607,-123.963217724763,-123.964127353106,-123.964169,-123.964380552095,-123.968982320543,-123.972899,-123.978671,-124.007756,-124.007494,-123.979715,-123.978955013993,-123.973398,-123.965728,-123.960557,-123.961131916315,-123.962035,-123.962528536153,-123.964074,-123.974665,-123.974302867085,-123.971997014932,-123.971892,-123.970804752809,-123.970154,-123.970139671867,-123.970121,-123.973381,-123.97409492245,-123.976647761464,-123.97865,-123.978534795427,-123.976544,-123.970794,-123.96634,-123.962095,-123.957568,-123.94944,-123.949468,-123.951155,-123.951567332492,-123.95319628028,-123.956711,-123.952264,-123.949998649289,-123.949787395219,-123.947632127365,-123.944234559771,-123.942805782962,-123.941981614177,-123.941433103909,-123.939964,-123.937358469373,-123.937272,-123.940394,-123.939653,-123.940874071402,-123.941568,-123.942219645651,-123.942937192789,-123.943121,-123.943567208808,-123.946027,-123.952045022158,-123.954899774688,-123.957689,-123.962908,-123.967425,-123.967841,-123.964335,-123.965567651763,-123.970272,-123.978679,-123.981732,-123.983029,-123.979597,-123.978804,-123.974456,-123.973555,-123.969302,-123.969078621366,-123.957356,-123.86475,-123.84338,-123.71984,-123.720001,-123.703567,-123.682896,-123.662297,-123.653642,-123.644355,-123.56717,-123.54582,-123.485086,-123.48513,-123.361622,-123.361225,-123.361657,-123.361046,-123.36141,-123.361028,-123.484726,-123.484725,-123.485124,-123.464357,-123.464329,-123.464087,-123.443752,-123.443849,-123.423002,-123.423273,-123.400895,-123.380216,-123.380663,-123.376916,-123.360373,-123.340499,-123.340332,-123.299438,-123.299258,-123.320211,-123.319997,-123.361131,-123.361194,-123.361147,-123.40205,-123.402146,-123.421935,-123.421968,-123.442721,-123.440737,-123.441119,-123.461181,-123.461575,-123.461849,-123.461962,-123.463883,-123.485441,-123.48608,-123.46488,-123.465734,-123.464112,-123.463692,-123.462321,-123.463101,-123.463132,-123.463051,-123.463518,-123.483026,-123.507617,-123.606416,-123.613925,-123.644356,-123.65482,-123.741719,-123.761994,-123.78454,-123.784497,-123.784134,-123.784207,-123.785332,-123.785567,-123.784157,-123.784192,-123.784259,-123.784487,-123.784135,-123.784016,-123.724362,-123.724368,-123.724663,-123.784759,-123.801472,-123.895988,-123.911026,-123.955007,-123.967184,-123.967191,-123.986688,-124.008880714497,-124.009069,-124.00977,-124.015011,-124.017991,-124.015851],"lat":[45.064759,45.076921,45.084736,45.084232,45.090167,45.094045,45.1008197766356,45.1384584412288,45.1426915261005,45.145476,45.159582575209,45.172728,45.1952852386477,45.2006433482882,45.201217,45.2025015176212,45.216145,45.21933,45.226849,45.2341520625869,45.271444,45.278013,45.281073,45.2951302262423,45.3160674015395,45.317026,45.3175073597732,45.3279780961366,45.33689,45.338854,45.336813,45.33974,45.347724,45.3485742170505,45.354791,45.386242,45.430778,45.4356126650042,45.443207,45.4446362942545,45.449112,45.467333,45.4678668620106,45.4712661853439,45.471421,45.4724857265356,45.473123,45.476818355795,45.481634,45.482538,45.4831227958426,45.4852139048169,45.486854,45.4870114900121,45.489733,45.493507,45.493417,45.497175,45.510399,45.545389,45.564829,45.565544,45.5659713979159,45.5676598626949,45.571303,45.586296,45.5986233755376,45.5997729583602,45.6115012952122,45.6299898636449,45.6377648488614,45.6422497341726,45.6452345665112,45.653229,45.6562826586659,45.656384,45.662926,45.688975,45.7035959750661,45.711905,45.7182519363268,45.7252407438024,45.727031,45.7279857578689,45.733249,45.737627056936,45.7397038636989,45.741733,45.74362,45.751041,45.755753,45.758296,45.7595095505395,45.764141,45.762156,45.76251,45.768044,45.768968,45.772913,45.774836,45.777508,45.779837,45.7830789476988,45.783121,45.782754,45.783518,45.783218,45.77308,45.773735,45.77367,45.774656,45.77503,45.774548,45.775411,45.775055,45.775657,45.780021,45.779579,45.76493,45.757741,45.743418,45.737128,45.708696,45.708764,45.694472,45.67925,45.679274,45.669573,45.66514,45.665126,45.650678,45.65062,45.636176,45.636083,45.635752,45.621985,45.622077,45.622502,45.622201,45.607455,45.607247,45.593017,45.592984,45.578684,45.578779,45.558462,45.549902,45.550068,45.535646,45.535376,45.521408,45.521115,45.50533,45.491273,45.49156,45.47729,45.466555,45.462109,45.44726,45.447136,45.433199,45.433332,45.417388,45.374535,45.367548,45.338244,45.280192,45.274549,45.259918,45.216312,45.216134,45.216264,45.216555,45.217103,45.2171,45.216607,45.216266,45.216283,45.216294,45.202095,45.202101,45.173379,45.166922,45.159712,45.144694,45.130885,45.104049,45.08866,45.087581,45.076657,45.076777,45.076226,45.044432,45.04473,45.044913,45.045552,45.045679,45.04572,45.045727,45.044843,45.044634,45.0449987048377,45.045114,45.047266,45.047969,45.049808,45.064759]}]],[[{"lng":[-121.919685,-121.911695,-121.908793,-121.901879,-121.902678,-121.903291,-121.902915,-121.906325,-121.907176,-121.908329,-121.907326,-121.910309,-121.912619,-121.913911,-121.913019,-121.911443,-121.910516,-121.910547,-121.91549,-121.918386,-121.918095,-121.915803,-121.915913,-121.914551,-121.915527,-121.915184,-121.913115,-121.915478,-121.916509,-121.918698,-121.922051,-121.922028852172,-121.908267,-121.904448014441,-121.900858,-121.900897392331,-121.901855,-121.877908566384,-121.875695401271,-121.867167,-121.858205244407,-121.838112759325,-121.811304,-121.735104,-121.711711588727,-121.707358,-121.675958711965,-121.668362,-121.638119011462,-121.631167,-121.609320387848,-121.562727136099,-121.534252432855,-121.533106,-121.531983021128,-121.523685853632,-121.522392,-121.511087960406,-121.499153,-121.494687797672,-121.494686798243,-121.483672986716,-121.481489451388,-121.467065281238,-121.462849,-121.441224595532,-121.440551,-121.440646,-121.482168,-121.481753,-121.481813,-121.482056,-121.481719,-121.481798,-121.481441,-121.480159,-121.480879,-121.480361,-121.480617,-121.481888,-121.614577,-121.635917,-121.696479,-121.695032,-121.692134,-121.690732,-121.690481,-121.689008,-121.687532,-121.685033,-121.68505,-121.684562,-121.681973,-121.68,-121.679888,-121.680813,-121.679232,-121.679081,-121.68159,-121.683547,-121.685262,-121.687945,-121.687276,-121.688772,-121.689975,-121.691752,-121.693809,-121.697615,-121.698691,-121.700932,-121.702476,-121.70326,-121.702846,-121.703592,-121.704567,-121.704223,-121.70326,-121.703546,-121.701957,-121.70123,-121.702141,-121.700918,-121.700709,-121.699231,-121.700209,-121.69756,-121.696925,-121.698113,-121.699988,-121.700473,-121.704123,-121.705532,-121.708575,-121.714579,-121.716979,-121.720904,-121.723201,-121.72419,-121.726508,-121.730946,-121.732298,-121.735074,-121.738405,-121.744622,-121.756938,-121.762165,-121.766144,-121.773181,-121.776204,-121.780122,-121.783928,-121.785633,-121.790802,-121.792696,-121.793651,-121.794539,-121.796434,-121.799679,-121.802589,-121.80456,-121.806916,-121.806939,-121.807908,-121.805791,-121.80559,-121.807583,-121.807559,-121.805977,-121.806845,-121.810726,-121.814319,-121.815501,-121.819587,-121.821485,-121.824922,-121.828898,-121.831765,-121.83527,-121.836809,-121.842521,-121.844301,-121.846764,-121.846821,-121.847872,-121.850403,-121.854653,-121.85882,-121.860323,-121.86337,-121.861111,-121.860137,-121.859828,-121.860873,-121.864656,-121.866919,-121.868187,-121.869342,-121.870166,-121.874665,-121.878538,-121.881862,-121.885605,-121.888674,-121.891749,-121.89392,-121.895902,-121.902817,-121.906688,-121.906924,-121.909746,-121.911443,-121.911614,-121.913087,-121.913761,-121.913216,-121.91644,-121.922136,-121.919685],"lat":[45.547614,45.548941,45.549992,45.55619,45.55686,45.559517,45.561121,45.561935,45.56255,45.564983,45.566723,45.566826,45.568211,45.571163,45.575168,45.576484,45.579733,45.581241,45.582447,45.585484,45.587287,45.589685,45.591609,45.593684,45.597109,45.598698,45.601297,45.605163,45.607635,45.608288,45.610761,45.6491618990508,45.654399,45.6583215914573,45.662009,45.662353021086,45.670716,45.6862907085108,45.6877301463022,45.693277,45.6954401547252,45.7002900029046,45.706761,45.694039,45.6946881803028,45.694809,45.7030807428963,45.705082,45.7047364355389,45.704657,45.7095324475309,45.7199305336331,45.7262851537756,45.726541,45.7263456264124,45.7249021020319,45.724677,45.7228135043382,45.720846,45.7184501847691,45.718449648523,45.7125401610082,45.7113685797871,45.7036292560113,45.701367,45.6973034385521,45.53276,45.519394,45.519604,45.505055,45.490679,45.482753,45.435496,45.403625,45.34583,45.315542,45.294275,45.286679,45.272711,45.258128,45.257377,45.258059,45.25792,45.263859,45.268412,45.271641,45.275625,45.276153,45.279234,45.281798,45.283681,45.286259,45.287942,45.290025,45.292672,45.294816,45.295895,45.297177,45.299775,45.300714,45.30306,45.30503,45.306251,45.309477,45.316379,45.319453,45.321348,45.322947,45.323929,45.327889,45.329188,45.331267,45.334258,45.338957,45.339223,45.344448,45.346629,45.349016,45.35187,45.356172,45.363389,45.364545,45.366277,45.368338,45.369899,45.371963,45.373564,45.373838,45.376309,45.378531,45.381733,45.383545,45.383619,45.386754,45.387131,45.3894,45.39177,45.393648,45.393784,45.394798,45.395593,45.395664,45.397131,45.397261,45.401105,45.402844,45.403433,45.402457,45.402672,45.407275,45.4101,45.412164,45.415202,45.415174,45.418572,45.424228,45.427171,45.427854,45.431927,45.432929,45.435494,45.440485,45.442561,45.443096,45.444307,45.448983,45.450143,45.451832,45.454649,45.455518,45.457968,45.459678,45.461675,45.46333,45.465469,45.467466,45.470184,45.472492,45.474619,45.476109,45.476188,45.47907,45.481329,45.483377,45.486502,45.486638,45.489006,45.489377,45.492844,45.495096,45.496923,45.499168,45.501814,45.504495,45.506786,45.508715,45.514103,45.514598,45.515751,45.514295,45.513125,45.512408,45.512252,45.512631,45.513388,45.514896,45.51853,45.520828,45.524655,45.526749,45.529082,45.530303,45.532567,45.535329,45.537275,45.543205,45.546673,45.547614]}]],[[{"lng":[-119.434772,-119.434665,-119.432054,-119.432181,-119.432128,-119.432149953782,-119.364396,-119.356927874882,-119.322509,-119.312779611952,-119.265781460289,-119.25715,-119.225745,-119.204349373269,-119.19553,-119.169496,-119.141390171444,-119.12612,-119.093221,-119.061462,-119.027056,-119.008558,-118.987196090377,-118.987129,-118.977787096598,-118.941242,-118.86812798659,-118.788694725992,-118.785765634062,-118.725242193351,-118.67787,-118.658717,-118.639332,-118.637725,-118.606789334728,-118.590497392025,-118.579906,-118.57571,-118.569392,-118.554902302619,-118.537119,-118.497027,-118.470756,-118.424027212824,-118.415326658626,-118.403817114887,-118.387301768013,-118.387293095034,-118.37836,-118.36779,-118.36716827519,-118.340494051998,-118.314982,-118.283526,-118.256368,-118.25253,-118.23666752911,-118.236584,-118.228941,-118.146028,-118.131019,-118.126197,-117.99694971271,-117.996911,-117.977663335055,-117.977639,-117.97298,-117.972948,-118.045003,-118.045102,-118.054666,-118.066506,-118.066465,-118.066513,-118.066383,-118.117194,-118.117121,-118.116844,-118.11836,-118.116309,-118.116355,-118.116362,-118.116461,-118.117464,-118.197955,-118.197876,-118.241668,-118.241665,-118.267614,-118.366326,-118.366522,-118.384117,-118.38422,-118.392817,-118.404849,-118.404806,-118.428539,-118.428539,-118.428329,-118.469471,-118.506172,-118.506296,-118.536194,-118.572271,-118.577354,-118.613107,-118.613254,-118.613243,-118.633925,-118.656266,-118.656251,-118.697766,-118.697013,-118.696986,-118.656102,-118.655992,-118.546632,-118.547652,-118.518687,-118.519022,-118.518689,-118.675353,-118.946612,-119.002263,-119.162966,-119.163037,-119.146424,-119.146789,-119.147264,-119.148243,-119.14561,-119.145144,-119.248214,-119.248444,-119.248547,-119.43464,-119.434606,-119.434644,-119.43455,-119.434622,-119.434603,-119.434788,-119.434695,-119.435024,-119.434772],"lat":[45.828536,45.864893,45.865421,45.879312,45.90729,45.918250445405,45.921605,45.9236692670188,45.933183,45.9341867678607,45.9390355038675,45.939926,45.932725,45.9292871126004,45.92787,45.927603,45.9310086675325,45.932859,45.942745,45.958527,45.969134,45.97927,45.9997905520367,45.999855,46.0000013775916,46.000574,46.0006742162676,46.0007830942314,46.0007871090932,46.0008700676541,46.000935,46.000955,46.000994,46.00097,46.0008886734271,46.0008458436429,46.000818,46.000718,46.000773,46.0008030811739,46.00084,46.00062,46.000632,46.0006026668075,46.0005972051842,46.0005899802661,46.0005796130411,46.0005796075968,46.000574,46.000622,46.0006200103111,46.0005346455232,46.000453,46.000787,46.000439,46.000459,46.0004182147682,46.000418,46.000421,46.000701,46.00028,46.000282,46.0007868487855,46.000787,46.0007234754428,45.860602,45.860595,45.816896,45.817073,45.773538,45.773563,45.77346,45.769522,45.737574,45.688395,45.688607,45.673797,45.600729,45.514664,45.514652,45.498842,45.49282,45.470732,45.470702,45.4704,45.427204,45.427391,45.428841,45.429103,45.428951,45.43531,45.435246,45.44258,45.442554,45.44255,45.429013,45.429076,45.428951,45.35519,45.355164,45.354867,45.354632,45.354518,45.354767,45.354773,45.354951,45.345788,45.339884,45.340006,45.340337,45.345146,45.345647,45.259928,45.257715,45.257729,45.196928,45.196898,45.080753,45.08069,45.010173,44.995877,44.997662,44.997439,44.996558,44.996241,45.082943,45.08294,45.171034,45.255936,45.255939,45.428579,45.515909,45.516076,45.573187,45.601935,45.602985,45.621409,45.704411,45.704977,45.746143,45.756429,45.802167,45.805961,45.826207,45.828536]}]],[[{"lng":[-124.1152,-124.110793224148,-124.10907,-124.109042455264,-124.108102657969,-124.108088,-124.109556,-124.109059,-124.106518,-124.104537939304,-124.100587,-124.098696003703,-124.092633,-124.09257772478,-124.092463110466,-124.086872,-124.084686,-124.084403674725,-124.0837,-124.083714,-124.083554722423,-124.083475419185,-124.08331,-124.084429,-124.083601,-124.077996,-124.077599366608,-124.076387,-124.075399,-124.071469543556,-124.070986189155,-124.070659499243,-124.069662181446,-124.067223499261,-124.06635,-124.066510728242,-124.066565382567,-124.067251,-124.06914,-124.068732391746,-124.068382456744,-124.068251,-124.066393894948,-124.06635,-124.067045,-124.065008,-124.063293560589,-124.062121498473,-124.058312330843,-124.058281,-124.060043,-124.063498,-124.066467,-124.07409,-124.078026,-124.079249,-124.072012,-124.068445,-124.065315427968,-124.063406,-124.059857,-124.057901,-124.058181453278,-124.058539,-124.06017,-124.064816,-124.064279,-124.06429,-124.068112,-124.066325,-124.069158,-124.075473,-124.074586244664,-124.073235024702,-124.073012,-124.073077,-124.074049344185,-124.074066,-124.067760724008,-124.067437,-124.063735,-124.063592299854,-124.063589011661,-124.063498,-124.063770144253,-124.067883,-124.067772,-124.067730713109,-124.067712670147,-124.06756,-124.067345158107,-124.066622,-124.061048,-124.059095250869,-124.054151,-124.053756784081,-124.048814,-124.045903377286,-124.037694989725,-124.032296,-124.025447618374,-124.025427720548,-124.025136,-124.025416882061,-124.025678,-124.024993086351,-124.024981927707,-124.024189142756,-124.023943285941,-124.023834,-124.02050369952,-124.017168554748,-124.017091597529,-124.016595443995,-124.016305243106,-124.015243,-124.014452951513,-124.013141309957,-124.012547595484,-124.012053555073,-124.011979123524,-124.0105900194,-124.009462791521,-124.009179,-124.010183,-124.012184,-124.011662,-124.00627,-124.005504,-124.008880714497,-123.986688,-123.967191,-123.967184,-123.955007,-123.911026,-123.895988,-123.801472,-123.784759,-123.724663,-123.725337,-123.725396,-123.725771,-123.724599,-123.724659,-123.724782,-123.724231,-123.724858,-123.724842,-123.725394,-123.725188,-123.725079,-123.725001,-123.716062,-123.704578,-123.704467,-123.602609,-123.603143,-123.602794,-123.602817,-123.596929,-123.596919,-123.596674,-123.596134,-123.597233,-123.59763,-123.597677,-123.608115,-123.648669,-123.66875,-123.679097,-123.68952,-123.699976,-123.720071,-123.720065,-123.72014,-123.715866,-123.715675,-123.715538,-123.735153,-123.734996,-123.816709,-123.816525,-123.775789,-123.775598,-123.798955,-123.941075,-123.941072,-124.063259,-124.063303,-124.083717,-124.114043752426,-124.113261,-124.113139093471,-124.111747,-124.1152],"lat":[44.286486,44.2988659489304,44.303707,44.3038814406453,44.3098331711722,44.309926,44.314545,44.318391,44.321848,44.3252125340905,44.331926,44.3411180393286,44.37059,44.3709219295689,44.371610192405,44.405185,44.420221,44.423136738616,44.430404,44.440011,44.4549692934339,44.4624169275216,44.477952,44.486927,44.501123,44.521985,44.5242600339205,44.531214,44.531606,44.5596389307304,44.5630872042146,44.5654178257118,44.5725327387105,44.589930414375,44.596162,44.59828090129,44.599001416354,44.60804,44.612979,44.615277011887,44.6172498737895,44.617991,44.6221223504817,44.62222,44.627851,44.632504,44.6392226043931,44.6438157219045,44.658743219609,44.658866,44.669361,44.672442,44.673061,44.673183,44.67565,44.6772,44.677917,44.683094,44.6955669500131,44.703177,44.716027,44.735163,44.7377481813923,44.741044,44.745076,44.746081,44.748465,44.753678,44.760618,44.762671,44.767806,44.771403,44.778483350406,44.7892722460794,44.791053,44.794318,44.7980431891997,44.798107,44.8043190617745,44.804638,44.80531,44.8094729907543,44.8095689172014,44.812224,44.8123385053927,44.814069,44.817815,44.8191507867329,44.8197345446305,44.824674,44.8260228314602,44.830563,44.834438,44.8355124791867,44.838233,44.839102683012,44.850007,44.8589587771585,44.8842041158734,44.900809,44.9269839736841,44.9270600245102,44.928175,44.9325110520331,44.936542,44.9414756811252,44.9415560608816,44.9472667780803,44.9490377737797,44.949825,44.9626480717717,44.9754897961224,44.9757861141132,44.977696516016,44.9788139127335,44.982904,44.9873098492237,44.9946244571541,44.9979354140053,45.0006905203016,45.0011056013856,45.0088521934298,45.0151383849173,45.016721,45.023823,45.026111,45.033485,45.038214,45.042931,45.0449987048377,45.044634,45.044843,45.045727,45.04572,45.045679,45.045552,45.044913,45.04473,45.044432,45.025068,45.023601,45.000746,45.00076,44.984273,44.962958,44.955493,44.94753,44.911745,44.88599,44.764328,44.753939,44.739046,44.739018,44.73898,44.721154,44.721154,44.709242,44.702125,44.651159,44.651139,44.545624,44.541804,44.477454,44.477454,44.46932,44.433109,44.433671,44.43342,44.432935,44.433928,44.433582,44.433788,44.433374,44.432329,44.389506,44.389495,44.379969,44.360458,44.36035,44.345778,44.344622,44.315303,44.316167,44.283547,44.283304,44.282951,44.277375,44.277178,44.275094,44.276117,44.2769899702691,44.277953,44.2783783845383,44.283236,44.286486]}]],[[{"lng":[-123.366516,-123.365968,-123.365373,-123.365677,-123.365152,-123.364652,-123.364329,-123.364023,-123.36375,-123.363743140809,-123.360561,-123.346252,-123.340655,-123.332335,-123.302588994244,-123.301034,-123.280166,-123.251233,-123.242026,-123.230813,-123.22243,-123.213054,-123.166414,-123.119730298412,-123.115904,-123.105021,-123.072955001104,-123.051064,-123.041297,-123.03382,-123.022885224802,-123.022147,-123.009436,-123.004233,-122.966694913215,-122.962681,-122.939676274918,-122.937415175285,-122.930461538264,-122.904119,-122.902954826569,-122.885933339972,-122.884478,-122.88307501286,-122.881327583221,-122.878092,-122.87766154657,-122.864284541462,-122.856158,-122.850300357308,-122.845875047125,-122.838578021636,-122.837638,-122.833420843631,-122.813998,-122.812215297032,-122.811841461838,-122.806193,-122.811204257205,-122.81151,-122.81006272961,-122.808350897773,-122.799082951662,-122.798091,-122.796820712691,-122.794675088814,-122.785026,-122.785121333263,-122.785299579417,-122.785515,-122.785696,-122.795963,-122.79572928967,-122.795605,-122.778983853061,-122.77064606136,-122.769532,-122.761451,-122.760974137953,-122.760108,-122.762189526428,-122.762437,-122.784663,-122.784735,-122.863423,-122.87539,-122.885463,-122.929146,-122.928901,-122.990368,-122.990344,-123.011137,-123.031837,-123.0317,-123.030873,-123.050674,-123.051181,-123.115179,-123.122083,-123.195899,-123.215543,-123.34041,-123.361622,-123.361003,-123.360794,-123.358826,-123.360627,-123.360365,-123.360427,-123.360564,-123.360303,-123.359489,-123.359614,-123.367438,-123.366516],"lat":[46.058442,46.069546,46.08312,46.099071,46.111274,46.120724,46.125069,46.127255,46.135489,46.1463246103232,46.146305,46.145065,46.146183,46.146132,46.1447065181102,46.144632,46.144843,46.156452,46.160968,46.164287,46.167682,46.172541,46.188973,46.1855486659199,46.185268,46.177676,46.1633673272527,46.153599,46.146351,46.144336,46.1394405031111,46.13911,46.136043,46.133823,46.1076189726297,46.104817,46.0965350318481,46.0957210097251,46.0932176196546,46.083734,46.0823438200884,46.0620178719878,46.06028,46.0539089971682,46.0459738715663,46.031281,46.0309510655119,46.0206978417551,46.014469,46.0038262451976,45.9957858962594,45.9825279259201,45.98082,45.9772814418892,45.960984,45.9544589188486,45.9530906006144,45.932416,45.9138572891451,45.912725,45.9096628567015,45.9060409527215,45.8864317772246,45.884333,45.8827157050054,45.8799839554795,45.867699,45.8643529779321,45.8580968659956,45.850536,45.844216,45.825024,45.815216,45.81,45.7912471031523,45.7818399456152,45.780583,45.759163,45.7503749615244,45.734413,45.7285767375573,45.728665,45.72865,45.720946,45.721416,45.721418,45.721378,45.721482,45.735688,45.736459,45.750835,45.751458,45.75142,45.765779,45.779159,45.779362,45.779371,45.780131,45.780154,45.779909,45.77994,45.779849,45.779579,45.786853,45.808172,45.836657,45.866592,45.874827,45.879307,45.953402,45.953538,46.011211,46.039372,46.039528,46.058442]}]],[[{"lng":[-120.49516,-120.309328,-120.131926,-120.128661,-120.086479,-120.028785,-120.005372,-120.000045,-119.91054,-119.910536,-119.876525,-119.850941,-119.790699,-119.790961,-119.791162,-119.781719,-119.770244,-119.672228,-119.671532,-119.652431,-119.653184,-119.653347,-119.653476,-119.653538,-119.653885,-119.653673,-119.653832,-119.653696,-119.655108,-119.655248,-119.655517,-119.899002,-119.899283,-119.960375,-119.970532,-120.000617,-120.010547,-120.020708,-120.021621,-120.101166,-120.143544,-120.36646,-120.386074,-120.385775,-120.387186,-120.386561,-120.385768,-120.386378,-120.385687,-120.387642,-120.388118,-120.387452,-120.387782,-120.389667,-120.393046,-120.398603,-120.399248,-120.397984,-120.394825,-120.394254,-120.394668,-120.39737,-120.400743,-120.404685,-120.404676,-120.401654,-120.399226,-120.398292,-120.395872,-120.394109,-120.393173,-120.390987,-120.385062,-120.385877,-120.381376,-120.379794,-120.379005,-120.380814,-120.384813,-120.385489,-120.386498,-120.386035,-120.38353,-120.377797,-120.377062,-120.380711,-120.379053,-120.372635,-120.371441,-120.372173,-120.376617,-120.378686,-120.380249,-120.387086,-120.390315,-120.394199,-120.397282,-120.400495,-120.401587,-120.405023,-120.405045,-120.405558,-120.40829,-120.410061,-120.410794,-120.411979,-120.41258,-120.413864,-120.41846,-120.424464,-120.427549,-120.433469,-120.435567,-120.43628,-120.439561,-120.443361,-120.445746,-120.452471,-120.455204,-120.454163,-120.454706,-120.456202,-120.459592,-120.460353,-120.460126,-120.458764,-120.455737,-120.451259,-120.446918,-120.440553,-120.438784,-120.436139,-120.436328,-120.43946,-120.444521,-120.450991,-120.453485,-120.454775,-120.455771,-120.458259,-120.460798,-120.462494,-120.467323,-120.469777,-120.473566,-120.474136,-120.468899,-120.468709,-120.471074,-120.471271,-120.470127,-120.470495,-120.472776,-120.476621,-120.47708,-120.474898,-120.472884,-120.476528,-120.478641,-120.480293,-120.481685,-120.479385,-120.482655,-120.488231,-120.489133,-120.487029,-120.486572,-120.485083,-120.484919,-120.485821,-120.485982,-120.482025,-120.479707,-120.477292,-120.476778,-120.476773,-120.477712,-120.47929,-120.48367,-120.483766,-120.480902,-120.47751,-120.477168,-120.479487,-120.478688,-120.480046,-120.481248,-120.482877,-120.483767,-120.487246,-120.487646,-120.486545,-120.482573,-120.480864,-120.481745,-120.479645,-120.479545,-120.480945,-120.488946,-120.488946,-120.485646,-120.483446,-120.481346,-120.481046,-120.488046,-120.489747,-120.489047,-120.484947,-120.483647,-120.482647,-120.483347,-120.488547,-120.489347,-120.489647,-120.490647,-120.494048,-120.495548,-120.49516],"lat":[45.068279,45.06779,45.067354,45.065453,45.065398,45.065224,45.065582,45.065591,45.066927,45.067928,45.067866,45.067783,45.067823,45.023517,44.994755,44.994816,44.995193,44.995117,44.823343,44.823299,44.762701,44.652252,44.652251,44.621785,44.534131,44.461288,44.454961,44.38917,44.389206,44.34547,44.307045,44.30662,44.389575,44.389457,44.388968,44.389104,44.389727,44.389687,44.438793,44.43821,44.437751,44.437015,44.436083,44.476624,44.476624,44.564009,44.578606,44.653068,44.761175,44.761979,44.763229,44.767886,44.769866,44.771638,44.773307,44.776973,44.778767,44.78073,44.782665,44.784272,44.786038,44.788414,44.789951,44.792695,44.794719,44.797861,44.799835,44.802357,44.803969,44.802712,44.797013,44.795784,44.796406,44.798474,44.800721,44.80298,44.806314,44.807352,44.807041,44.809674,44.809966,44.810985,44.8119,44.812034,44.814826,44.817938,44.819357,44.82037,44.821769,44.822846,44.825007,44.826877,44.826872,44.829257,44.829733,44.829201,44.829377,44.830109,44.830843,44.833779,44.838678,44.839274,44.839552,44.840381,44.845693,44.848417,44.852174,44.852907,44.853762,44.853468,44.853686,44.85675,44.860148,44.862316,44.863607,44.863812,44.863058,44.8644,44.865607,44.869667,44.872612,44.873867,44.874285,44.876113,44.878216,44.881199,44.88281,44.884215,44.884591,44.886701,44.888013,44.894064,44.894791,44.899629,44.904258,44.908663,44.908317,44.907264,44.905132,44.903736,44.903973,44.905528,44.907439,44.907436,44.908162,44.909661,44.913388,44.913847,44.916909,44.919343,44.922126,44.924502,44.927367,44.929493,44.932197,44.933343,44.935458,44.940262,44.942458,44.943142,44.945507,44.947337,44.949244,44.950682,44.951299,44.954047,44.955769,44.956472,44.959686,44.960692,44.962749,44.965194,44.965188,44.966344,44.967456,44.970088,44.972278,44.972941,44.972849,44.975432,44.978676,44.980374,44.981876,44.984596,44.988537,44.989763,44.992758,44.998224,45.000113,45.00165,45.002949,45.00615,45.007686,45.009024,45.01105,45.01525,45.01895,45.02115,45.02705,45.02915,45.03255,45.03415,45.03705,45.03895,45.04315,45.04715,45.04855,45.05195,45.05345,45.05635,45.05695,45.05785,45.05855,45.06095,45.06315,45.06295,45.06355,45.068279]}]],[[{"lng":[-123.231001,-123.230969,-123.230951,-123.231093,-123.229167,-123.229851,-123.2299,-123.229901,-123.229761,-123.229402,-123.229284,-123.229271,-123.229545,-123.229676,-123.229526,-123.229581,-123.229619,-123.229635,-123.210392,-123.209912,-123.200424,-123.200419,-123.190504,-123.190456,-123.180551,-123.180512,-123.152023,-123.152233,-123.112652,-123.112688,-123.009765,-123.009744,-122.990728,-122.990035,-122.970492,-122.970829,-122.95119,-122.951199,-122.9451,-122.93175,-122.9178,-122.911925,-122.868692,-122.852943,-122.853707,-122.833971,-122.814413,-122.794776,-122.794811,-122.785493,-122.784914,-122.775044,-122.775223,-122.756079,-122.756033,-122.736367,-122.736329,-122.716699,-122.716657,-122.69701,-122.697017,-122.677198,-122.677181,-122.637695,-122.637812,-122.621665,-122.600251,-122.600202,-122.580094,-122.580049,-122.560299,-122.560273,-122.520741,-122.520525,-122.460224,-122.46021,-122.440505,-122.440535,-122.420863,-122.420844,-122.401077,-122.401041,-122.401025,-122.40031,-122.385922,-122.28273,-122.282708,-122.283792,-122.283778,-122.283449,-122.284689,-122.287818,-122.287686,-122.28769,-122.287177,-122.287458,-122.28747,-122.289972,-122.289748006076,-122.320293,-122.368051522242,-122.378511,-122.403459336051,-122.416638,-122.493322,-122.548911,-122.61541287471,-122.634696,-122.672521,-122.713058,-122.75363522358,-122.813845,-122.867298,-122.870830789468,-122.875515469317,-122.884017334375,-122.889935,-122.893590970866,-122.961670756599,-122.963801,-122.988318483577,-123.043997,-123.062882,-123.080938,-123.102698940572,-123.125165,-123.145735,-123.183923,-123.23111258448,-123.231001],"lat":[42.004931,42.082066,42.098876,42.128069,42.128331,42.280466,42.287434,42.290816,42.312847,42.355665,42.420299,42.429362,42.495623,42.551766,42.626212,42.668065,42.70261,42.709956,42.709983,42.717161,42.717236,42.724474,42.724495,42.731703,42.731655,42.737765,42.737721,42.755835,42.75575,42.752218,42.752144,42.75941,42.759538,42.76095,42.760945,42.768116,42.767555,42.774773,42.774805,42.774874,42.774753,42.774704,42.774541,42.774603,42.781766,42.780653,42.780511,42.778221,42.792721,42.792712,42.806845,42.806831,42.8288,42.828689,42.823195,42.823496,42.837661,42.837671,42.85211,42.852099,42.866572,42.866603,42.88108,42.881141,42.89699,42.896812,42.895693,42.911073,42.9108,42.924651,42.92469,42.939185,42.939077,42.93976,42.939873,42.954373,42.95442,42.968923,42.968927,42.983439,42.983458,42.993456,42.996632,42.996632,42.996644,42.996499,42.910928,42.910926,42.901702,42.707455,42.4745,42.4745,42.395348,42.392086,42.288838,42.202994,42.127168,42.127156,42.0081011637255,42.008609,42.0093276173603,42.009485,42.0087619451744,42.00838,42.008121,42.007518,42.0055939147516,42.005036,42.004687,42.004211,42.0041828177379,42.004141,42.003945,42.0039200299812,42.0038869183156,42.0038268265009,42.003785,42.0037712404909,42.0035150173241,42.003507,42.003377680638,42.003084,42.00482,42.005064,42.0065873199631,42.00816,42.008761,42.005789,42.0039324384249,42.004931]}]],[[{"lng":[-123.725396,-123.725337,-123.724663,-123.724368,-123.657202,-123.627081,-123.622159,-123.601657,-123.599208,-123.576563,-123.57142,-123.568496,-123.561352,-123.551215,-123.550602,-123.50222,-123.495414,-123.49442,-123.478264,-123.477905,-123.468746,-123.448934,-123.412698,-123.396679,-123.339945,-123.321413,-123.249322,-123.209454,-123.186276,-123.092128,-123.068667,-123.068271,-123.068079,-123.066732,-123.06603,-123.065974,-123.067043,-123.067835,-123.068849,-123.068975,-123.070654,-123.072732,-123.073539,-123.074284,-123.075113,-123.075174,-123.075577,-123.074723,-123.071977,-123.069219,-123.068685,-123.066938,-123.065415,-123.064261,-123.058089,-123.055299,-123.05465,-123.053762,-123.051824,-123.047081,-123.042938,-123.041717,-123.040853,-123.040529,-123.040164,-123.037897,-123.037374,-123.037594,-123.037779,-123.037807,-123.037316,-123.036985,-123.037566,-123.038923,-123.037897,-123.038095,-123.039822,-123.04148,-123.042127,-123.042906,-123.043631,-123.044433,-123.0496,-123.054933,-123.060074,-123.062005,-123.067478,-123.06993,-123.071687,-123.072813,-123.076574,-123.081694,-123.082998,-123.091347,-123.093008,-123.105091,-123.109725,-123.111472,-123.112769,-123.1123,-123.110396,-123.108165,-123.107108,-123.108792,-123.11321,-123.116542,-123.120462,-123.123769,-123.125287,-123.128245,-123.13017,-123.132383,-123.13309,-123.134498,-123.13733,-123.141485,-123.144973,-123.146617,-123.147995,-123.147924,-123.149402,-123.152597,-123.155436,-123.1616,-123.16781,-123.170891,-123.174215,-123.178468,-123.180532,-123.180908,-123.180944,-123.180122,-123.179857,-123.179881,-123.180117,-123.18001,-123.179829,-123.179758,-123.179677,-123.179555,-123.179387,-123.17778,-123.173863,-123.169856,-123.166472,-123.158928,-123.154541,-123.152849,-123.151364,-123.149254,-123.143754,-123.140136,-123.131734,-123.126252,-123.118528,-123.1114,-123.109462,-123.103566,-123.101167,-123.093335,-123.091479,-123.091349,-123.09199,-123.095698,-123.097713,-123.102131,-123.110229,-123.117983,-123.122064,-123.124779,-123.125807,-123.126787,-123.128571,-123.129627,-123.131328,-123.132924,-123.133628,-123.137656,-123.140101,-123.144012,-123.145812,-123.14752,-123.148333,-123.148411,-123.147833,-123.145463,-123.143843,-123.140884,-123.137757,-123.135106,-123.1327,-123.132445,-123.133529,-123.137819,-123.146582,-123.150429,-123.150763,-123.150297,-123.149025,-123.182025,-123.201917,-123.221593,-123.23521,-123.240276,-123.301882,-123.316612,-123.339138,-123.409764,-123.414116,-123.438419,-123.47056,-123.54132,-123.580966,-123.602609,-123.704467,-123.704578,-123.716062,-123.725001,-123.725079,-123.725188,-123.725394,-123.724842,-123.724858,-123.724231,-123.724782,-123.724659,-123.724599,-123.725771,-123.725396],"lat":[45.023601,45.025068,45.044432,45.076226,45.076118,45.076067,45.076056,45.07602,45.076016,45.075976,45.075899,45.075848,45.075733,45.075568,45.075553,45.075115,45.07513,45.075138,45.075175,45.075176,45.0752,45.075293,45.075365,45.075389,45.075495,45.075527,45.075073,45.074982,45.075013,45.074932,45.07486,45.074864,45.074288,45.071438,45.069102,45.068042,45.060738,45.054188,45.046709,45.041493,45.036599,45.033397,45.031314,45.02584,45.021657,45.017489,45.014513,45.012533,45.008897,45.000505,44.998378,44.995005,44.990718,44.989778,44.989368,44.989826,44.989868,44.989928,44.990302,44.991041,44.990026,44.989381,44.98877,44.988502,44.988153,44.984421,44.981139,44.979621,44.977463,44.975841,44.972795,44.967428,44.965581,44.961154,44.958779,44.95657,44.95165,44.948114,44.947098,44.945975,44.94495,44.944231,44.942701,44.940694,44.937885,44.936207,44.932214,44.92905,44.928107,44.927686,44.926914,44.926878,44.927167,44.930297,44.930541,44.93044,44.930863,44.930161,44.928728,44.926012,44.923826,44.92249,44.920337,44.917505,44.914782,44.913242,44.912185,44.910536,44.909273,44.904764,44.90073,44.894683,44.891904,44.889368,44.887259,44.88374,44.877305,44.870722,44.866795,44.863181,44.861254,44.860059,44.860009,44.861579,44.864022,44.864462,44.863534,44.861006,44.858765,44.857553,44.855601,44.851647,44.845611,44.844667,44.841506,44.839568,44.837984,44.837131,44.836601,44.83612,44.835729,44.833332,44.83042,44.829041,44.828733,44.830236,44.830219,44.829536,44.827607,44.826506,44.825398,44.825503,44.826479,44.826079,44.822803,44.821691,44.82098,44.818847,44.817768,44.814044,44.811523,44.80953,44.806642,44.800848,44.799099,44.797542,44.796516,44.794537,44.793774,44.792666,44.791961,44.79117,44.789249,44.787897,44.785587,44.779867,44.778736,44.775272,44.773729,44.771832,44.770231,44.765404,44.760578,44.755137,44.751446,44.749516,44.748914,44.747632,44.747062,44.745741,44.743363,44.741157,44.738662,44.736145,44.731585,44.727611,44.72578,44.722689,44.720225,44.720085,44.720099,44.720125,44.720146,44.719914,44.719835,44.719994,44.720059,44.720531,44.720552,44.720622,44.720722,44.72127,44.719415,44.721154,44.721154,44.73898,44.739018,44.739046,44.753939,44.764328,44.88599,44.911745,44.94753,44.955493,44.962958,44.984273,45.00076,45.000746,45.023601]}]],[[{"lng":[-124.462619,-124.455669,-124.448625230642,-124.446875,-124.436198,-124.434655,-124.436655,-124.434312105988,-124.434213,-124.433542433297,-124.432236,-124.435157,-124.433357,-124.433641,-124.434527236125,-124.43785,-124.437373631068,-124.434451,-124.434419666916,-124.429253343926,-124.427595577081,-124.425024028606,-124.424113,-124.401726,-124.395302,-124.395338287504,-124.397382,-124.395607,-124.38246,-124.384117648066,-124.38708,-124.388891,-124.393988,-124.395536,-124.400404,-124.402814,-124.394143,-124.38972,-124.387642,-124.385296,-124.384603,-124.376997,-124.373037,-124.353332,-124.343247,-124.330671,-124.315012,-124.286896,-124.279473391428,-124.2782229273,-124.255609,-124.232025,-124.231975100174,-124.218966377223,-124.183435,-124.180894,-124.146347,-124.100765,-124.062969,-123.979004,-123.949565,-123.949573,-123.875698,-123.875628,-123.816657,-123.817154,-123.817614,-123.769016,-123.764884,-123.761528,-123.762801,-123.761983,-123.762289,-123.764496,-123.763917,-123.764339,-123.764356,-123.704752,-123.704456,-123.703862,-123.703568,-123.703417,-123.703655,-123.702167,-123.702131,-123.702139,-123.702144,-123.707059,-123.707057,-123.761333,-123.761384,-123.761594,-123.821118,-123.821121,-123.821513,-123.820515,-123.819496,-123.81915,-123.819144,-123.820439,-123.811789,-123.811553,-123.849858,-123.84989,-123.868282,-123.868491,-123.925717,-123.925942,-123.937268,-123.937288,-123.957026,-123.956985,-123.976631,-123.976677,-123.996296,-123.996291,-124.070314,-124.089872,-124.089872,-124.1192,-124.119228,-124.128073,-124.128049,-124.132918,-124.132926,-124.138748,-124.138686,-124.138655,-124.159966,-124.159895,-124.160163,-124.164887,-124.164225,-124.164889,-124.160149,-124.160658,-124.141185,-124.141475,-124.146344,-124.146377,-124.151235,-124.151209,-124.156491,-124.156629,-124.162074,-124.161288,-124.160976,-124.161308,-124.180704,-124.180706,-124.18531,-124.185291,-124.189907,-124.189984,-124.199692,-124.199717,-124.204529,-124.204851,-124.214201,-124.214393,-124.209522,-124.209708,-124.219416,-124.219623,-124.239394,-124.239129,-124.24387,-124.243779,-124.253317,-124.253467,-124.258274,-124.258388,-124.269254,-124.296347,-124.41539,-124.415423,-124.434245,-124.438676,-124.479636362958,-124.462619],"lat":[42.99143,43.008349,43.0271390597407,43.031808,43.071312,43.081469,43.085816,43.0895749921129,43.089734,43.0923284181646,43.097383,43.104678,43.108563,43.111397,43.111948449848,43.114016,43.114292094968,43.115986,43.1160189545965,43.1214526390494,43.123196196692,43.1259008249145,43.126859,43.184896,43.211101,43.2112497264283,43.219626,43.223908,43.270167,43.2727944798235,43.27749,43.290523,43.29926,43.30224,43.302121,43.305872,43.315651,43.323216,43.325968,43.32773,43.332848,43.334231,43.338953,43.342667,43.351517,43.366559,43.388389,43.436296,43.4519245921396,43.454557493182,43.502172,43.562393,43.5625784778939,43.6109319633736,43.610925,43.611445,43.611216,43.611244,43.609641,43.609363,43.609265,43.608472,43.608407,43.515947,43.516449,43.459594,43.431306,43.431695,43.431548,43.422294,43.387997,43.358748,43.351419,43.344799,43.287099,43.2636,43.258054,43.257741,43.243253,43.214139,43.186134,43.177696,43.170579,43.17059,43.113946,43.112458,43.087083,43.087067,43.083457,43.08316,43.054511,42.996318,42.996291,42.965284,42.924483,42.909675,42.909661,42.885135,42.884356,42.824112,42.824101,42.788837,42.788994,42.781821,42.781921,42.77484,42.774514,42.73971,42.739666,42.729097,42.729051,42.714569,42.714558,42.700118,42.7001,42.685651,42.685327,42.685454,42.678208,42.678339,42.671129,42.671123,42.666684,42.666697,42.671119,42.671115,42.729928,42.739956,42.739947,42.768326,42.790087,42.790006,42.804038,42.817825,42.817761,42.828288,42.828475,42.850586,42.850511,42.862081,42.862067,42.86581,42.8658,42.869642,42.86973,42.874824,42.876642,42.883499,42.88245,42.885998,42.885919,42.893047,42.893032,42.896696,42.896656,42.900275,42.900327,42.90391,42.904006,42.911141,42.911125,42.918227,42.918156,42.933782,42.933751,42.940948,42.940652,42.9443,42.943809,42.951314,42.951152,42.954946,42.954877,42.954621,42.955232,42.953769,42.95369,42.953817,42.9543325389089,42.99143]}]]],null,"cnty",{"crs":{"crsClass":"L.CRS.EPSG3857","code":null,"proj4def":null,"projectedBounds":null,"options":{}},"pane":"polygon","stroke":true,"color":"#333333","weight":0.5,"opacity":0.9,"fill":true,"fillColor":"#6666FF","fillOpacity":0.6,"smoothFactor":1,"noClip":false},["<div class='scrollableContainer'><table class=mapview-popup id='popup'><tr class='coord'><td><\/td><th><b>Feature ID <\/b><\/th><td>1 <\/td><\/tr><tr><td>1<\/td><th>GEOID <\/th><td>41033 <\/td><\/tr><tr><td>2<\/td><th>NAME <\/th><td>Josephine County, Oregon <\/td><\/tr><tr><td>3<\/td><th>variable <\/th><td>ed_attain <\/td><\/tr><tr><td>4<\/td><th>estimate <\/th><td> 65703 <\/td><\/tr><tr><td>5<\/td><th>moe <\/th><td>186 <\/td><\/tr><tr><td>6<\/td><th>geometry <\/th><td>sfc_MULTIPOLYGON <\/td><\/tr><\/table><\/div>","<div class='scrollableContainer'><table class=mapview-popup id='popup'><tr class='coord'><td><\/td><th><b>Feature ID <\/b><\/th><td>2 <\/td><\/tr><tr><td>1<\/td><th>GEOID <\/th><td>41045 <\/td><\/tr><tr><td>2<\/td><th>NAME <\/th><td>Malheur County, Oregon <\/td><\/tr><tr><td>3<\/td><th>variable <\/th><td>ed_attain <\/td><\/tr><tr><td>4<\/td><th>estimate <\/th><td> 20497 <\/td><\/tr><tr><td>5<\/td><th>moe <\/th><td>127 <\/td><\/tr><tr><td>6<\/td><th>geometry <\/th><td>sfc_MULTIPOLYGON <\/td><\/tr><\/table><\/div>","<div class='scrollableContainer'><table class=mapview-popup id='popup'><tr class='coord'><td><\/td><th><b>Feature ID <\/b><\/th><td>3 <\/td><\/tr><tr><td>1<\/td><th>GEOID <\/th><td>41001 <\/td><\/tr><tr><td>2<\/td><th>NAME <\/th><td>Baker County, Oregon <\/td><\/tr><tr><td>3<\/td><th>variable <\/th><td>ed_attain <\/td><\/tr><tr><td>4<\/td><th>estimate <\/th><td> 12415 <\/td><\/tr><tr><td>5<\/td><th>moe <\/th><td>104 <\/td><\/tr><tr><td>6<\/td><th>geometry <\/th><td>sfc_MULTIPOLYGON <\/td><\/tr><\/table><\/div>","<div class='scrollableContainer'><table class=mapview-popup id='popup'><tr class='coord'><td><\/td><th><b>Feature ID <\/b><\/th><td>4 <\/td><\/tr><tr><td>1<\/td><th>GEOID <\/th><td>41021 <\/td><\/tr><tr><td>2<\/td><th>NAME <\/th><td>Gilliam County, Oregon <\/td><\/tr><tr><td>3<\/td><th>variable <\/th><td>ed_attain <\/td><\/tr><tr><td>4<\/td><th>estimate <\/th><td> 1477 <\/td><\/tr><tr><td>5<\/td><th>moe <\/th><td> 68 <\/td><\/tr><tr><td>6<\/td><th>geometry <\/th><td>sfc_MULTIPOLYGON <\/td><\/tr><\/table><\/div>","<div class='scrollableContainer'><table class=mapview-popup id='popup'><tr class='coord'><td><\/td><th><b>Feature ID <\/b><\/th><td>5 <\/td><\/tr><tr><td>1<\/td><th>GEOID <\/th><td>41015 <\/td><\/tr><tr><td>2<\/td><th>NAME <\/th><td>Curry County, Oregon <\/td><\/tr><tr><td>3<\/td><th>variable <\/th><td>ed_attain <\/td><\/tr><tr><td>4<\/td><th>estimate <\/th><td> 19116 <\/td><\/tr><tr><td>5<\/td><th>moe <\/th><td>120 <\/td><\/tr><tr><td>6<\/td><th>geometry <\/th><td>sfc_MULTIPOLYGON <\/td><\/tr><\/table><\/div>","<div class='scrollableContainer'><table class=mapview-popup id='popup'><tr class='coord'><td><\/td><th><b>Feature ID <\/b><\/th><td>6 <\/td><\/tr><tr><td>1<\/td><th>GEOID <\/th><td>41039 <\/td><\/tr><tr><td>2<\/td><th>NAME <\/th><td>Lane County, Oregon <\/td><\/tr><tr><td>3<\/td><th>variable <\/th><td>ed_attain <\/td><\/tr><tr><td>4<\/td><th>estimate <\/th><td>264813 <\/td><\/tr><tr><td>5<\/td><th>moe <\/th><td> 66 <\/td><\/tr><tr><td>6<\/td><th>geometry <\/th><td>sfc_MULTIPOLYGON <\/td><\/tr><\/table><\/div>","<div class='scrollableContainer'><table class=mapview-popup id='popup'><tr class='coord'><td><\/td><th><b>Feature ID <\/b><\/th><td>7 <\/td><\/tr><tr><td>1<\/td><th>GEOID <\/th><td>41025 <\/td><\/tr><tr><td>2<\/td><th>NAME <\/th><td>Harney County, Oregon <\/td><\/tr><tr><td>3<\/td><th>variable <\/th><td>ed_attain <\/td><\/tr><tr><td>4<\/td><th>estimate <\/th><td> 5499 <\/td><\/tr><tr><td>5<\/td><th>moe <\/th><td> 89 <\/td><\/tr><tr><td>6<\/td><th>geometry <\/th><td>sfc_MULTIPOLYGON <\/td><\/tr><\/table><\/div>","<div class='scrollableContainer'><table class=mapview-popup id='popup'><tr class='coord'><td><\/td><th><b>Feature ID <\/b><\/th><td>8 <\/td><\/tr><tr><td>1<\/td><th>GEOID <\/th><td>41005 <\/td><\/tr><tr><td>2<\/td><th>NAME <\/th><td>Clackamas County, Oregon <\/td><\/tr><tr><td>3<\/td><th>variable <\/th><td>ed_attain <\/td><\/tr><tr><td>4<\/td><th>estimate <\/th><td>300373 <\/td><\/tr><tr><td>5<\/td><th>moe <\/th><td> 58 <\/td><\/tr><tr><td>6<\/td><th>geometry <\/th><td>sfc_MULTIPOLYGON <\/td><\/tr><\/table><\/div>","<div class='scrollableContainer'><table class=mapview-popup id='popup'><tr class='coord'><td><\/td><th><b>Feature ID <\/b><\/th><td>9 <\/td><\/tr><tr><td>1<\/td><th>GEOID <\/th><td>41047 <\/td><\/tr><tr><td>2<\/td><th>NAME <\/th><td>Marion County, Oregon <\/td><\/tr><tr><td>3<\/td><th>variable <\/th><td>ed_attain <\/td><\/tr><tr><td>4<\/td><th>estimate <\/th><td>230076 <\/td><\/tr><tr><td>5<\/td><th>moe <\/th><td>209 <\/td><\/tr><tr><td>6<\/td><th>geometry <\/th><td>sfc_MULTIPOLYGON <\/td><\/tr><\/table><\/div>","<div class='scrollableContainer'><table class=mapview-popup id='popup'><tr class='coord'><td><\/td><th><b>Feature ID <\/b><\/th><td>10 <\/td><\/tr><tr><td>1<\/td><th>GEOID <\/th><td>41031 <\/td><\/tr><tr><td>2<\/td><th>NAME <\/th><td>Jefferson County, Oregon <\/td><\/tr><tr><td>3<\/td><th>variable <\/th><td>ed_attain <\/td><\/tr><tr><td>4<\/td><th>estimate <\/th><td> 17060 <\/td><\/tr><tr><td>5<\/td><th>moe <\/th><td> 76 <\/td><\/tr><tr><td>6<\/td><th>geometry <\/th><td>sfc_MULTIPOLYGON <\/td><\/tr><\/table><\/div>","<div class='scrollableContainer'><table class=mapview-popup id='popup'><tr class='coord'><td><\/td><th><b>Feature ID <\/b><\/th><td>11 <\/td><\/tr><tr><td>1<\/td><th>GEOID <\/th><td>41035 <\/td><\/tr><tr><td>2<\/td><th>NAME <\/th><td>Klamath County, Oregon <\/td><\/tr><tr><td>3<\/td><th>variable <\/th><td>ed_attain <\/td><\/tr><tr><td>4<\/td><th>estimate <\/th><td> 48771 <\/td><\/tr><tr><td>5<\/td><th>moe <\/th><td>140 <\/td><\/tr><tr><td>6<\/td><th>geometry <\/th><td>sfc_MULTIPOLYGON <\/td><\/tr><\/table><\/div>","<div class='scrollableContainer'><table class=mapview-popup id='popup'><tr class='coord'><td><\/td><th><b>Feature ID <\/b><\/th><td>12 <\/td><\/tr><tr><td>1<\/td><th>GEOID <\/th><td>41013 <\/td><\/tr><tr><td>2<\/td><th>NAME <\/th><td>Crook County, Oregon <\/td><\/tr><tr><td>3<\/td><th>variable <\/th><td>ed_attain <\/td><\/tr><tr><td>4<\/td><th>estimate <\/th><td> 18626 <\/td><\/tr><tr><td>5<\/td><th>moe <\/th><td>171 <\/td><\/tr><tr><td>6<\/td><th>geometry <\/th><td>sfc_MULTIPOLYGON <\/td><\/tr><\/table><\/div>","<div class='scrollableContainer'><table class=mapview-popup id='popup'><tr class='coord'><td><\/td><th><b>Feature ID <\/b><\/th><td>13 <\/td><\/tr><tr><td>1<\/td><th>GEOID <\/th><td>41061 <\/td><\/tr><tr><td>2<\/td><th>NAME <\/th><td>Union County, Oregon <\/td><\/tr><tr><td>3<\/td><th>variable <\/th><td>ed_attain <\/td><\/tr><tr><td>4<\/td><th>estimate <\/th><td> 17596 <\/td><\/tr><tr><td>5<\/td><th>moe <\/th><td> 60 <\/td><\/tr><tr><td>6<\/td><th>geometry <\/th><td>sfc_MULTIPOLYGON <\/td><\/tr><\/table><\/div>","<div class='scrollableContainer'><table class=mapview-popup id='popup'><tr class='coord'><td><\/td><th><b>Feature ID <\/b><\/th><td>14 <\/td><\/tr><tr><td>1<\/td><th>GEOID <\/th><td>41019 <\/td><\/tr><tr><td>2<\/td><th>NAME <\/th><td>Douglas County, Oregon <\/td><\/tr><tr><td>3<\/td><th>variable <\/th><td>ed_attain <\/td><\/tr><tr><td>4<\/td><th>estimate <\/th><td> 82360 <\/td><\/tr><tr><td>5<\/td><th>moe <\/th><td> 82 <\/td><\/tr><tr><td>6<\/td><th>geometry <\/th><td>sfc_MULTIPOLYGON <\/td><\/tr><\/table><\/div>","<div class='scrollableContainer'><table class=mapview-popup id='popup'><tr class='coord'><td><\/td><th><b>Feature ID <\/b><\/th><td>15 <\/td><\/tr><tr><td>1<\/td><th>GEOID <\/th><td>41051 <\/td><\/tr><tr><td>2<\/td><th>NAME <\/th><td>Multnomah County, Oregon <\/td><\/tr><tr><td>3<\/td><th>variable <\/th><td>ed_attain <\/td><\/tr><tr><td>4<\/td><th>estimate <\/th><td>598188 <\/td><\/tr><tr><td>5<\/td><th>moe <\/th><td>NA <\/td><\/tr><tr><td>6<\/td><th>geometry <\/th><td>sfc_MULTIPOLYGON <\/td><\/tr><\/table><\/div>","<div class='scrollableContainer'><table class=mapview-popup id='popup'><tr class='coord'><td><\/td><th><b>Feature ID <\/b><\/th><td>16 <\/td><\/tr><tr><td>1<\/td><th>GEOID <\/th><td>41023 <\/td><\/tr><tr><td>2<\/td><th>NAME <\/th><td>Grant County, Oregon <\/td><\/tr><tr><td>3<\/td><th>variable <\/th><td>ed_attain <\/td><\/tr><tr><td>4<\/td><th>estimate <\/th><td> 5609 <\/td><\/tr><tr><td>5<\/td><th>moe <\/th><td> 52 <\/td><\/tr><tr><td>6<\/td><th>geometry <\/th><td>sfc_MULTIPOLYGON <\/td><\/tr><\/table><\/div>","<div class='scrollableContainer'><table class=mapview-popup id='popup'><tr class='coord'><td><\/td><th><b>Feature ID <\/b><\/th><td>17 <\/td><\/tr><tr><td>1<\/td><th>GEOID <\/th><td>41003 <\/td><\/tr><tr><td>2<\/td><th>NAME <\/th><td>Benton County, Oregon <\/td><\/tr><tr><td>3<\/td><th>variable <\/th><td>ed_attain <\/td><\/tr><tr><td>4<\/td><th>estimate <\/th><td> 58369 <\/td><\/tr><tr><td>5<\/td><th>moe <\/th><td>183 <\/td><\/tr><tr><td>6<\/td><th>geometry <\/th><td>sfc_MULTIPOLYGON <\/td><\/tr><\/table><\/div>","<div class='scrollableContainer'><table class=mapview-popup id='popup'><tr class='coord'><td><\/td><th><b>Feature ID <\/b><\/th><td>18 <\/td><\/tr><tr><td>1<\/td><th>GEOID <\/th><td>41055 <\/td><\/tr><tr><td>2<\/td><th>NAME <\/th><td>Sherman County, Oregon <\/td><\/tr><tr><td>3<\/td><th>variable <\/th><td>ed_attain <\/td><\/tr><tr><td>4<\/td><th>estimate <\/th><td> 1368 <\/td><\/tr><tr><td>5<\/td><th>moe <\/th><td> 98 <\/td><\/tr><tr><td>6<\/td><th>geometry <\/th><td>sfc_MULTIPOLYGON <\/td><\/tr><\/table><\/div>","<div class='scrollableContainer'><table class=mapview-popup id='popup'><tr class='coord'><td><\/td><th><b>Feature ID <\/b><\/th><td>19 <\/td><\/tr><tr><td>1<\/td><th>GEOID <\/th><td>41043 <\/td><\/tr><tr><td>2<\/td><th>NAME <\/th><td>Linn County, Oregon <\/td><\/tr><tr><td>3<\/td><th>variable <\/th><td>ed_attain <\/td><\/tr><tr><td>4<\/td><th>estimate <\/th><td> 89890 <\/td><\/tr><tr><td>5<\/td><th>moe <\/th><td>128 <\/td><\/tr><tr><td>6<\/td><th>geometry <\/th><td>sfc_MULTIPOLYGON <\/td><\/tr><\/table><\/div>","<div class='scrollableContainer'><table class=mapview-popup id='popup'><tr class='coord'><td><\/td><th><b>Feature ID <\/b><\/th><td>20 <\/td><\/tr><tr><td>1<\/td><th>GEOID <\/th><td>41007 <\/td><\/tr><tr><td>2<\/td><th>NAME <\/th><td>Clatsop County, Oregon <\/td><\/tr><tr><td>3<\/td><th>variable <\/th><td>ed_attain <\/td><\/tr><tr><td>4<\/td><th>estimate <\/th><td> 30595 <\/td><\/tr><tr><td>5<\/td><th>moe <\/th><td>234 <\/td><\/tr><tr><td>6<\/td><th>geometry <\/th><td>sfc_MULTIPOLYGON <\/td><\/tr><\/table><\/div>","<div class='scrollableContainer'><table class=mapview-popup id='popup'><tr class='coord'><td><\/td><th><b>Feature ID <\/b><\/th><td>21 <\/td><\/tr><tr><td>1<\/td><th>GEOID <\/th><td>41065 <\/td><\/tr><tr><td>2<\/td><th>NAME <\/th><td>Wasco County, Oregon <\/td><\/tr><tr><td>3<\/td><th>variable <\/th><td>ed_attain <\/td><\/tr><tr><td>4<\/td><th>estimate <\/th><td> 18770 <\/td><\/tr><tr><td>5<\/td><th>moe <\/th><td>169 <\/td><\/tr><tr><td>6<\/td><th>geometry <\/th><td>sfc_MULTIPOLYGON <\/td><\/tr><\/table><\/div>","<div class='scrollableContainer'><table class=mapview-popup id='popup'><tr class='coord'><td><\/td><th><b>Feature ID <\/b><\/th><td>22 <\/td><\/tr><tr><td>1<\/td><th>GEOID <\/th><td>41017 <\/td><\/tr><tr><td>2<\/td><th>NAME <\/th><td>Deschutes County, Oregon <\/td><\/tr><tr><td>3<\/td><th>variable <\/th><td>ed_attain <\/td><\/tr><tr><td>4<\/td><th>estimate <\/th><td>147063 <\/td><\/tr><tr><td>5<\/td><th>moe <\/th><td>295 <\/td><\/tr><tr><td>6<\/td><th>geometry <\/th><td>sfc_MULTIPOLYGON <\/td><\/tr><\/table><\/div>","<div class='scrollableContainer'><table class=mapview-popup id='popup'><tr class='coord'><td><\/td><th><b>Feature ID <\/b><\/th><td>23 <\/td><\/tr><tr><td>1<\/td><th>GEOID <\/th><td>41067 <\/td><\/tr><tr><td>2<\/td><th>NAME <\/th><td>Washington County, Oregon <\/td><\/tr><tr><td>3<\/td><th>variable <\/th><td>ed_attain <\/td><\/tr><tr><td>4<\/td><th>estimate <\/th><td>417204 <\/td><\/tr><tr><td>5<\/td><th>moe <\/th><td>123 <\/td><\/tr><tr><td>6<\/td><th>geometry <\/th><td>sfc_MULTIPOLYGON <\/td><\/tr><\/table><\/div>","<div class='scrollableContainer'><table class=mapview-popup id='popup'><tr class='coord'><td><\/td><th><b>Feature ID <\/b><\/th><td>24 <\/td><\/tr><tr><td>1<\/td><th>GEOID <\/th><td>41071 <\/td><\/tr><tr><td>2<\/td><th>NAME <\/th><td>Yamhill County, Oregon <\/td><\/tr><tr><td>3<\/td><th>variable <\/th><td>ed_attain <\/td><\/tr><tr><td>4<\/td><th>estimate <\/th><td> 73347 <\/td><\/tr><tr><td>5<\/td><th>moe <\/th><td>272 <\/td><\/tr><tr><td>6<\/td><th>geometry <\/th><td>sfc_MULTIPOLYGON <\/td><\/tr><\/table><\/div>","<div class='scrollableContainer'><table class=mapview-popup id='popup'><tr class='coord'><td><\/td><th><b>Feature ID <\/b><\/th><td>25 <\/td><\/tr><tr><td>1<\/td><th>GEOID <\/th><td>41063 <\/td><\/tr><tr><td>2<\/td><th>NAME <\/th><td>Wallowa County, Oregon <\/td><\/tr><tr><td>3<\/td><th>variable <\/th><td>ed_attain <\/td><\/tr><tr><td>4<\/td><th>estimate <\/th><td> 5608 <\/td><\/tr><tr><td>5<\/td><th>moe <\/th><td> 60 <\/td><\/tr><tr><td>6<\/td><th>geometry <\/th><td>sfc_MULTIPOLYGON <\/td><\/tr><\/table><\/div>","<div class='scrollableContainer'><table class=mapview-popup id='popup'><tr class='coord'><td><\/td><th><b>Feature ID <\/b><\/th><td>26 <\/td><\/tr><tr><td>1<\/td><th>GEOID <\/th><td>41049 <\/td><\/tr><tr><td>2<\/td><th>NAME <\/th><td>Morrow County, Oregon <\/td><\/tr><tr><td>3<\/td><th>variable <\/th><td>ed_attain <\/td><\/tr><tr><td>4<\/td><th>estimate <\/th><td> 7712 <\/td><\/tr><tr><td>5<\/td><th>moe <\/th><td> 45 <\/td><\/tr><tr><td>6<\/td><th>geometry <\/th><td>sfc_MULTIPOLYGON <\/td><\/tr><\/table><\/div>","<div class='scrollableContainer'><table class=mapview-popup id='popup'><tr class='coord'><td><\/td><th><b>Feature ID <\/b><\/th><td>27 <\/td><\/tr><tr><td>1<\/td><th>GEOID <\/th><td>41037 <\/td><\/tr><tr><td>2<\/td><th>NAME <\/th><td>Lake County, Oregon <\/td><\/tr><tr><td>3<\/td><th>variable <\/th><td>ed_attain <\/td><\/tr><tr><td>4<\/td><th>estimate <\/th><td> 6130 <\/td><\/tr><tr><td>5<\/td><th>moe <\/th><td>108 <\/td><\/tr><tr><td>6<\/td><th>geometry <\/th><td>sfc_MULTIPOLYGON <\/td><\/tr><\/table><\/div>","<div class='scrollableContainer'><table class=mapview-popup id='popup'><tr class='coord'><td><\/td><th><b>Feature ID <\/b><\/th><td>28 <\/td><\/tr><tr><td>1<\/td><th>GEOID <\/th><td>41057 <\/td><\/tr><tr><td>2<\/td><th>NAME <\/th><td>Tillamook County, Oregon <\/td><\/tr><tr><td>3<\/td><th>variable <\/th><td>ed_attain <\/td><\/tr><tr><td>4<\/td><th>estimate <\/th><td> 20699 <\/td><\/tr><tr><td>5<\/td><th>moe <\/th><td>136 <\/td><\/tr><tr><td>6<\/td><th>geometry <\/th><td>sfc_MULTIPOLYGON <\/td><\/tr><\/table><\/div>","<div class='scrollableContainer'><table class=mapview-popup id='popup'><tr class='coord'><td><\/td><th><b>Feature ID <\/b><\/th><td>29 <\/td><\/tr><tr><td>1<\/td><th>GEOID <\/th><td>41027 <\/td><\/tr><tr><td>2<\/td><th>NAME <\/th><td>Hood River County, Oregon <\/td><\/tr><tr><td>3<\/td><th>variable <\/th><td>ed_attain <\/td><\/tr><tr><td>4<\/td><th>estimate <\/th><td> 16735 <\/td><\/tr><tr><td>5<\/td><th>moe <\/th><td>127 <\/td><\/tr><tr><td>6<\/td><th>geometry <\/th><td>sfc_MULTIPOLYGON <\/td><\/tr><\/table><\/div>","<div class='scrollableContainer'><table class=mapview-popup id='popup'><tr class='coord'><td><\/td><th><b>Feature ID <\/b><\/th><td>30 <\/td><\/tr><tr><td>1<\/td><th>GEOID <\/th><td>41059 <\/td><\/tr><tr><td>2<\/td><th>NAME <\/th><td>Umatilla County, Oregon <\/td><\/tr><tr><td>3<\/td><th>variable <\/th><td>ed_attain <\/td><\/tr><tr><td>4<\/td><th>estimate <\/th><td> 52883 <\/td><\/tr><tr><td>5<\/td><th>moe <\/th><td> 93 <\/td><\/tr><tr><td>6<\/td><th>geometry <\/th><td>sfc_MULTIPOLYGON <\/td><\/tr><\/table><\/div>","<div class='scrollableContainer'><table class=mapview-popup id='popup'><tr class='coord'><td><\/td><th><b>Feature ID <\/b><\/th><td>31 <\/td><\/tr><tr><td>1<\/td><th>GEOID <\/th><td>41041 <\/td><\/tr><tr><td>2<\/td><th>NAME <\/th><td>Lincoln County, Oregon <\/td><\/tr><tr><td>3<\/td><th>variable <\/th><td>ed_attain <\/td><\/tr><tr><td>4<\/td><th>estimate <\/th><td> 39183 <\/td><\/tr><tr><td>5<\/td><th>moe <\/th><td>147 <\/td><\/tr><tr><td>6<\/td><th>geometry <\/th><td>sfc_MULTIPOLYGON <\/td><\/tr><\/table><\/div>","<div class='scrollableContainer'><table class=mapview-popup id='popup'><tr class='coord'><td><\/td><th><b>Feature ID <\/b><\/th><td>32 <\/td><\/tr><tr><td>1<\/td><th>GEOID <\/th><td>41009 <\/td><\/tr><tr><td>2<\/td><th>NAME <\/th><td>Columbia County, Oregon <\/td><\/tr><tr><td>3<\/td><th>variable <\/th><td>ed_attain <\/td><\/tr><tr><td>4<\/td><th>estimate <\/th><td> 38085 <\/td><\/tr><tr><td>5<\/td><th>moe <\/th><td>175 <\/td><\/tr><tr><td>6<\/td><th>geometry <\/th><td>sfc_MULTIPOLYGON <\/td><\/tr><\/table><\/div>","<div class='scrollableContainer'><table class=mapview-popup id='popup'><tr class='coord'><td><\/td><th><b>Feature ID <\/b><\/th><td>33 <\/td><\/tr><tr><td>1<\/td><th>GEOID <\/th><td>41069 <\/td><\/tr><tr><td>2<\/td><th>NAME <\/th><td>Wheeler County, Oregon <\/td><\/tr><tr><td>3<\/td><th>variable <\/th><td>ed_attain <\/td><\/tr><tr><td>4<\/td><th>estimate <\/th><td> 1101 <\/td><\/tr><tr><td>5<\/td><th>moe <\/th><td>100 <\/td><\/tr><tr><td>6<\/td><th>geometry <\/th><td>sfc_MULTIPOLYGON <\/td><\/tr><\/table><\/div>","<div class='scrollableContainer'><table class=mapview-popup id='popup'><tr class='coord'><td><\/td><th><b>Feature ID <\/b><\/th><td>34 <\/td><\/tr><tr><td>1<\/td><th>GEOID <\/th><td>41029 <\/td><\/tr><tr><td>2<\/td><th>NAME <\/th><td>Jackson County, Oregon <\/td><\/tr><tr><td>3<\/td><th>variable <\/th><td>ed_attain <\/td><\/tr><tr><td>4<\/td><th>estimate <\/th><td>160008 <\/td><\/tr><tr><td>5<\/td><th>moe <\/th><td>224 <\/td><\/tr><tr><td>6<\/td><th>geometry <\/th><td>sfc_MULTIPOLYGON <\/td><\/tr><\/table><\/div>","<div class='scrollableContainer'><table class=mapview-popup id='popup'><tr class='coord'><td><\/td><th><b>Feature ID <\/b><\/th><td>35 <\/td><\/tr><tr><td>1<\/td><th>GEOID <\/th><td>41053 <\/td><\/tr><tr><td>2<\/td><th>NAME <\/th><td>Polk County, Oregon <\/td><\/tr><tr><td>3<\/td><th>variable <\/th><td>ed_attain <\/td><\/tr><tr><td>4<\/td><th>estimate <\/th><td> 57222 <\/td><\/tr><tr><td>5<\/td><th>moe <\/th><td>237 <\/td><\/tr><tr><td>6<\/td><th>geometry <\/th><td>sfc_MULTIPOLYGON <\/td><\/tr><\/table><\/div>","<div class='scrollableContainer'><table class=mapview-popup id='popup'><tr class='coord'><td><\/td><th><b>Feature ID <\/b><\/th><td>36 <\/td><\/tr><tr><td>1<\/td><th>GEOID <\/th><td>41011 <\/td><\/tr><tr><td>2<\/td><th>NAME <\/th><td>Coos County, Oregon <\/td><\/tr><tr><td>3<\/td><th>variable <\/th><td>ed_attain <\/td><\/tr><tr><td>4<\/td><th>estimate <\/th><td> 48945 <\/td><\/tr><tr><td>5<\/td><th>moe <\/th><td>172 <\/td><\/tr><tr><td>6<\/td><th>geometry <\/th><td>sfc_MULTIPOLYGON <\/td><\/tr><\/table><\/div>"],{"maxWidth":800,"minWidth":50,"autoPan":true,"keepInView":false,"closeButton":true,"closeOnClick":true,"className":""},["1","2","3","4","5","6","7","8","9","10","11","12","13","14","15","16","17","18","19","20","21","22","23","24","25","26","27","28","29","30","31","32","33","34","35","36"],{"interactive":false,"permanent":false,"direction":"auto","opacity":1,"offset":[0,0],"textsize":"10px","textOnly":false,"className":"","sticky":true},{"stroke":true,"weight":1,"opacity":0.9,"fillOpacity":0.84,"bringToFront":false,"sendToBack":false}]},{"method":"addScaleBar","args":[{"maxWidth":100,"metric":true,"imperial":true,"updateWhenIdle":true,"position":"bottomleft"}]},{"method":"addHomeButton","args":[-124.566244,41.991794,-116.463504,46.290834,true,"cnty","Zoom to cnty","<strong> cnty <\/strong>","bottomright"]},{"method":"addLayersControl","args":[["CartoDB.Positron","CartoDB.DarkMatter","OpenStreetMap","Esri.WorldImagery","OpenTopoMap"],"cnty",{"collapsed":true,"autoZIndex":true,"position":"topleft"}]},{"method":"addLegend","args":[{"colors":["#6666FF"],"labels":["cnty"],"na_color":null,"na_label":"NA","opacity":1,"position":"topright","type":"factor","title":"","extra":null,"layerId":null,"className":"info legend","group":"cnty"}]}],"limits":{"lat":[41.991794,46.290834],"lng":[-124.566244,-116.463504]},"fitBounds":[41.991794,-124.566244,46.290834,-116.463504,[]]},"evals":[],"jsHooks":{"render":[{"code":"function(el, x, data) {\n return (\n function(el, x, data) {\n // get the leaflet map\n var map = this; //HTMLWidgets.find('#' + el.id);\n // we need a new div element because we have to handle\n // the mouseover output separately\n // debugger;\n function addElement () {\n // generate new div Element\n var newDiv = $(document.createElement('div'));\n // append at end of leaflet htmlwidget container\n $(el).append(newDiv);\n //provide ID and style\n newDiv.addClass('lnlt');\n newDiv.css({\"position\":\"relative\",\"bottomleft\":\"0px\",\"background-color\":\"rgba(255, 255, 255, 0.7)\",\"box-shadow\":\"0 0 2px #bbb\",\"background-clip\":\"padding-box\",\"margin\":\"0\",\"padding-left\":\"5px\",\"padding-right\":\"5px\",\"color\":\"#333\",\"font-size\":\"9px\",\"font-family\":\"\\\"Helvetica Neue\\\", Arial, Helvetica, sans-serif\",\"text-align\":\"left\",\"z-index\":\"700\"});\n return newDiv;\n }\n\n\n // check for already existing lnlt class to not duplicate\n var lnlt = $(el).find('.lnlt');\n\n if(!lnlt.length) {\n lnlt = addElement();\n\n // grab the special div we generated in the beginning\n // and put the mousmove output there\n\n map.on('mousemove', function (e) {\n if (e.originalEvent.ctrlKey) {\n if (document.querySelector('.lnlt') === null) lnlt = addElement();\n lnlt.text(\n ' lon: ' + (e.latlng.lng).toFixed(5) +\n ' | lat: ' + (e.latlng.lat).toFixed(5) +\n ' | zoom: ' + map.getZoom() +\n ' | x: ' + L.CRS.EPSG3857.project(e.latlng).x.toFixed(0) +\n ' | y: ' + L.CRS.EPSG3857.project(e.latlng).y.toFixed(0) +\n ' | epsg: 3857 ' +\n ' | proj4: +proj=merc +a=6378137 +b=6378137 +lat_ts=0.0 +lon_0=0.0 +x_0=0.0 +y_0=0 +k=1.0 +units=m +nadgrids=@null +no_defs ');\n } else {\n if (document.querySelector('.lnlt') === null) lnlt = addElement();\n lnlt.text(\n ' lon: ' + (e.latlng.lng).toFixed(5) +\n ' | lat: ' + (e.latlng.lat).toFixed(5) +\n ' | zoom: ' + map.getZoom() + ' ');\n }\n });\n\n // remove the lnlt div when mouse leaves map\n map.on('mouseout', function (e) {\n var strip = document.querySelector('.lnlt');\n if( strip !==null) strip.remove();\n });\n\n };\n\n //$(el).keypress(67, function(e) {\n map.on('preclick', function(e) {\n if (e.originalEvent.ctrlKey) {\n if (document.querySelector('.lnlt') === null) lnlt = addElement();\n lnlt.text(\n ' lon: ' + (e.latlng.lng).toFixed(5) +\n ' | lat: ' + (e.latlng.lat).toFixed(5) +\n ' | zoom: ' + map.getZoom() + ' ');\n var txt = document.querySelector('.lnlt').textContent;\n console.log(txt);\n //txt.innerText.focus();\n //txt.select();\n setClipboardText('\"' + txt + '\"');\n }\n });\n\n }\n ).call(this.getMap(), el, x, data);\n}","data":null},{"code":"function(el, x, data) {\n return (function(el,x,data){\n var map = this;\n\n map.on('keypress', function(e) {\n console.log(e.originalEvent.code);\n var key = e.originalEvent.code;\n if (key === 'KeyE') {\n var bb = this.getBounds();\n var txt = JSON.stringify(bb);\n console.log(txt);\n\n setClipboardText('\\'' + txt + '\\'');\n }\n })\n }).call(this.getMap(), el, x, data);\n}","data":null}]}}</script> --- ``` r mapview(cnty, zcol = "estimate") ``` <div class="leaflet html-widget html-fill-item" id="htmlwidget-a7e682097f07deeb507a" style="width:720px;height:504px;"></div> <script type="application/json" data-for="htmlwidget-a7e682097f07deeb507a">{"x":{"options":{"minZoom":1,"maxZoom":52,"crs":{"crsClass":"L.CRS.EPSG3857","code":null,"proj4def":null,"projectedBounds":null,"options":{}},"preferCanvas":false,"bounceAtZoomLimits":false,"maxBounds":[[[-90,-370]],[[90,370]]]},"calls":[{"method":"addProviderTiles","args":["CartoDB.Positron","CartoDB.Positron","CartoDB.Positron",{"errorTileUrl":"","noWrap":false,"detectRetina":false,"pane":"tilePane"}]},{"method":"addProviderTiles","args":["CartoDB.DarkMatter","CartoDB.DarkMatter","CartoDB.DarkMatter",{"errorTileUrl":"","noWrap":false,"detectRetina":false,"pane":"tilePane"}]},{"method":"addProviderTiles","args":["OpenStreetMap","OpenStreetMap","OpenStreetMap",{"errorTileUrl":"","noWrap":false,"detectRetina":false,"pane":"tilePane"}]},{"method":"addProviderTiles","args":["Esri.WorldImagery","Esri.WorldImagery","Esri.WorldImagery",{"errorTileUrl":"","noWrap":false,"detectRetina":false,"pane":"tilePane"}]},{"method":"addProviderTiles","args":["OpenTopoMap","OpenTopoMap","OpenTopoMap",{"errorTileUrl":"","noWrap":false,"detectRetina":false,"pane":"tilePane"}]},{"method":"createMapPane","args":["polygon",420]},{"method":"addPolygons","args":[[[[{"lng":[-124.041983,-124.038842,-124.036998,-124.037333,-124.036177,-124.037047,-124.035796,-124.036828,-124.035718,-124.032309,-124.030212,-124.028557,-124.026168,-124.02306,-124.021521,-124.02036,-124.017488,-124.016251,-124.013345,-124.013057,-124.011666,-124.009651,-124.00863,-124.008668,-124.009216,-124.010968,-124.012825,-124.009457,-124.009174,-124.009677,-124.011005,-124.011699,-124.013664,-124.014611,-124.014517,-124.013606,-124.012236,-124.010703,-124.008608,-124.002891,-124.002003,-124.001625,-124.001851,-124.003591,-124.004475,-124.003935,-124.003052,-124.001535,-124.001159,-124.001334,-124.005436,-124.005753,-124.005121,-124.002827,-124.002402,-124.001225,-124.001127,-124.002893,-124.002819,-124.001629,-124.00144,-124.002248,-124.003139,-124.004173,-124.005541,-124.006863,-124.009244,-124.011544,-124.010456,-124.008695,-124.005475,-124.001195,-123.99878,-123.997493,-123.995531,-123.993419,-123.990256,-123.988482,-123.986415,-123.981442,-123.978035,-123.972758,-123.969199,-123.967916,-123.964007,-123.961176,-123.958133,-123.952541,-123.949711,-123.947539,-123.945943,-123.941841,-123.938921,-123.93669,-123.934826,-123.932984,-123.929368,-123.928109,-123.92617,-123.923228,-123.919321,-123.917355,-123.915768,-123.913158,-123.910798,-123.908023,-123.904993,-123.902759,-123.900611,-123.897998,-123.89549,-123.894213,-123.890657,-123.888662,-123.885746,-123.886257,-123.884898,-123.885552,-123.884731,-123.879821,-123.880309,-123.875256,-123.876929,-123.876055,-123.878426,-123.879224,-123.878488,-123.875677,-123.875902,-123.874554,-123.875128,-123.87338,-123.872161,-123.870714,-123.871196,-123.868406,-123.865843,-123.865356,-123.863521,-123.861708,-123.854798,-123.855219,-123.856672,-123.859311,-123.860844,-123.859671,-123.860305,-123.858754,-123.857235,-123.855639,-123.853474,-123.853456,-123.850036,-123.850134,-123.849517,-123.850178,-123.849663,-123.846549,-123.841223,-123.840861,-123.835668,-123.830315,-123.830469,-123.82926,-123.829275,-123.828393,-123.828618,-123.827067,-123.824234,-123.821583,-123.82086,-123.819403,-123.818972,-123.81985,-123.821526,-123.824264,-123.828568,-123.831689,-123.831264,-123.779962,-123.774581,-123.773716,-123.773833,-123.772341,-123.770488,-123.768483,-123.769127,-123.766875,-123.765268,-123.764535,-123.762886,-123.761074,-123.760665,-123.759135,-123.758186,-123.757263,-123.754795,-123.756231,-123.75543,-123.7545,-123.749533,-123.747579,-123.744373,-123.741852,-123.739398,-123.737502,-123.737944,-123.736506,-123.735183,-123.735421,-123.734322,-123.733021,-123.730022,-123.729321,-123.727794,-123.725276,-123.72218,-123.720119,-123.72034,-123.718719,-123.716492,-123.716505,-123.701384,-123.696843,-123.697,-123.687089,-123.687082,-123.677206,-123.677275,-123.581699,-123.581862,-123.571814,-123.571728,-123.566777,-123.567036,-123.562086,-123.562168,-123.542433,-123.542539,-123.523444,-123.494414,-123.494304,-123.484693,-123.465261,-123.465271,-123.455304,-123.455213,-123.445456,-123.444922,-123.431052,-123.425687,-123.425721,-123.406299,-123.406341,-123.4014,-123.401297,-123.400242,-123.371999,-123.371581,-123.36665,-123.366666,-123.347048,-123.328588,-123.328626,-123.309162,-123.309197,-123.274283,-123.27426,-123.249328,-123.249209,-123.229619,-123.229581,-123.229526,-123.229676,-123.229545,-123.229271,-123.229284,-123.229402,-123.229761,-123.229901,-123.2299,-123.229851,-123.229167,-123.231093,-123.230951,-123.230969,-123.231001,-123.23111258448,-123.245561,-123.344311064432,-123.346955,-123.44467,-123.474991,-123.517910995163,-123.518734,-123.530013873107,-123.569305,-123.624022,-123.631514798612,-123.657212,-123.728169,-123.787501,-123.811708,-123.822037891998,-123.820663,-123.818981,-123.818161,-123.821615,-123.824441,-123.826343,-123.828843,-123.829295,-123.827502,-123.827325,-123.830213,-123.832066,-123.833287,-123.834613,-123.83615,-123.83774,-123.838592,-123.838849,-123.839529,-123.839963,-123.840068,-123.840103,-123.837541,-123.83653,-123.837496,-123.837574,-123.836151,-123.841723,-123.844471,-123.845386,-123.845611,-123.847758,-123.848952,-123.84909,-123.848497,-123.846851,-123.843151,-123.840693,-123.840683,-123.840118,-123.838574,-123.838755,-123.840893,-123.841559,-123.840227,-123.834601,-123.834302,-123.834173,-123.830968,-123.829397,-123.827264,-123.828112,-123.826921,-123.8271,-123.825624,-123.824877,-123.82251,-123.821973,-123.82572,-123.829528,-123.829967,-123.830979,-123.831124,-123.832155,-123.835422,-123.836688,-123.838249,-123.840156,-123.840149,-123.83883,-123.839241,-123.842828,-123.846258,-123.850176,-123.854857,-123.856075,-123.858549,-123.857192,-123.85591,-123.855572,-123.853382,-123.85081,-123.849528,-123.844724,-123.842871,-123.840232,-123.836854,-123.827684,-123.826311,-123.823911,-123.822386,-123.821199,-123.820841,-123.817915,-123.815726,-123.812603,-123.814793,-123.814536,-123.815092,-123.813199,-123.813505,-123.816316,-123.81719,-123.821288,-123.820857,-123.821531,-123.820407,-123.820471,-123.818915,-123.816794,-123.813891,-123.812417,-123.811361,-123.808307,-123.805991,-123.802202,-123.799931,-123.797063,-123.796702,-123.793144,-123.790462,-123.791154,-123.792834,-123.793288,-123.793075,-123.794003,-123.79252,-123.7922,-123.796383,-123.798159,-123.79962,-123.803515,-123.805938,-123.809421,-123.812203,-123.810017,-123.811604,-123.811992,-123.813816,-123.815251,-123.814997,-123.817359,-123.820847,-123.822177,-123.823743,-123.82382,-123.826159,-123.825742,-123.825321,-123.828031,-123.829732,-123.830947,-123.832684,-123.832956,-123.835287,-123.838419,-123.836606,-123.837879,-123.83972,-123.843007,-123.843557,-123.847315,-123.847595,-123.847483,-123.845404,-123.844167,-123.841454,-123.839496,-123.8417,-123.845982,-123.84557,-123.849054,-123.851287,-123.853846,-123.856118,-123.857646,-123.859863,-123.863558,-123.864168,-123.866394,-123.869582,-123.871462,-123.871837,-123.87318,-123.875264,-123.87675,-123.876337,-123.878927,-123.878522,-123.877858,-123.877852,-123.878816,-123.884467,-123.884354,-123.888026,-123.891321,-123.892651,-123.895094,-123.897208,-123.900219,-123.903527,-123.907007,-123.910437,-123.915017,-123.916606,-123.920408,-123.923302,-123.924437,-123.925893,-123.928303,-123.930195,-123.933213,-123.93467,-123.935313,-123.936538,-123.940407,-123.944632,-123.94959,-123.953011,-123.956029,-123.962628,-123.966661,-123.970015,-123.972898,-123.978917,-123.984686,-123.986317,-123.990456,-123.992913,-123.995141,-123.998549,-124.008637,-124.010986,-124.017452,-124.01908,-124.021961,-124.026947,-124.028712,-124.030141,-124.032262,-124.033565,-124.036265,-124.036171,-124.035001,-124.035489,-124.037266,-124.03726,-124.038584,-124.039586,-124.041579,-124.041983],"lat":[42.387656,42.388837,42.392623,42.393818,42.394949,42.395766,42.396407,42.398726,42.401762,42.403283,42.402883,42.403308,42.407409,42.407621,42.408194,42.410041,42.410959,42.412176,42.412677,42.413114,42.416175,42.418034,42.419622,42.420822,42.421399,42.421801,42.423994,42.426465,42.427216,42.427851,42.428504,42.429269,42.430707,42.432342,42.434189,42.435068,42.437069,42.439908,42.441928,42.443527,42.444308,42.445291,42.44602,42.447785,42.451153,42.451543,42.451972,42.453402,42.453976,42.455054,42.458572,42.461239,42.462041,42.462667,42.46302,42.464829,42.467382,42.47166,42.473912,42.477902,42.480858,42.48466,42.485828,42.486682,42.487376,42.488828,42.489421,42.489628,42.494019,42.496147,42.496918,42.496875,42.499962,42.500694,42.500832,42.499599,42.501621,42.501979,42.498353,42.497167,42.49761,42.49535,42.496028,42.497228,42.49732,42.498816,42.498238,42.499311,42.500487,42.500474,42.501334,42.500867,42.50113,42.500293,42.497079,42.496023,42.496048,42.494563,42.494335,42.495021,42.494737,42.495798,42.495396,42.496146,42.497435,42.496903,42.499165,42.499584,42.498416,42.499058,42.498997,42.499925,42.500538,42.502978,42.504233,42.505436,42.506279,42.507625,42.508401,42.509885,42.511588,42.51372,42.516203,42.516799,42.519959,42.522047,42.524647,42.526195,42.527805,42.528675,42.530067,42.531188,42.533372,42.534203,42.535158,42.536341,42.539031,42.541989,42.542232,42.544375,42.549736,42.551791,42.553775,42.556281,42.559989,42.562393,42.563091,42.564143,42.566509,42.567228,42.569663,42.570941,42.574579,42.57809,42.579542,42.581966,42.583353,42.586258,42.587864,42.588961,42.591633,42.595067,42.598106,42.599452,42.601793,42.604497,42.606107,42.607046,42.607575,42.60913,42.611139,42.612446,42.614786,42.615779,42.619743,42.622398,42.625339,42.625798,42.632313,42.694025,42.700429,42.700834,42.702858,42.704493,42.704685,42.705989,42.708063,42.709109,42.711145,42.713543,42.715028,42.715876,42.717138,42.717906,42.720093,42.720584,42.72596,42.728067,42.731791,42.732339,42.742038,42.742576,42.746335,42.747987,42.751499,42.753118,42.757294,42.760655,42.762842,42.764575,42.765701,42.768945,42.771115,42.773041,42.773809,42.774115,42.775435,42.77747,42.780911,42.782694,42.784061,42.739658,42.739703,42.739593,42.753907,42.753789,42.750274,42.750145,42.739682,42.73992,42.732149,42.732098,42.735716,42.735693,42.72483,42.724796,42.717574,42.717122,42.709832,42.709186,42.70918,42.702248,42.702168,42.702942,42.699297,42.699406,42.702982,42.703025,42.711122,42.710928,42.711039,42.714483,42.713966,42.710288,42.710297,42.724958,42.724951,42.724955,42.739484,42.739471,42.732194,42.732226,42.73175,42.728247,42.728412,42.732055,42.73203,42.724712,42.724404,42.702421,42.70261,42.668065,42.626212,42.551766,42.495623,42.429362,42.420299,42.355665,42.312847,42.290816,42.287434,42.280466,42.128331,42.128069,42.098876,42.082066,42.004931,42.0039324384249,42.003364,41.9993825981084,41.999276,42.000608,42.000661,42.0007581373596,42.00076,42.0007301112694,42.000626,41.99977,41.998714371006,41.995094,41.997056,41.995834,41.995194,41.9956172960188,41.996727,41.998563,41.998791,41.999935,42.000564,42.00188,42.002504,42.004951,42.006535,42.008438,42.011552,42.011666,42.012042,42.012811,42.013911,42.01489,42.015304,42.016469,42.01704,42.017586,42.018098,42.018736,42.020306,42.024006,42.025558,42.02734,42.029292,42.031385,42.03336,42.036426,42.03699,42.040136,42.043009,42.045069,42.046646,42.047798,42.048965,42.051934,42.05248,42.055504,42.057618,42.057965,42.058515,42.059225,42.060507,42.063187,42.063791,42.066002,42.068955,42.069596,42.072475,42.073675,42.074796,42.077493,42.080498,42.084441,42.085321,42.086567,42.093188,42.097285,42.100377,42.101345,42.103609,42.107914,42.10885,42.109619,42.113334,42.116779,42.119291,42.122593,42.124671,42.125599,42.125204,42.126945,42.130628,42.133224,42.135116,42.137426,42.138323,42.141392,42.143597,42.144503,42.145819,42.146369,42.149668,42.152913,42.154378,42.155855,42.157509,42.157656,42.159333,42.161167,42.163027,42.16438,42.166047,42.169651,42.170464,42.172501,42.174122,42.178235,42.183987,42.185435,42.188225,42.189849,42.190924,42.193959,42.195498,42.198974,42.2036,42.203769,42.20573,42.212667,42.214644,42.217284,42.216849,42.215738,42.216388,42.218962,42.219878,42.22111,42.220457,42.222173,42.224314,42.22781,42.230098,42.231155,42.233619,42.237623,42.237497,42.238232,42.240204,42.239436,42.241176,42.241494,42.24399,42.24779,42.251246,42.253495,42.254797,42.259439,42.262603,42.264096,42.264665,42.264365,42.266983,42.268693,42.270973,42.271824,42.276123,42.279255,42.279859,42.281652,42.282991,42.285622,42.286277,42.288537,42.290556,42.294693,42.296282,42.297656,42.298507,42.299219,42.301983,42.303538,42.305638,42.307854,42.310752,42.312202,42.313281,42.316923,42.318327,42.319125,42.320577,42.320742,42.319933,42.318688,42.31854,42.32046,42.321478,42.322362,42.322796,42.324799,42.327455,42.327633,42.330071,42.330669,42.333167,42.335279,42.341049,42.342428,42.344851,42.345667,42.346072,42.347602,42.351454,42.353095,42.353293,42.351422,42.350937,42.349234,42.349314,42.347644,42.347884,42.346709,42.346592,42.346469,42.348835,42.351045,42.352008,42.352612,42.353759,42.354338,42.355761,42.35983,42.361625,42.360604,42.358058,42.356544,42.356991,42.357866,42.356714,42.35774,42.357324,42.357979,42.358505,42.358449,42.359409,42.357941,42.357659,42.358487,42.358488,42.359016,42.358541,42.35977,42.361384,42.36166,42.359199,42.361049,42.363636,42.365481,42.367455,42.3702,42.374389,42.375876,42.377858,42.380525,42.382673,42.383094,42.384751,42.385912,42.387656]}]],[[{"lng":[-118.232214,-118.193345,-118.193405,-118.152945,-118.152456,-118.132141,-118.132347,-118.112092,-118.112068,-118.092122,-118.092087,-118.087036,-118.087016,-118.071877,-118.071916,-118.051902,-118.051956,-118.031808,-118.031671,-118.011485,-118.011402,-117.971947,-117.971787,-117.87228,-117.851163,-117.749535,-117.631491,-117.608707,-117.590849,-117.590858,-117.56962,-117.569664,-117.52936,-117.529408,-117.509202,-117.509214,-117.486744,-117.487014,-117.405264,-117.30419,-117.220060553639,-117.220069,-117.222451,-117.222647,-117.216974,-117.198559149539,-117.198147,-117.193129,-117.170342,-117.15706,-117.143394,-117.138523,-117.133984,-117.133104,-117.13253,-117.130904,-117.121037,-117.118018,-117.111617,-117.107673,-117.104208,-117.102242,-117.098531,-117.09457,-117.093578,-117.090933,-117.089503,-117.07835,-117.074191882813,-117.067284,-117.059352,-117.05651,-117.05303,-117.050057,-117.047399154136,-117.047062,-117.045513,-117.042283,-117.03585,-117.031862,-117.027558,-117.025277,-117.020231,-117.016921,-117.015868756715,-117.008000996386,-117.003682330068,-117.001,-116.98687,-116.983658939347,-116.981825336926,-116.981589778363,-116.978570032446,-116.975905,-116.973542,-116.972828624351,-116.971958,-116.972110100178,-116.972537,-116.973991,-116.973945,-116.970365,-116.970219,-116.9726,-116.973701,-116.971675,-116.967259,-116.965498,-116.949516444006,-116.947591,-116.945256,-116.940534,-116.939296726739,-116.935443,-116.925392,-116.924028,-116.915738,-116.902752,-116.900103,-116.895757,-116.895028421445,-116.894083,-116.894309,-116.895931,-116.897846346997,-116.900834,-116.901737,-116.901922,-116.903327,-116.911218,-116.913239,-116.91376,-116.914236,-116.916410383599,-116.918991,-116.925642,-116.929069,-116.929442,-116.927688,-116.928306,-116.933704,-116.937750474425,-116.937835,-116.940005494001,-116.940274509534,-116.943132,-116.957009,-116.967203,-116.974253,-116.977351,-116.976979427494,-116.9745725227,-116.974016,-116.973185,-116.972504,-116.972045557891,-116.956246,-116.955741432932,-116.955694238564,-116.950573662942,-116.943361,-116.937342,-116.937261403083,-116.935696297006,-116.935592015008,-116.934719940664,-116.934485,-116.935911,-116.941458,-116.941734972941,-116.943742,-116.94321505163,-116.94242,-116.935847,-116.935584,-116.938195,-116.942757,-116.959871,-116.968743,-116.973435,-116.97618,-116.975525,-116.973807,-116.971556,-116.97088,-116.968634,-116.966314,-116.961683,-116.959206,-116.959808,-116.97049,-116.972331,-116.971574,-116.964915,-116.961264,-116.960415,-116.96177,-116.962251,-116.964292,-116.968214,-116.969028,-116.968955773782,-116.968931,-116.967641,-116.961806,-116.959993,-116.959363,-116.958752,-116.962615,-116.972362,-116.97958,-116.981919,-116.980250760831,-116.979961,-116.978564231043,-116.977332,-116.976429,-116.976694,-116.9765,-116.976114,-116.97617647824,-116.98384,-116.98371442608,-116.983199584669,-116.982214,-116.982347,-116.98294,-116.984152,-116.991415,-116.999061,-117.008691316809,-117.01077,-117.020035,-117.021604961574,-117.021721,-117.019853,-117.014828,-117.010701,-117.010383,-117.012831,-117.016826,-117.021461,-117.025156,-117.031887,-117.032881,-117.027931,-117.023577,-117.02155,-117.022110809539,-117.023049,-117.024020777413,-117.026634,-117.026651,-117.026841,-117.026725,-117.026825,-117.026696659314,-117.026586,-117.026624495654,-117.026717,-117.026661,-117.026705,-117.026905,-117.027001,-117.026937,-117.026789,-117.02676,-117.026824,-117.026889,-117.026922,-117.026774,-117.026746,-117.026745350468,-117.026743821013,-117.02674059016,-117.026719331236,-117.026701376309,-117.026652,-117.026683,-117.026253,-117.026303,-117.026331,-117.026665,-117.026631374451,-117.026575021601,-117.026551,-117.026129,-117.026195,-117.02659,-117.026098,-117.026197,-117.040906,-117.04891,-117.055402,-117.068613,-117.197798,-117.217551,-117.403613,-117.443062,-117.506681810353,-117.530197396566,-117.613207836252,-117.6171880341,-117.623731,-117.625973,-117.705780984811,-117.737792142868,-117.873467,-118.123944939374,-118.197189,-118.197369215928,-118.196857,-118.195281,-118.214698,-118.216384,-118.216832,-118.228793,-118.228673,-118.228683,-118.228618,-118.228069,-118.232011,-118.232178,-118.232171,-118.232392,-118.231731,-118.230291,-118.228107,-118.227645,-118.228541,-118.228843,-118.233908,-118.232214],"lat":[44.256129,44.2562,44.270708,44.270684,44.299509,44.299483,44.31431,44.314271,44.328754,44.328734,44.343208,44.343184,44.357646,44.357562,44.372009,44.372004,44.390032,44.389953,44.415192,44.415169,44.429615,44.429296,44.443849,44.443511,44.444045,44.444136,44.444427,44.444661,44.444573,44.43013,44.430062,44.415678,44.415722,44.401329,44.401461,44.387143,44.387246,44.300317,44.301044,44.301462,44.3014040000001,44.301382,44.298963,44.297578,44.288357,44.2741460602673,44.273828,44.270963,44.25889,44.25749,44.258262,44.25937,44.262972,44.264236,44.267045,44.269453,44.277585,44.278945,44.280667,44.280763,44.27994,44.278799,44.275533,44.270978,44.269383,44.260311,44.258234,44.249885,44.2476774328148,44.24401,44.237244,44.230874,44.229076,44.22883,44.2296393340327,44.229742,44.232005,44.242775,44.246805,44.248635,44.248881,44.248505,44.246063,44.245391,44.2453906695423,44.2453881986673,44.2453868423874,44.245386,44.245477,44.2447059354583,44.2442656367649,44.244209072634,44.2434839480557,44.242844,44.23998,44.2380420862255,44.235677,44.2349306846191,44.232836,44.229821,44.225932,44.221221,44.217493,44.2132,44.208017,44.197256,44.194581,44.194126,44.191571735564,44.191264,44.191677,44.19371,44.1937712439328,44.193962,44.191544,44.18844,44.183152,44.179467,44.176851,44.171267,44.1664463691315,44.160191,44.158114,44.154295,44.1526558411174,44.150099,44.14862,44.145931,44.144422,44.139992,44.132929,44.128381,44.127304,44.125462976158,44.123278,44.118929,44.113972,44.112621,44.109438,44.107326,44.100039,44.0970063481431,44.096943,44.0957616644886,44.0956152473123,44.09406,44.091743,44.090936,44.088295,44.085364,44.081832,44.0589530528064,44.053663,44.049425,44.048771,44.0486051115188,44.042888,44.0426043694783,44.0425778402732,44.0396994290017,44.035645,44.029376,44.0291467346366,44.0246946460507,44.0243980062902,44.0219173103878,44.021249,44.012652,44.007431,44.0069165870337,44.003189,44.0016934551559,43.999437,43.990875,43.986874,43.98459,43.984043,43.982925,43.977477,43.977085,43.974719,43.973091,43.972187,43.970112,43.968302,43.968412,43.968884,43.968168,43.96636,43.963815,43.959764,43.958357,43.956964,43.956301,43.956,43.954564,43.952149,43.948097,43.944286,43.941881,43.939921,43.9377512350526,43.937007,43.934792,43.932797,43.93065,43.927739,43.923246,43.91748,43.916453,43.915253,43.912478,43.9094192775191,43.908888,43.9072537431298,43.905812,43.901293,43.900361,43.897128,43.894759,43.8946464890304,43.880846,43.8801032140428,43.8770578606079,43.871228,43.86884,43.86771,43.866794,43.863864,43.864637,43.8626893878893,43.862269,43.858956,43.8563729196878,43.856182,43.853833,43.852172,43.849754,43.844803,43.840001,43.839962,43.841694,43.841334,43.834156,43.830025,43.826286,43.823811,43.819402,43.8173218792265,43.813842,43.8122882404094,43.80811,43.733935,43.732905,43.714815,43.706193,43.6937391205206,43.683001,43.6808035152354,43.675523,43.664385,43.631659,43.62488,43.621032,43.617614,43.610669,43.601912,43.600357,43.596033,43.593632,43.578674,43.577526,43.5737089790098,43.5647210211312,43.5457346710279,43.420805024449,43.3152915591549,43.025128,43.024876,42.807447,42.80717,42.807015,42.624878,42.5522229216117,42.4304607260049,42.378557,42.357193,42.166404,42.133258,42.117647,41.99989,41.99989,41.998983,41.99989,42.000035,42.00038,41.999887,41.99929,41.999659,41.9992392555284,41.9990841067272,41.9985364286855,41.9985101685311,41.998467,41.998102,41.9981771341869,41.9982072706744,41.998335,41.9972981831054,41.996995,41.9969940811635,42.135279,42.275813,42.275891,42.805902,42.914703,42.914625,43.042817,43.086086,43.096791,43.348964,43.348959,43.43565,43.436775,43.612266,43.779216,43.779207,43.779195,44.039862,44.183239,44.21255,44.212548,44.256129]}]],[[{"lng":[-118.51944,-118.518181,-118.516539,-118.513679,-118.509705,-118.507765,-118.505765,-118.501794,-118.499774,-118.498457,-118.498373,-118.498161,-118.497865,-118.497422,-118.496787,-118.496583,-118.496169,-118.495729,-118.495257,-118.492404,-118.491292,-118.488174,-118.483704,-118.480904,-118.476922,-118.473427,-118.470581,-118.468284,-118.464244,-118.461528,-118.460802,-118.461866,-118.460487,-118.459157,-118.45227,-118.445862,-118.443456,-118.440003,-118.437712,-118.435673,-118.433707,-118.432064,-118.43182,-118.425086,-118.422747,-118.419381,-118.419907,-118.418247,-118.418867,-118.417419,-118.413647,-118.403611,-118.40025,-118.395839,-118.393659,-118.394052,-118.391656,-118.391704,-118.387177,-118.387277,-118.385176,-118.383321,-118.383411,-118.381491,-118.379786,-118.376666,-118.372775,-118.367621,-118.365587,-118.361673,-118.358121,-118.35243,-118.350798,-118.346502,-118.343374,-118.339207,-118.336355,-118.332304,-118.329785,-118.325783,-118.321741,-118.319306,-118.316347,-118.311639,-118.306628,-118.305462,-118.302565,-118.300094,-118.29877,-118.296443,-118.294194,-118.292079,-118.289862,-118.285439,-118.286743,-118.286281,-118.286739,-118.288299,-118.289351,-118.28984,-118.287422,-118.286294,-118.28311,-118.283385,-118.284994,-118.290151,-118.292122,-118.294094,-118.294019,-118.293393,-118.294383,-118.299459,-118.298355,-118.296578,-118.2978,-118.298077,-118.296548,-118.294827,-118.295068,-118.296269,-118.300975,-118.303366,-118.304572,-118.307522,-118.307233,-118.308837,-118.311173,-118.310056,-118.30847,-118.308421,-118.313907,-118.317934,-118.3187,-118.314454,-118.312281,-118.309246,-118.306817,-118.306764,-118.302862,-118.29906,-118.293566,-118.294909,-118.294716,-118.296234,-118.295659,-118.289794,-118.2872,-118.283489,-118.279179,-118.2759,-118.267786,-118.264012,-118.261829,-118.258237,-118.253802,-118.246533,-118.242499,-118.24055,-118.236861,-118.23518,-118.228076,-118.227459,-118.22816,-118.228056,-118.224904,-118.226627,-118.229972,-118.230979,-118.232402,-118.231462,-118.235329,-118.236369,-118.235589,-118.235656,-118.234808,-118.236831,-118.237399,-118.235115,-118.232795,-118.229421,-118.227791,-118.231634,-118.232128,-118.231337,-118.22828,-118.226561,-118.226727,-118.225709,-118.223449,-118.226449,-118.227547,-118.229663,-118.233636,-118.23623,-118.237322,-118.24161,-118.244382,-118.245043,-118.24364,-118.244533,-118.243553,-118.244662,-118.245136,-118.232197,-118.232165,-118.232658,-118.231806,-118.229691,-118.228047,-118.227421,-118.225462,-118.223739,-118.223192,-118.220371,-118.220763,-118.219197,-118.217081,-118.213869,-118.213634,-118.214731,-118.212772,-118.213478,-118.213556,-118.212459,-118.21246,-118.214497,-118.214184,-118.211519,-118.209168,-118.206973,-118.203838,-118.201486,-118.200232,-118.197174,-118.194901,-118.192549,-118.184709,-118.178908,-118.17687,-118.175223,-118.172167,-118.169815,-118.166758,-118.164484,-118.161036,-118.156488,-118.155076,-118.15578,-118.154916,-118.148405,-118.142367,-118.140876,-118.140482,-118.141185,-118.139929,-118.138203,-118.137729,-118.136551,-118.130351,-118.128407,-118.126328,-118.11925,-118.115495,-118.110422,-118.108962,-118.10804,-118.102659,-118.100661,-118.098817,-118.096972,-118.094052,-118.09213,-118.091286,-118.089673,-118.088982,-118.086523,-118.080456,-118.077997,-118.074772,-118.0717,-118.06955,-118.064404,-118.063637,-118.060105,-118.057584,-118.051814,-118.046279,-118.044232,-118.041949,-118.037125,-118.032237,-118.028283,-118.022745,-118.016228,-118.009949,-118.007344,-118.006843,-118.00333,-118.000318,-117.998992,-117.993112,-117.990182,-117.985755,-117.982631,-117.977728,-117.975378,-117.97216,-117.968688,-117.965211,-117.958124,-117.956183,-117.952633,-117.950925,-117.9477,-117.946243,-117.944977,-117.942835,-117.940522,-117.937296,-117.93636,-117.933931,-117.931873,-117.928321,-117.92723,-117.925714,-117.921696,-117.922093,-117.920378,-117.918603,-117.917634,-117.917055,-117.915266,-117.914198,-117.913393,-117.912473,-117.911901,-117.906142,-117.903603,-117.901443,-117.900497,-117.896386,-117.897252,-117.894074,-117.894708,-117.890515,-117.890152,-117.886506,-117.885732,-117.888408,-117.885361,-117.88527,-117.884041,-117.881163,-117.873396,-117.873734,-117.871887,-117.870438,-117.868648,-117.862058,-117.859832,-117.858127,-117.853788,-117.850462,-117.850204,-117.84343,-117.842069,-117.84433,-117.844909,-117.841727,-117.83989,-117.83775,-117.837244,-117.840601,-117.840934,-117.838224,-117.834022,-117.828819,-117.827377,-117.827784,-117.818062,-117.814507,-117.81202,-117.810347,-117.810499,-117.812384,-117.810901,-117.813232,-117.812501,-117.809642,-117.807106,-117.805679,-117.80439,-117.803943,-117.805343,-117.803614,-117.802486,-117.804671,-117.803038,-117.801591,-117.799102,-117.798106,-117.799062,-117.797076,-117.796519,-117.795212,-117.793418,-117.794612,-117.797179,-117.795811,-117.793905,-117.793626,-117.795624,-117.794825,-117.795976,-117.793112,-117.794182,-117.791738,-117.790617,-117.786109,-117.784715,-117.781825,-117.77942,-117.778664,-117.778261,-117.780449,-117.784287,-117.784223,-117.784917,-117.78438,-117.779549,-117.777504,-117.747664,-117.564033,-117.563402,-117.563486,-117.381873,-117.379472,-117.368183,-117.313239,-117.266005,-117.091719,-117.022673,-117.022673,-116.783771926572,-116.78371,-116.797329,-116.808576,-116.814589,-116.826133,-116.842731,-116.847944,-116.845847,-116.844796,-116.844625,-116.846103,-116.856754,-116.858313,-116.856964,-116.85226,-116.848093,-116.844323,-116.841971,-116.839031,-116.834915,-116.830505,-116.826271,-116.829329,-116.836449,-116.847888,-116.850737,-116.846461,-116.835702,-116.832176,-116.833632,-116.838467,-116.842108,-116.846061,-116.850512,-116.852427,-116.857038,-116.865338,-116.871701,-116.876001,-116.878183,-116.879375,-116.883598,-116.887748,-116.889882,-116.892361,-116.895805,-116.898153,-116.898609,-116.896424,-116.896249,-116.898388,-116.899640878328,-116.900069,-116.900146,-116.901051,-116.905771,-116.920498,-116.928099,-116.931099,-116.933699,-116.933799,-116.933099,-116.9308,-116.9307,-116.9318,-116.9347,-116.9368,-116.949001,-116.966801,-116.970902,-116.972902,-116.977802,-116.986502,-116.992003,-116.998903,-117.006045,-117.013802,-117.016216,-117.018418,-117.021398,-117.02942,-117.031738,-117.03827,-117.039549,-117.044217,-117.046250547549,-117.04782,-117.048178,-117.050495,-117.05856,-117.062273,-117.060454,-117.061799,-117.063824,-117.072221,-117.074137,-117.07912,-117.07871,-117.079483004572,-117.080555,-117.080772,-117.079835603761,-117.078574,-117.079031,-117.081022,-117.081286739531,-117.086075,-117.091223,-117.095868,-117.096791,-117.094968,-117.098221,-117.108231,-117.114754,-117.117809,-117.120522,-117.125267,-117.124754,-117.126009,-117.133963,-117.138066,-117.14248,-117.146032,-117.148255,-117.147934,-117.14293,-117.144161,-117.149242,-117.152406,-117.161033,-117.167187,-117.181583,-117.185386,-117.189759,-117.19163,-117.191329,-117.192494,-117.194317,-117.200237,-117.208936,-117.211148,-117.216372,-117.221479026379,-117.224104,-117.225076,-117.225932,-117.225758,-117.224445,-117.221548,-117.217015,-117.215573,-117.214637,-117.215072,-117.218285,-117.225461,-117.22698,-117.234835,-117.242675,-117.243027,-117.235117,-117.227938,-117.216911,-117.210587,-117.206962,-117.197339,-117.196149,-117.189769,-117.189842,-117.191546,-117.192203,-117.203323,-117.2055,-117.21521,-117.216795,-117.217843,-117.220060553639,-117.30419,-117.405264,-117.487014,-117.486744,-117.509214,-117.509202,-117.529408,-117.52936,-117.569664,-117.56962,-117.590858,-117.590849,-117.608707,-117.631491,-117.749535,-117.851163,-117.87228,-117.971787,-117.971947,-118.011402,-118.011485,-118.031671,-118.031808,-118.051956,-118.051902,-118.071916,-118.071877,-118.087016,-118.087036,-118.092087,-118.092122,-118.112068,-118.112092,-118.132347,-118.132141,-118.152456,-118.152945,-118.193405,-118.193345,-118.232214,-118.23217,-118.354122,-118.354145,-118.447185,-118.497499,-118.49732,-118.500117,-118.498411,-118.497321,-118.496152,-118.49507,-118.490468,-118.488681,-118.486512,-118.484647,-118.482345,-118.481412,-118.48124,-118.478727,-118.478595,-118.474848,-118.47266,-118.467883,-118.469096,-118.46887,-118.461061,-118.458579,-118.457563,-118.456729,-118.452455,-118.447799,-118.440356,-118.436986,-118.43437,-118.435357,-118.433621,-118.432384,-118.433579,-118.433813,-118.432812,-118.430374,-118.420455,-118.413314,-118.410955,-118.407612,-118.40889,-118.409774,-118.413703,-118.417555,-118.421329,-118.422586,-118.424394,-118.428326,-118.428483,-118.427067,-118.425493,-118.431707,-118.43501,-118.434932,-118.435954,-118.434853,-118.434066,-118.431147,-118.430919,-118.428322,-118.429108,-118.42895,-118.422418,-118.422102,-118.423597,-118.420684,-118.418457,-118.420366,-118.420601,-118.421545,-118.422173,-118.421542,-118.420911,-118.419336,-118.418155,-118.41351,-118.411069,-118.408786,-118.405392,-118.402845,-118.398703,-118.394593,-118.39201,-118.388293,-118.386097,-118.383108,-118.380034,-118.378302,-118.376741,-118.375367,-118.372852,-118.36939,-118.367973,-118.36514,-118.360732,-118.36231,-118.36365,-118.367042,-118.362312,-118.357986,-118.360667,-118.363427,-118.365086,-118.364615,-118.366115,-118.367772,-118.370202,-118.372863,-118.373195,-118.374563,-118.373523,-118.374509,-118.374236,-118.371346,-118.368806,-118.371036,-118.370803,-118.372225,-118.37153,-118.369628,-118.365535,-118.364066,-118.359224,-118.358417,-118.356315,-118.354205,-118.354821,-118.352379,-118.351025,-118.349305,-118.346739,-118.347966,-118.347614,-118.346234,-118.346866,-118.345607,-118.343872,-118.343274,-118.337886,-118.337408,-118.334252,-118.332254,-118.328495,-118.327739,-118.32617,-118.323526,-118.322737,-118.31982,-118.317296,-118.31769,-118.315482,-118.316873,-118.314069,-118.315622,-118.310984,-118.311222,-118.308934,-118.306961,-118.305777,-118.305778,-118.309328,-118.311696,-118.311853,-118.309704,-118.312564,-118.314537,-118.316589,-118.319431,-118.329297,-118.333246,-118.336404,-118.337588,-118.338852,-118.338063,-118.341934,-118.342567,-118.341699,-118.341779,-118.344374,-118.342194,-118.342172,-118.343208,-118.343684,-118.353557,-118.354824,-118.355851,-118.360273,-118.362249,-118.36454,-118.368572,-118.3711,-118.372365,-118.375037,-118.377906,-118.379855,-118.386038,-118.38634,-118.388087,-118.391024,-118.393181,-118.399942,-118.402581,-118.403639,-118.404947,-118.410214,-118.41088,-118.412928,-118.414113,-118.417036,-118.41909,-118.422329,-118.425197,-118.429638,-118.432342,-118.433626,-118.436806,-118.438184,-118.441788,-118.446702,-118.451401,-118.453139,-118.456063,-118.460962,-118.463113,-118.472734,-118.473527,-118.47732,-118.48214,-118.485639,-118.488713,-118.493278,-118.497947,-118.500889,-118.504435,-118.504437,-118.507257,-118.507077,-118.50892,-118.510957,-118.511088,-118.512691,-118.513986,-118.517591,-118.518688,-118.51765,-118.51749,-118.516452,-118.519174,-118.51944],"lat":[44.705886,44.706081,44.704765,44.7061,44.706237,44.708903,44.709331,44.708664,44.709055,44.710619,44.710678,44.710958,44.711163,44.711339,44.711606,44.711729,44.712027,44.712425,44.712865,44.713621,44.712393,44.710944,44.71003,44.710035,44.709199,44.705289,44.704,44.705666,44.706374,44.707521,44.708948,44.710861,44.712657,44.715774,44.719166,44.723436,44.724173,44.722886,44.721547,44.721555,44.720729,44.721091,44.719766,44.718554,44.719488,44.718693,44.721846,44.722776,44.724884,44.726986,44.727122,44.724808,44.72647,44.726005,44.727872,44.728998,44.731398,44.734328,44.735949,44.737389,44.739093,44.738868,44.740717,44.742041,44.744357,44.745249,44.745628,44.747213,44.747126,44.745474,44.745573,44.744738,44.743996,44.743912,44.744444,44.743944,44.742609,44.742467,44.74358,44.74162,44.74151,44.742082,44.743986,44.744241,44.74528,44.746949,44.747643,44.746025,44.746248,44.74698,44.746564,44.747389,44.749868,44.750975,44.754323,44.757123,44.759278,44.762708,44.763371,44.765439,44.767165,44.767331,44.77072,44.772211,44.773003,44.77925,44.780412,44.784664,44.787259,44.787936,44.790167,44.796442,44.798705,44.799211,44.800259,44.802979,44.807807,44.809344,44.813191,44.816164,44.816426,44.81733,44.818712,44.819407,44.821148,44.821229,44.823236,44.824802,44.828794,44.830613,44.832422,44.834937,44.836274,44.838066,44.840039,44.841107,44.843855,44.846614,44.848153,44.850451,44.853018,44.856606,44.859376,44.862086,44.863043,44.866421,44.865367,44.865007,44.866271,44.866573,44.869386,44.866412,44.866013,44.863351,44.864851,44.864071,44.863165,44.862344,44.86166,44.862587,44.865544,44.867783,44.870332,44.872332,44.875568,44.878634,44.882349,44.887149,44.891028,44.894063,44.897046,44.898643,44.901367,44.902902,44.904173,44.906927,44.908385,44.91053,44.911514,44.913854,44.918361,44.921531,44.923482,44.924687,44.926032,44.930012,44.931409,44.933778,44.93691,44.939575,44.939778,44.941695,44.940104,44.941213,44.942695,44.943198,44.94431,44.945198,44.950096,44.951086,44.956525,44.958396,44.960686,44.960686,44.963285,44.966976,44.969921,44.97237,44.973481,44.976652,44.977488,44.979158,44.981549,44.983722,44.984888,44.987447,44.988505,44.989174,44.990567,44.991343,44.995073,44.996519,44.999353,45.00108,45.005306,45.006585,45.007421,45.008201,45.010094,45.010203,45.01232,45.013155,45.015104,45.015325,45.017329,45.017997,45.019389,45.017995,45.019389,45.019388,45.017105,45.017161,45.016103,45.016657,45.015711,45.017883,45.018775,45.020442,45.022278,45.026728,45.027725,45.02945,45.031677,45.033844,45.035513,45.036458,45.040018,45.040799,45.045024,45.045214,45.044444,45.044761,45.045162,45.046962,45.046801,45.046198,45.045602,45.044347,45.044892,45.04233,45.042327,45.041238,45.038568,45.036878,45.033716,45.032029,45.025648,45.024723,45.021068,45.019598,45.016873,45.015179,45.014088,45.012924,45.012569,45.012785,45.00991,45.006868,45.006961,45.004007,45.003881,45.003403,45.001635,45.000595,44.997644,44.997415,44.996376,44.99484,44.994876,44.994348,44.994448,44.99525,44.99459,44.995409,44.994951,44.995873,44.99617,44.995908,44.997626,45.000621,45.000952,45.002967,45.004881,45.006582,45.006698,45.006667,45.008418,45.009324,45.012767,45.0125,45.014081,45.013626,45.015197,45.016787,45.016939,45.019079,45.020889,45.023006,45.024485,45.024736,45.025357,45.026033,45.026847,45.027236,45.028207,45.028008,45.030232,45.033156,45.034604,45.036321,45.037917,45.039581,45.043706,45.04524,45.047569,45.048706,45.049436,45.051089,45.0571,45.056709,45.058249,45.060095,45.059622,45.060713,45.065639,45.064703,45.060146,45.05758,45.054525,45.055712,45.059753,45.060443,45.060351,45.059736,45.058477,45.057026,45.056057,45.054797,45.054096,45.055136,45.055138,45.052819,45.051643,45.050658,45.04804,45.042113,45.037596,45.035472,45.033314,45.025909,45.024491,45.024511,45.025607,45.026711,45.027532,45.028808,45.030655,45.032274,45.032445,45.031655,45.032832,45.032625,45.031851,45.029481,45.030495,45.029705,45.028184,45.02718,45.02915,45.029284,45.028164,45.026766,45.026679,45.025335,45.026273,45.025795,45.023959,45.023925,45.02278,45.023142,45.022058,45.021648,45.020454,45.018489,45.018583,45.016682,45.016317,45.014854,45.013987,45.014289,45.013583,45.01143,45.009631,45.007621,45.005572,45.003714,44.999668,44.998322,44.995675,44.995244,44.992161,44.992426,44.992866,45.036118,45.079446,45.079997,45.079993,45.080569,45.080581,45.08057,45.080158,45.079734,45.079167,45.078265731912,45.076972,45.060267,45.050652,45.048106,45.037285,45.029446,45.022602,45.01847,45.015312,45.001435,44.999878,44.984298,44.978761,44.975173,44.972527,44.971906,44.974879,44.980758,44.983992,44.985756,44.98458,44.982493,44.975173,44.969239,44.964768,44.958113,44.951521,44.940633,44.931373,44.928976,44.923601,44.914922,44.905249,44.893523,44.887577,44.880769,44.870599,44.867613,44.866684,44.864706,44.861793,44.858268,44.855799,44.855171,44.855218,44.855752,44.854319,44.851985,44.849733,44.84833,44.84228,44.8406075080495,44.840036,44.836672,44.83568,44.834794,44.81438,44.808381,44.804781,44.798781,44.796781,44.794481,44.790981,44.789881,44.787181,44.783881,44.782881,44.777981,44.775181,44.773881,44.772581,44.767981,44.762381,44.759182,44.756382,44.756024,44.756841,44.755572,44.751942,44.750785,44.751102,44.74986,44.748179,44.746483,44.74514,44.7431132252987,44.741549,44.735916,44.732477,44.730265,44.727143,44.721668,44.706654,44.703623,44.700517,44.696374,44.692175,44.690084,44.6886720621095,44.686714,44.684161,44.6825280578776,44.680328,44.677676,44.673685,44.6735859256969,44.671794,44.668807,44.664737,44.657385,44.652011,44.640689,44.62711,44.624883,44.620139,44.614658,44.593818,44.583834,44.581553,44.57524,44.572996,44.57143,44.568603,44.564371,44.562143,44.557236,44.545647,44.536151,44.531802,44.525166,44.523431,44.52296,44.519261,44.513385,44.509886,44.506784,44.503272,44.499884,44.492027,44.485661,44.485359,44.48616,44.4845576143306,44.483734,44.482346,44.479389,44.477223,44.473884,44.470146,44.459042,44.453746,44.44803,44.427162,44.420664,44.407729,44.405583,44.399669,44.396548,44.390974,44.373853,44.367975,44.360163,44.357703,44.355206,44.347406,44.346362,44.336585,44.335007,44.329621,44.32863,44.313024,44.311789,44.309116,44.308236,44.30718,44.3014040000001,44.301462,44.301044,44.300317,44.387246,44.387143,44.401461,44.401329,44.415722,44.415678,44.430062,44.43013,44.444573,44.444661,44.444427,44.444136,44.444045,44.443511,44.443849,44.429296,44.429615,44.415169,44.415192,44.389953,44.390032,44.372004,44.372009,44.357562,44.357646,44.343184,44.343208,44.328734,44.328754,44.314271,44.31431,44.299483,44.299509,44.270684,44.270708,44.2562,44.256129,44.257343,44.256824,44.255384,44.255211,44.255248,44.277036,44.277057,44.278536,44.28383,44.287046,44.288546,44.289246,44.294188,44.297932,44.302617,44.304536,44.306626,44.309518,44.313051,44.315917,44.318331,44.319045,44.322048,44.325517,44.334584,44.336551,44.340343,44.344848,44.346428,44.349406,44.350716,44.350936,44.352126,44.353977,44.356125,44.359247,44.362848,44.364889,44.368133,44.36914,44.369882,44.371744,44.373543,44.373036,44.370845,44.372909,44.378619,44.380988,44.383807,44.385782,44.388993,44.391195,44.394126,44.394828,44.397454,44.398748,44.39858,44.397508,44.399426,44.401907,44.403825,44.407153,44.4088,44.40997,44.411717,44.414309,44.416737,44.421752,44.423503,44.426207,44.428179,44.432468,44.438442,44.443008,44.444531,44.448984,44.453439,44.455072,44.456766,44.455921,44.454282,44.452872,44.452648,44.454457,44.456458,44.457777,44.457882,44.456869,44.458337,44.458504,44.45974,44.462276,44.461433,44.45958,44.459231,44.462786,44.466172,44.466621,44.469162,44.471699,44.474066,44.474856,44.478912,44.480101,44.484385,44.485906,44.488219,44.491714,44.493629,44.496334,44.498025,44.502494,44.50479,44.506397,44.507891,44.509207,44.512089,44.514035,44.519056,44.521255,44.523791,44.526215,44.528638,44.531191,44.53281,44.538112,44.537216,44.536041,44.539108,44.541274,44.542545,44.545392,44.54759,44.548037,44.548608,44.550466,44.551086,44.553654,44.554977,44.556217,44.559716,44.560056,44.562544,44.567029,44.565182,44.564453,44.565112,44.563778,44.562207,44.56119,44.562368,44.564173,44.566543,44.567896,44.569192,44.570658,44.572539,44.575043,44.577082,44.581034,44.582581,44.585317,44.58605,44.587851,44.58881,44.589939,44.591181,44.592251,44.595679,44.597549,44.601609,44.603863,44.605442,44.608771,44.608374,44.610007,44.609502,44.61098,44.61249,44.616775,44.617901,44.618969,44.621341,44.625024,44.626656,44.628403,44.631204,44.631821,44.635601,44.639263,44.639377,44.637965,44.639769,44.639823,44.643038,44.643484,44.645121,44.646102,44.645905,44.64645,44.644419,44.642928,44.641555,44.643001,44.642871,44.643539,44.643381,44.641388,44.641444,44.643025,44.644169,44.644739,44.646543,44.647164,44.648687,44.652801,44.654828,44.653966,44.652595,44.652691,44.654376,44.653206,44.652451,44.650017,44.652859,44.653084,44.655396,44.656297,44.65559,44.656632,44.658729,44.66142,44.661871,44.663639,44.664484,44.663566,44.665698,44.665925,44.665556,44.669929,44.67433,44.675417,44.677878,44.679134,44.681049,44.684021,44.688532,44.690074,44.691562,44.692755,44.695931,44.702462,44.704031,44.705886]}]],[[{"lng":[-120.6535343441,-120.634968,-120.591166,-120.559465,-120.553317424253,-120.521964,-120.505863,-120.482362,-120.45309661514,-120.40396,-120.329057,-120.288656,-120.282156,-120.211474211014,-120.210754,-120.191103256744,-120.170453,-120.141352,-120.07015,-120.0550751063,-120.001148,-119.999501176112,-119.998161,-119.998172,-119.999242,-120.004783,-120.004859,-120.004752,-120.005124,-120.005565,-120.006555,-119.897751,-119.882346,-119.882356,-119.883914,-119.759759,-119.760731,-119.790831,-119.790699,-119.850941,-119.876525,-119.910536,-119.91054,-120.000045,-120.005372,-120.028785,-120.086479,-120.128661,-120.131926,-120.309328,-120.49516,-120.495748,-120.494548,-120.503733,-120.504449,-120.508549,-120.512249,-120.51485,-120.51005,-120.506864,-120.50345,-120.50115,-120.498149,-120.494749,-120.491949,-120.486949,-120.482849,-120.479249,-120.476849,-120.470649,-120.468849,-120.468449,-120.467448,-120.464548,-120.462548,-120.463648,-120.463448,-120.461249,-120.460549,-120.461049,-120.458449,-120.458449,-120.460249,-120.463787,-120.465706,-120.46215,-120.46045,-120.45865,-120.45505,-120.453041,-120.450097,-120.44886,-120.45225,-120.457069,-120.46295,-120.464991,-120.466995,-120.475351,-120.476251,-120.476751,-120.476251,-120.474951,-120.471551,-120.468951,-120.468551,-120.469549,-120.472951,-120.476852,-120.480252,-120.483552,-120.484052,-120.482552,-120.480152,-120.476752,-120.473652,-120.472652,-120.474752,-120.480152,-120.483352,-120.485552,-120.487653,-120.487153,-120.482353,-120.481153,-120.480953,-120.481653,-120.484853,-120.48849,-120.493553,-120.497954,-120.502854,-120.506254,-120.509454,-120.516054,-120.519354,-120.521254,-120.520455,-120.521555,-120.524155,-120.529055,-120.531655,-120.532555,-120.534055,-120.536755,-120.540955,-120.541755,-120.543008,-120.542856,-120.540256,-120.537556,-120.533055,-120.529355,-120.527555,-120.524455,-120.523855,-120.524455,-120.525956,-120.528456,-120.530056,-120.534156,-120.540056,-120.541956,-120.544856,-120.545356,-120.543656,-120.541656,-120.542956,-120.544157,-120.546457,-120.550357,-120.551139,-120.550663,-120.552057,-120.556057,-120.554457,-120.550957,-120.542857,-120.540657,-120.535757,-120.534457,-120.533657,-120.535957,-120.538157,-120.541657,-120.544657,-120.547057,-120.546358,-120.545158,-120.541857,-120.540289,-120.540257,-120.541758,-120.542858,-120.547858,-120.549158,-120.553158,-120.555558,-120.553358,-120.547358,-120.544858,-120.543158,-120.542758,-120.544258,-120.546658,-120.547758,-120.548158,-120.545458,-120.542258,-120.540358,-120.538558,-120.537758,-120.536858,-120.534658,-120.531558,-120.527757,-120.524457,-120.524057,-120.524658,-120.525558,-120.531858,-120.538858,-120.540758,-120.540458,-120.538758,-120.530358,-120.527458,-120.528058,-120.527358,-120.529458,-120.535158,-120.539358,-120.541258,-120.539658,-120.534358,-120.531958,-120.530958,-120.530758,-120.531258,-120.530458,-120.531258,-120.532458,-120.533958,-120.541459,-120.543359,-120.543059,-120.540159,-120.535559,-120.533659,-120.533659,-120.530659,-120.531859,-120.534659,-120.534459,-120.532059,-120.527059,-120.524459,-120.523459,-120.524059,-120.521859,-120.516659,-120.514958,-120.513158,-120.512558,-120.513358,-120.515159,-120.522659,-120.529759,-120.532559,-120.532059,-120.530159,-120.528159,-120.525259,-120.523059,-120.518459,-120.519359,-120.528659,-120.527559,-120.525059,-120.519859,-120.514759,-120.509659,-120.507959,-120.506259,-120.502659,-120.501159,-120.498759,-120.495759,-120.492258,-120.489258,-120.484258,-120.482958,-120.484158,-120.489058,-120.494059,-120.502959,-120.506059,-120.506459,-120.505859,-120.501859,-120.501159,-120.493959,-120.492259,-120.486758,-120.483658,-120.482941,-120.484435,-120.487859,-120.492159,-120.496059,-120.496859,-120.495159,-120.493659,-120.489859,-120.483459,-120.481559,-120.482359,-120.486359,-120.489859,-120.491759,-120.493459,-120.495859,-120.490359,-120.483859,-120.481228,-120.477559,-120.472759,-120.46966,-120.462291,-120.459937,-120.45441,-120.449907,-120.446592,-120.441284,-120.438779,-120.43323,-120.429082,-120.422903,-120.421449,-120.416409,-120.409948,-120.407022,-120.407256,-120.411057,-120.412857,-120.417857,-120.420557,-120.423257,-120.424257,-120.423357,-120.426057,-120.426856,-120.422581,-120.414957,-120.409557,-120.405557,-120.399056,-120.394456,-120.386686,-120.382056,-120.377756,-120.373427,-120.367855,-120.365655,-120.364955,-120.363246,-120.360827,-120.359976,-120.360771,-120.364122,-120.365217,-120.367013,-120.370994,-120.376304,-120.377837,-120.379469,-120.380493,-120.380486,-120.376156,-120.375793,-120.372139,-120.369313,-120.365401,-120.359512,-120.357804,-120.35798,-120.359875,-120.365267,-120.372265,-120.377466,-120.381856,-120.384579,-120.385845,-120.386122,-120.388305,-120.390763,-120.392574,-120.401323,-120.402107,-120.405673,-120.407038,-120.407663,-120.407117,-120.404832,-120.402578,-120.402654,-120.404938,-120.40536,-120.408536,-120.409128,-120.408982,-120.409413,-120.410742,-120.411699,-120.416052,-120.421999,-120.426305,-120.428135,-120.432693,-120.438889,-120.444248,-120.446592,-120.446258,-120.444612,-120.439925,-120.438299,-120.440538,-120.44422,-120.449588,-120.452159,-120.453915,-120.45746,-120.459735,-120.464725,-120.46795,-120.46897,-120.47018,-120.469915,-120.472696,-120.477475,-120.478087,-120.477833,-120.479303,-120.481042,-120.484741,-120.486421,-120.485326,-120.482367,-120.480276,-120.479181,-120.47836,-120.478341,-120.479474,-120.479903,-120.48231,-120.48244,-120.485156,-120.489585,-120.491732,-120.492223,-120.492223,-120.489739,-120.488689,-120.488779,-120.490833,-120.493853,-120.496624,-120.498461,-120.499805,-120.506384,-120.508107,-120.510188,-120.513313,-120.515688,-120.517573,-120.520924,-120.524742,-120.528516,-120.531013,-120.535308,-120.539245,-120.544783,-120.547364,-120.549064,-120.551164,-120.552064,-120.553064,-120.556464,-120.558264,-120.560065,-120.566965,-120.567465,-120.569465,-120.572265,-120.574265,-120.577565,-120.583366,-120.587066,-120.593766,-120.600466,-120.602466,-120.603766,-120.603466,-120.604867,-120.606167,-120.609967,-120.612267,-120.618567,-120.624467,-120.629067,-120.631668,-120.635868,-120.638568,-120.640368,-120.643668,-120.646068,-120.646168,-120.649368,-120.649368,-120.6535343441],"lat":[45.7372486812962,45.745847,45.746547,45.738348,45.7336759670199,45.709848,45.700048,45.694449,45.6962407125498,45.699249,45.71105,45.72015,45.72125,45.725903582393,45.725951,45.7435045782538,45.761951,45.773152,45.785152,45.7909960828741,45.811902,45.8124817188485,45.687968,45.68439,45.517539,45.517157,45.502468,45.501959,45.385771,45.350553,45.257706,45.257017,45.256916,45.25596,45.169152,45.169211,45.081278,45.081253,45.067823,45.067783,45.067866,45.067928,45.066927,45.065591,45.065582,45.065224,45.065398,45.065453,45.067354,45.06779,45.068279,45.07005,45.07465,45.083477,45.08565,45.08725,45.09095,45.09465,45.10135,45.102778,45.10265,45.1041,45.10455,45.10575,45.10585,45.10435,45.10505,45.11015,45.11165,45.10855,45.10695,45.10285,45.10155,45.10015,45.10115,45.10375,45.10515,45.10865,45.11165,45.11625,45.11945,45.12065,45.12315,45.125985,45.130127,45.13505,45.13795,45.13885,45.13945,45.139253,45.140883,45.143185,45.14545,45.145483,45.14405,45.144196,45.146686,45.15105,45.15185,45.15415,45.15645,45.15775,45.15955,45.16215,45.16355,45.16494,45.16595,45.16835,45.16895,45.17025,45.17155,45.17235,45.17235,45.17325,45.17565,45.17765,45.17975,45.18015,45.17945,45.17955,45.18075,45.18365,45.18665,45.18895,45.19125,45.19335,45.19485,45.197233,45.19765,45.19575,45.19555,45.19615,45.19785,45.19925,45.20105,45.20265,45.20445,45.20535,45.20445,45.20475,45.20605,45.21065,45.21125,45.21115,45.209949,45.210349,45.212507,45.213649,45.217049,45.21785,45.21665,45.21635,45.21675,45.21885,45.22035,45.22255,45.22385,45.22465,45.22465,45.22325,45.219849,45.220249,45.222449,45.223949,45.228449,45.231949,45.235149,45.236649,45.237249,45.240849,45.242426,45.244146,45.246649,45.250449,45.252749,45.253349,45.253849,45.253255,45.25495,45.25585,45.25905,45.26185,45.262449,45.261649,45.261649,45.262949,45.267249,45.269049,45.271849,45.274864,45.276049,45.279049,45.279649,45.281049,45.281049,45.279649,45.281249,45.283249,45.284449,45.284449,45.285649,45.288049,45.291449,45.295549,45.296449,45.298349,45.302549,45.304549,45.304349,45.302749,45.297849,45.296349,45.295049,45.294749,45.295949,45.29915,45.30015,45.304049,45.305749,45.309049,45.309749,45.311549,45.314749,45.315849,45.317549,45.319149,45.320949,45.324249,45.328149,45.328449,45.327749,45.329349,45.330649,45.331449,45.331449,45.332249,45.335149,45.336549,45.339249,45.342049,45.343649,45.344149,45.345249,45.346049,45.347649,45.349949,45.351749,45.352949,45.358149,45.363849,45.366149,45.368449,45.370249,45.371249,45.371849,45.372549,45.373549,45.376849,45.377849,45.375749,45.375649,45.376849,45.378649,45.380649,45.381149,45.381849,45.380449,45.381549,45.383249,45.385449,45.386549,45.387249,45.388849,45.394649,45.396349,45.400349,45.403449,45.405249,45.405449,45.404349,45.405049,45.405749,45.407749,45.417249,45.418749,45.419049,45.418649,45.417349,45.416849,45.419249,45.420549,45.422849,45.426949,45.428249,45.427949,45.428249,45.430649,45.431749,45.433249,45.433999,45.434549,45.434249,45.434349,45.435549,45.438548,45.440716,45.442549,45.443649,45.444049,45.446949,45.450549,45.451849,45.453649,45.455349,45.456549,45.459549,45.461749,45.462449,45.462049,45.462649,45.465349,45.468949,45.470249,45.471983,45.472649,45.476149,45.476929,45.478808,45.480212,45.485194,45.485275,45.48369,45.478877,45.475768,45.472994,45.471716,45.469243,45.468017,45.468636,45.470332,45.473147,45.47445,45.48185,45.48255,45.48305,45.48285,45.48365,45.48605,45.49195,45.49395,45.49795,45.50051,45.49875,45.49825,45.49745,45.49695,45.49705,45.496787,45.49445,45.49295,45.493714,45.49525,45.49655,45.49725,45.501064,45.505691,45.508034,45.509832,45.51263,45.51424,45.515253,45.516641,45.518095,45.518166,45.519428,45.521584,45.523731,45.527588,45.528385,45.530644,45.531392,45.53113,45.530316,45.531459,45.533713,45.535359,45.537249,45.537733,45.537535,45.538808,45.541528,45.54431,45.546732,45.548723,45.549859,45.551701,45.554154,45.555641,45.556725,45.557779,45.559754,45.563101,45.565666,45.567051,45.569936,45.574605,45.576728,45.581893,45.583655,45.589052,45.592508,45.595318,45.596067,45.597026,45.597602,45.597164,45.597302,45.598438,45.602365,45.607454,45.613944,45.615692,45.618006,45.621291,45.622848,45.626112,45.627031,45.626584,45.62586,45.624286,45.622016,45.621577,45.619673,45.619321,45.620066,45.622829,45.624827,45.626368,45.627752,45.628747,45.630668,45.633047,45.634178,45.635036,45.637158,45.638269,45.639391,45.639181,45.639518,45.640653,45.642019,45.644858,45.645151,45.645166,45.645177,45.645171,45.643312,45.643504,45.648871,45.648977,45.651677,45.654794,45.654991,45.655946,45.656147,45.655522,45.655788,45.656275,45.661515,45.663944,45.665119,45.66596,45.66608,45.666867,45.667379,45.668983,45.671177,45.671899,45.671852,45.671165,45.669195,45.669048,45.670148,45.672548,45.677548,45.678348,45.679448,45.681648,45.682348,45.686048,45.690648,45.693748,45.695448,45.696048,45.698648,45.700048,45.701648,45.701548,45.702247,45.702847,45.704747,45.706647,45.713047,45.714547,45.715847,45.717847,45.721447,45.722047,45.721346,45.720646,45.721546,45.720846,45.721046,45.722346,45.723946,45.726146,45.730246,45.732947,45.7372486812962]}]],[[{"lng":[-124.323889,-124.323214,-124.322417,-124.321769,-124.321536,-124.32138,-124.321173,-124.321095,-124.321432,-124.322087,-124.322719,-124.323287,-124.323765,-124.323739,-124.32405,-124.323889],"lat":[42.066648,42.067318,42.067459,42.067305,42.066766,42.066016,42.065612,42.065034,42.064573,42.064226,42.064104,42.064124,42.064438,42.065188,42.065785,42.066648]}],[{"lng":[-124.427244,-124.426878,-124.426074,-124.425349,-124.424934,-124.42496,-124.424856,-124.425038,-124.425556,-124.426126,-124.42693,-124.427251,-124.427244],"lat":[42.314462,42.315107,42.315529,42.315299,42.314781,42.314091,42.313325,42.312826,42.312673,42.312596,42.312846,42.313704,42.314462]}],[{"lng":[-124.47709,-124.476357,-124.476278,-124.475922,-124.475545,-124.474892,-124.475088,-124.474951,-124.474793,-124.475644,-124.475862,-124.476397,-124.476971,-124.477268,-124.47709],"lat":[42.66717,42.667622,42.667957,42.668452,42.668554,42.668029,42.667505,42.666748,42.666384,42.665743,42.665495,42.665888,42.666151,42.666602,42.66717]}],[{"lng":[-124.564595,-124.560403,-124.556645,-124.552441,-124.549492,-124.548023,-124.544561,-124.545058,-124.54051,-124.53648,-124.534433,-124.536195,-124.534589,-124.530438,-124.528298,-124.525653,-124.500141,-124.480938,-124.479636362958,-124.438676,-124.434245,-124.415423,-124.41539,-124.296347,-124.269254,-124.258388,-124.258274,-124.253467,-124.253317,-124.243779,-124.24387,-124.239129,-124.239394,-124.219623,-124.219416,-124.209708,-124.209522,-124.214393,-124.214201,-124.204851,-124.204529,-124.199717,-124.199692,-124.189984,-124.189907,-124.185291,-124.18531,-124.180706,-124.180704,-124.161308,-124.160976,-124.161288,-124.162074,-124.156629,-124.156491,-124.151209,-124.151235,-124.146377,-124.146344,-124.141475,-124.141185,-124.160658,-124.160149,-124.164889,-124.164225,-124.164887,-124.160163,-124.159895,-124.159966,-124.138655,-124.138686,-124.138748,-124.132926,-124.132918,-124.128049,-124.128073,-124.119228,-124.1192,-124.089872,-124.089872,-124.070314,-123.996291,-123.996296,-123.976677,-123.976631,-123.956985,-123.957026,-123.937288,-123.937268,-123.925942,-123.925717,-123.868491,-123.868282,-123.84989,-123.849858,-123.811553,-123.808536,-123.806976,-123.803732,-123.800444,-123.800083,-123.799136,-123.796749,-123.796456,-123.795111,-123.7917,-123.789263,-123.783304,-123.780349,-123.778041,-123.773571,-123.76995,-123.766112,-123.764019,-123.761476,-123.759427,-123.756486,-123.754526,-123.752421,-123.750436,-123.746879,-123.743493,-123.741725,-123.740093,-123.739229,-123.735741,-123.734082,-123.732315,-123.726832,-123.723188,-123.720137,-123.716495,-123.716492,-123.718719,-123.72034,-123.720119,-123.72218,-123.725276,-123.727794,-123.729321,-123.730022,-123.733021,-123.734322,-123.735421,-123.735183,-123.736506,-123.737944,-123.737502,-123.739398,-123.741852,-123.744373,-123.747579,-123.749533,-123.7545,-123.75543,-123.756231,-123.754795,-123.757263,-123.758186,-123.759135,-123.760665,-123.761074,-123.762886,-123.764535,-123.765268,-123.766875,-123.769127,-123.768483,-123.770488,-123.772341,-123.773833,-123.773716,-123.774581,-123.779962,-123.831264,-123.831689,-123.828568,-123.824264,-123.821526,-123.81985,-123.818972,-123.819403,-123.82086,-123.821583,-123.824234,-123.827067,-123.828618,-123.828393,-123.829275,-123.82926,-123.830469,-123.830315,-123.835668,-123.840861,-123.841223,-123.846549,-123.849663,-123.850178,-123.849517,-123.850134,-123.850036,-123.853456,-123.853474,-123.855639,-123.857235,-123.858754,-123.860305,-123.859671,-123.860844,-123.859311,-123.856672,-123.855219,-123.854798,-123.861708,-123.863521,-123.865356,-123.865843,-123.868406,-123.871196,-123.870714,-123.872161,-123.87338,-123.875128,-123.874554,-123.875902,-123.875677,-123.878488,-123.879224,-123.878426,-123.876055,-123.876929,-123.875256,-123.880309,-123.879821,-123.884731,-123.885552,-123.884898,-123.886257,-123.885746,-123.888662,-123.890657,-123.894213,-123.89549,-123.897998,-123.900611,-123.902759,-123.904993,-123.908023,-123.910798,-123.913158,-123.915768,-123.917355,-123.919321,-123.923228,-123.92617,-123.928109,-123.929368,-123.932984,-123.934826,-123.93669,-123.938921,-123.941841,-123.945943,-123.947539,-123.949711,-123.952541,-123.958133,-123.961176,-123.964007,-123.967916,-123.969199,-123.972758,-123.978035,-123.981442,-123.986415,-123.988482,-123.990256,-123.993419,-123.995531,-123.997493,-123.99878,-124.001195,-124.005475,-124.008695,-124.010456,-124.011544,-124.009244,-124.006863,-124.005541,-124.004173,-124.003139,-124.002248,-124.00144,-124.001629,-124.002819,-124.002893,-124.001127,-124.001225,-124.002402,-124.002827,-124.005121,-124.005753,-124.005436,-124.001334,-124.001159,-124.001535,-124.003052,-124.003935,-124.004475,-124.003591,-124.001851,-124.001625,-124.002003,-124.002891,-124.008608,-124.010703,-124.012236,-124.013606,-124.014517,-124.014611,-124.013664,-124.011699,-124.011005,-124.009677,-124.009174,-124.009457,-124.012825,-124.010968,-124.009216,-124.008668,-124.00863,-124.009651,-124.011666,-124.013057,-124.013345,-124.016251,-124.017488,-124.02036,-124.021521,-124.02306,-124.026168,-124.028557,-124.030212,-124.032309,-124.035718,-124.036828,-124.035796,-124.037047,-124.036177,-124.037333,-124.036998,-124.038842,-124.041983,-124.041579,-124.039586,-124.038584,-124.03726,-124.037266,-124.035489,-124.035001,-124.036171,-124.036265,-124.033565,-124.032262,-124.030141,-124.028712,-124.026947,-124.021961,-124.01908,-124.017452,-124.010986,-124.008637,-123.998549,-123.995141,-123.992913,-123.990456,-123.986317,-123.984686,-123.978917,-123.972898,-123.970015,-123.966661,-123.962628,-123.956029,-123.953011,-123.94959,-123.944632,-123.940407,-123.936538,-123.935313,-123.93467,-123.933213,-123.930195,-123.928303,-123.925893,-123.924437,-123.923302,-123.920408,-123.916606,-123.915017,-123.910437,-123.907007,-123.903527,-123.900219,-123.897208,-123.895094,-123.892651,-123.891321,-123.888026,-123.884354,-123.884467,-123.878816,-123.877852,-123.877858,-123.878522,-123.878927,-123.876337,-123.87675,-123.875264,-123.87318,-123.871837,-123.871462,-123.869582,-123.866394,-123.864168,-123.863558,-123.859863,-123.857646,-123.856118,-123.853846,-123.851287,-123.849054,-123.84557,-123.845982,-123.8417,-123.839496,-123.841454,-123.844167,-123.845404,-123.847483,-123.847595,-123.847315,-123.843557,-123.843007,-123.83972,-123.837879,-123.836606,-123.838419,-123.835287,-123.832956,-123.832684,-123.830947,-123.829732,-123.828031,-123.825321,-123.825742,-123.826159,-123.82382,-123.823743,-123.822177,-123.820847,-123.817359,-123.814997,-123.815251,-123.813816,-123.811992,-123.811604,-123.810017,-123.812203,-123.809421,-123.805938,-123.803515,-123.79962,-123.798159,-123.796383,-123.7922,-123.79252,-123.794003,-123.793075,-123.793288,-123.792834,-123.791154,-123.790462,-123.793144,-123.796702,-123.797063,-123.799931,-123.802202,-123.805991,-123.808307,-123.811361,-123.812417,-123.813891,-123.816794,-123.818915,-123.820471,-123.820407,-123.821531,-123.820857,-123.821288,-123.81719,-123.816316,-123.813505,-123.813199,-123.815092,-123.814536,-123.814793,-123.812603,-123.815726,-123.817915,-123.820841,-123.821199,-123.822386,-123.823911,-123.826311,-123.827684,-123.836854,-123.840232,-123.842871,-123.844724,-123.849528,-123.85081,-123.853382,-123.855572,-123.85591,-123.857192,-123.858549,-123.856075,-123.854857,-123.850176,-123.846258,-123.842828,-123.839241,-123.83883,-123.840149,-123.840156,-123.838249,-123.836688,-123.835422,-123.832155,-123.831124,-123.830979,-123.829967,-123.829528,-123.82572,-123.821973,-123.82251,-123.824877,-123.825624,-123.8271,-123.826921,-123.828112,-123.827264,-123.829397,-123.830968,-123.834173,-123.834302,-123.834601,-123.840227,-123.841559,-123.840893,-123.838755,-123.838574,-123.840118,-123.840683,-123.840693,-123.843151,-123.846851,-123.848497,-123.84909,-123.848952,-123.847758,-123.845611,-123.845386,-123.844471,-123.841723,-123.836151,-123.837574,-123.837496,-123.83653,-123.837541,-123.840103,-123.840068,-123.839963,-123.839529,-123.838849,-123.838592,-123.83774,-123.83615,-123.834613,-123.833287,-123.832066,-123.830213,-123.827325,-123.827502,-123.829295,-123.828843,-123.826343,-123.824441,-123.821615,-123.818161,-123.818981,-123.820663,-123.822037891998,-123.834208,-123.967045984176,-123.999248,-124.084956,-124.102532,-124.121365,-124.211605,-124.21894,-124.227079,-124.230459,-124.231537,-124.237242,-124.239121787196,-124.239716,-124.244725,-124.245485117115,-124.248523,-124.254028,-124.255035,-124.259821,-124.263887,-124.265820787596,-124.270094423003,-124.270464,-124.270791201675,-124.277703,-124.279883,-124.281677,-124.282347205885,-124.28264,-124.286679,-124.288729760161,-124.291269,-124.290870418472,-124.289783836142,-124.289478,-124.291670598908,-124.292595,-124.295473,-124.294998,-124.296801,-124.299649,-124.30084,-124.303991,-124.308571,-124.313319,-124.313628940036,-124.316250114133,-124.316276,-124.316823741191,-124.319738,-124.319924107201,-124.320203,-124.320698,-124.323806521608,-124.324785,-124.325767444958,-124.328858,-124.329066329506,-124.332127,-124.335162,-124.34101,-124.342669,-124.342058,-124.344673,-124.348476,-124.351083,-124.354027,-124.352136,-124.350766,-124.351193,-124.352704,-124.355319,-124.356229,-124.357122,-124.356177,-124.353486,-124.354239,-124.351535,-124.351784,-124.356493,-124.356243,-124.358499,-124.361563,-124.366028,-124.366832,-124.363389,-124.360318,-124.361972,-124.364606,-124.361748,-124.362442,-124.361009,-124.363555,-124.366106,-124.368606,-124.370319,-124.373264,-124.376215,-124.375337,-124.375697,-124.377867,-124.378158,-124.37662,-124.377762,-124.382256,-124.383633,-124.386301,-124.388426,-124.389162,-124.392505,-124.392458,-124.397747,-124.400795,-124.401549,-124.404214,-124.410982,-124.414149,-124.411534,-124.411461,-124.408514,-124.408226331137,-124.408215,-124.41051,-124.412919,-124.41131,-124.411815,-124.41978,-124.418591,-124.420557,-124.425264,-124.426435,-124.427782,-124.431686,-124.433063,-124.431438,-124.431495,-124.429288,-124.427222,-124.428752,-124.426885,-124.426354,-124.424759,-124.424765038491,-124.426155,-124.426131310332,-124.426017646233,-124.425647484431,-124.425499,-124.428734,-124.42983957245,-124.431134,-124.431273499676,-124.435892,-124.43512,-124.433983499306,-124.431748,-124.423836,-124.422038,-124.42492,-124.425631,-124.422012,-124.421981,-124.422394,-124.425816,-124.425039,-124.423084,-124.421356,-124.419964,-124.421381,-124.422195,-124.420076,-124.411362,-124.410982713025,-124.406126984569,-124.405834027084,-124.399829,-124.399133,-124.397684,-124.392657,-124.391571,-124.389977,-124.392305,-124.394426,-124.394815,-124.393663,-124.395052,-124.398319,-124.400031,-124.401954,-124.404933,-124.408289,-124.403855,-124.401716,-124.40433,-124.40112,-124.401498,-124.399421,-124.401385,-124.401177,-124.405547,-124.404841,-124.406282,-124.407266509123,-124.409431,-124.411308,-124.413764,-124.409836,-124.413119,-124.416774,-124.422747,-124.429195,-124.434688,-124.438875,-124.45074,-124.451484,-124.447873851781,-124.447487,-124.449417,-124.452248,-124.455263,-124.454984,-124.459643,-124.459797,-124.461619,-124.462569,-124.46445,-124.467766,-124.467559,-124.473864,-124.478516461253,-124.482158,-124.491225646384,-124.491679,-124.498473,-124.499122,-124.503681,-124.503784994074,-124.505236,-124.508394,-124.511286,-124.513663,-124.514669,-124.514311,-124.513602,-124.516177,-124.52046,-124.524439,-124.532333828514,-124.536073,-124.544179,-124.552845,-124.559298,-124.564487,-124.566244,-124.564595],"lat":[42.840876,42.838038,42.838429,42.840568,42.843616,42.847981,42.851377,42.854086,42.856855,42.862354,42.869664,42.87227,42.875403,42.876082,42.879534,42.879986,42.917502,42.951495,42.9543325389089,42.953817,42.95369,42.953769,42.955232,42.954621,42.954877,42.954946,42.951152,42.951314,42.943809,42.9443,42.940652,42.940948,42.933751,42.933782,42.918156,42.918227,42.911125,42.911141,42.904006,42.90391,42.900327,42.900275,42.896656,42.896696,42.893032,42.893047,42.885919,42.885998,42.88245,42.883499,42.876642,42.874824,42.86973,42.869642,42.8658,42.86581,42.862067,42.862081,42.850511,42.850586,42.828475,42.828288,42.817761,42.817825,42.804038,42.790006,42.790087,42.768326,42.739947,42.739956,42.729928,42.671115,42.671119,42.666697,42.666684,42.671123,42.671129,42.678339,42.678208,42.685454,42.685327,42.685651,42.7001,42.700118,42.714558,42.714569,42.729051,42.729097,42.739666,42.73971,42.774514,42.77484,42.781921,42.781821,42.788994,42.788837,42.787868,42.786983,42.787536,42.78959,42.790094,42.790954,42.79277,42.792936,42.793699,42.797302,42.798147,42.799426,42.798915,42.797665,42.797407,42.794568,42.793468,42.792059,42.792391,42.79107,42.789808,42.789804,42.788245,42.787735,42.788228,42.787971,42.786552,42.783343,42.782865,42.782516,42.781753,42.780131,42.781526,42.783945,42.784164,42.785376,42.784061,42.782694,42.780911,42.77747,42.775435,42.774115,42.773809,42.773041,42.771115,42.768945,42.765701,42.764575,42.762842,42.760655,42.757294,42.753118,42.751499,42.747987,42.746335,42.742576,42.742038,42.732339,42.731791,42.728067,42.72596,42.720584,42.720093,42.717906,42.717138,42.715876,42.715028,42.713543,42.711145,42.709109,42.708063,42.705989,42.704685,42.704493,42.702858,42.700834,42.700429,42.694025,42.632313,42.625798,42.625339,42.622398,42.619743,42.615779,42.614786,42.612446,42.611139,42.60913,42.607575,42.607046,42.606107,42.604497,42.601793,42.599452,42.598106,42.595067,42.591633,42.588961,42.587864,42.586258,42.583353,42.581966,42.579542,42.57809,42.574579,42.570941,42.569663,42.567228,42.566509,42.564143,42.563091,42.562393,42.559989,42.556281,42.553775,42.551791,42.549736,42.544375,42.542232,42.541989,42.539031,42.536341,42.535158,42.534203,42.533372,42.531188,42.530067,42.528675,42.527805,42.526195,42.524647,42.522047,42.519959,42.516799,42.516203,42.51372,42.511588,42.509885,42.508401,42.507625,42.506279,42.505436,42.504233,42.502978,42.500538,42.499925,42.498997,42.499058,42.498416,42.499584,42.499165,42.496903,42.497435,42.496146,42.495396,42.495798,42.494737,42.495021,42.494335,42.494563,42.496048,42.496023,42.497079,42.500293,42.50113,42.500867,42.501334,42.500474,42.500487,42.499311,42.498238,42.498816,42.49732,42.497228,42.496028,42.49535,42.49761,42.497167,42.498353,42.501979,42.501621,42.499599,42.500832,42.500694,42.499962,42.496875,42.496918,42.496147,42.494019,42.489628,42.489421,42.488828,42.487376,42.486682,42.485828,42.48466,42.480858,42.477902,42.473912,42.47166,42.467382,42.464829,42.46302,42.462667,42.462041,42.461239,42.458572,42.455054,42.453976,42.453402,42.451972,42.451543,42.451153,42.447785,42.44602,42.445291,42.444308,42.443527,42.441928,42.439908,42.437069,42.435068,42.434189,42.432342,42.430707,42.429269,42.428504,42.427851,42.427216,42.426465,42.423994,42.421801,42.421399,42.420822,42.419622,42.418034,42.416175,42.413114,42.412677,42.412176,42.410959,42.410041,42.408194,42.407621,42.407409,42.403308,42.402883,42.403283,42.401762,42.398726,42.396407,42.395766,42.394949,42.393818,42.392623,42.388837,42.387656,42.385912,42.384751,42.383094,42.382673,42.380525,42.377858,42.375876,42.374389,42.3702,42.367455,42.365481,42.363636,42.361049,42.359199,42.36166,42.361384,42.35977,42.358541,42.359016,42.358488,42.358487,42.357659,42.357941,42.359409,42.358449,42.358505,42.357979,42.357324,42.35774,42.356714,42.357866,42.356991,42.356544,42.358058,42.360604,42.361625,42.35983,42.355761,42.354338,42.353759,42.352612,42.352008,42.351045,42.348835,42.346469,42.346592,42.346709,42.347884,42.347644,42.349314,42.349234,42.350937,42.351422,42.353293,42.353095,42.351454,42.347602,42.346072,42.345667,42.344851,42.342428,42.341049,42.335279,42.333167,42.330669,42.330071,42.327633,42.327455,42.324799,42.322796,42.322362,42.321478,42.32046,42.31854,42.318688,42.319933,42.320742,42.320577,42.319125,42.318327,42.316923,42.313281,42.312202,42.310752,42.307854,42.305638,42.303538,42.301983,42.299219,42.298507,42.297656,42.296282,42.294693,42.290556,42.288537,42.286277,42.285622,42.282991,42.281652,42.279859,42.279255,42.276123,42.271824,42.270973,42.268693,42.266983,42.264365,42.264665,42.264096,42.262603,42.259439,42.254797,42.253495,42.251246,42.24779,42.24399,42.241494,42.241176,42.239436,42.240204,42.238232,42.237497,42.237623,42.233619,42.231155,42.230098,42.22781,42.224314,42.222173,42.220457,42.22111,42.219878,42.218962,42.216388,42.215738,42.216849,42.217284,42.214644,42.212667,42.20573,42.203769,42.2036,42.198974,42.195498,42.193959,42.190924,42.189849,42.188225,42.185435,42.183987,42.178235,42.174122,42.172501,42.170464,42.169651,42.166047,42.16438,42.163027,42.161167,42.159333,42.157656,42.157509,42.155855,42.154378,42.152913,42.149668,42.146369,42.145819,42.144503,42.143597,42.141392,42.138323,42.137426,42.135116,42.133224,42.130628,42.126945,42.125204,42.125599,42.124671,42.122593,42.119291,42.116779,42.113334,42.109619,42.10885,42.107914,42.103609,42.101345,42.100377,42.097285,42.093188,42.086567,42.085321,42.084441,42.080498,42.077493,42.074796,42.073675,42.072475,42.069596,42.068955,42.066002,42.063791,42.063187,42.060507,42.059225,42.058515,42.057965,42.057618,42.055504,42.05248,42.051934,42.048965,42.047798,42.046646,42.045069,42.043009,42.040136,42.03699,42.036426,42.03336,42.031385,42.029292,42.02734,42.025558,42.024006,42.020306,42.018736,42.018098,42.017586,42.01704,42.016469,42.015304,42.01489,42.013911,42.012811,42.012042,42.011666,42.011552,42.008438,42.006535,42.004951,42.002504,42.00188,42.000564,41.999935,41.998791,41.998563,41.996727,41.9956172960188,41.996116,41.9961337074385,41.996138,41.996662,41.99681,41.997015,41.99846,42.007916,42.0125,42.013206,42.015156,42.018688,42.0225828218138,42.023814,42.02522,42.0253761062006,42.026,42.029218,42.031573,42.034578,42.040923,42.042284325311,42.0452928294818,42.045553,42.0455717127357,42.045967,42.044316,42.04427,42.0450543427124,42.045397,42.045346,42.0447352398387,42.043979,42.044650646595,42.0464816379254,42.046997,42.0480183838992,42.048449,42.04764,42.048876,42.051343,42.051736,42.055806,42.060886,42.064801,42.065277,42.0655839003804,42.0681793680017,42.068205,42.0688524167975,42.072297,42.0730712835003,42.07423159375,42.076291,42.0803783978765,42.081665,42.0825671223039,42.085405,42.0854402420363,42.085958,42.087445,42.092929,42.094295,42.097922,42.100039,42.100215,42.100213,42.103539,42.104692,42.108014,42.110662,42.113293,42.113635,42.114952,42.118016,42.119711,42.121595,42.124095,42.129796,42.134965,42.139691,42.142132,42.143848,42.143767,42.152343,42.15845,42.158588,42.162272,42.166086,42.169219,42.171991,42.176704,42.180752,42.182839,42.183612,42.18862,42.191349,42.195752,42.196381,42.201109,42.206111,42.208971,42.21119,42.213643,42.218809,42.223888,42.22716,42.228076,42.229427,42.232105,42.233345,42.23515,42.239938,42.240081,42.242802,42.245129,42.250547,42.252164,42.254115,42.257678,42.260588,42.2796049322341,42.280354,42.298652,42.301818,42.305175,42.307393,42.315527,42.316757,42.320412,42.322026,42.319569,42.318857,42.321101,42.323976,42.329094,42.33072,42.331746,42.33488,42.338918,42.341532,42.352029,42.376993,42.3770733517197,42.395569,42.3960674941724,42.3984592917688,42.4062484892051,42.409373,42.417776,42.4206421965775,42.423998,42.4243844827095,42.43718,42.441926,42.443810056608,42.447516,42.45735,42.461226,42.462132,42.46346,42.465439,42.470417,42.475608,42.476345,42.478611,42.478952,42.485061,42.48998,42.491737,42.496427,42.499678,42.513378,42.5141969546748,42.5246814209893,42.5253139734301,42.53828,42.543366,42.546728,42.561716,42.568218,42.574758,42.576755,42.577054,42.578512,42.582061,42.584732,42.589587,42.591926,42.592077,42.591139,42.594815,42.594702,42.597676,42.601175,42.601872,42.610005,42.618079,42.620088,42.627192,42.628966,42.631415,42.636517,42.6370463026186,42.63821,42.640715,42.645795,42.649485,42.657934,42.661594,42.663285,42.666605,42.669958,42.670837,42.675798,42.677787,42.6840670501793,42.68474,42.689819,42.691953,42.694369,42.697079,42.702166,42.707486,42.711488,42.714106,42.717283,42.719533,42.723821,42.732671,42.7351234428017,42.737043,42.7415630136265,42.741789,42.741077,42.738606,42.739758,42.7395367701631,42.73645,42.735337,42.733124,42.732949,42.736806,42.744038,42.745827,42.755653,42.770865,42.789793,42.8063386170557,42.814175,42.822958,42.830144,42.834298,42.834164,42.836392,42.840876]}]],[[{"lng":[-124.150267,-124.144075,-124.138326,-124.137178,-124.137081915707,-124.136941,-124.134251,-124.133271736676,-124.130608,-124.125752,-124.125748897347,-124.123975,-124.125438,-124.124083,-124.123643,-124.127073,-124.127758,-124.125824,-124.123876,-124.125868,-124.128882,-124.12741,-124.125272,-124.122668,-124.117006,-124.116717,-124.115864601151,-124.114424,-124.115671,-124.114719,-124.113212,-124.111054,-124.112945,-124.115309,-124.114293,-124.111681,-124.111766,-124.108945,-124.109744,-124.114869,-124.115953,-124.114690718599,-124.114043752426,-124.083717,-124.063303,-124.063259,-123.941072,-123.941075,-123.798955,-123.775598,-123.767931,-123.723588,-123.715386,-123.715377,-123.593513,-123.59329,-123.573614,-123.556039,-123.532858,-123.472186,-123.471685,-123.455686,-123.451272,-123.371411,-123.371408,-123.367696,-123.328667,-123.288655,-123.248679,-123.230044,-123.224885,-123.200385,-123.180388,-123.179931,-123.175977,-123.175133,-123.174174,-123.174054,-123.174938,-123.17501,-123.177701,-123.178903,-123.17878,-123.175342,-123.174204,-123.171308,-123.169341,-123.166868,-123.163604,-123.159533,-123.156542,-123.153386,-123.1512,-123.15034,-123.150627,-123.152389,-123.155708,-123.15911,-123.15787,-123.160434,-123.164226,-123.166002,-123.165428,-123.127696,-123.07167,-123.060853,-123.040799,-123.038427,-123.038121,-122.985827,-122.97952,-122.979199,-122.905755,-122.903999,-122.884125,-122.872923,-122.865545,-122.865465,-122.861992,-122.860134,-122.856452,-122.852796,-122.849343,-122.846854,-122.845096,-122.843403,-122.839919,-122.837442,-122.835135,-122.833148,-122.830451,-122.830352,-122.828717,-122.829074,-122.82527,-122.823015,-122.819352,-122.817065,-122.814416,-122.811705,-122.807156,-122.804727,-122.802825,-122.798259,-122.795605,-122.791085,-122.788615,-122.784205,-122.781625,-122.779134,-122.776319,-122.774074,-122.771265,-122.768734,-122.762735,-122.758905,-122.758014,-122.753255,-122.749834,-122.746347,-122.744584,-122.742034,-122.738128,-122.731121,-122.727574,-122.725697,-122.725089,-122.724937,-122.722692,-122.721184,-122.717134,-122.71472,-122.710473,-122.706473,-122.704483,-122.700224,-122.696076,-122.696412,-122.693973,-122.692063,-122.689353,-122.686703,-122.683333,-122.680863,-122.678543,-122.676247,-122.674283,-122.670787,-122.668915,-122.665931,-122.663697,-122.657909,-122.655773,-122.652553,-122.651583,-122.646853,-122.64679,-122.644542,-122.645763,-122.64493,-122.644082,-122.640716,-122.639699,-122.637437,-122.631432,-122.624857,-122.622312,-122.617391,-122.611738,-122.608342,-122.604621,-122.599071,-122.593471,-122.591986,-122.588363,-122.585624,-122.582028,-122.579831,-122.57677,-122.5754,-122.575169,-122.57778,-122.577232,-122.573085,-122.570153,-122.567339,-122.565493,-122.562413,-122.558723,-122.554953,-122.551917,-122.549707,-122.548543,-122.545794,-122.543711,-122.539632,-122.535382,-122.533745,-122.532614,-122.532942,-122.531171,-122.529542,-122.528191,-122.522442,-122.519391,-122.513425,-122.512251,-122.511964,-122.510561,-122.507203,-122.503182,-122.499506,-122.497,-122.492272,-122.488381,-122.484305,-122.479635,-122.478045,-122.47368,-122.470829,-122.468798,-122.465628,-122.463518,-122.457892,-122.456337,-122.451074,-122.448436,-122.445272,-122.442879,-122.438796,-122.434885,-122.430218,-122.426446,-122.425081,-122.425089,-122.404748,-122.404781,-122.384561,-122.38457,-122.379589,-122.373799,-122.371128,-122.367197,-122.364257,-122.363745,-122.361244,-122.358069,-122.35689,-122.355447,-122.354488,-122.352623,-122.347714,-122.340612,-122.339923,-122.336791,-122.334249,-122.331857,-122.330673,-122.327313,-122.328729,-122.325744,-122.328531,-122.331478,-122.332446,-122.32949,-122.32715,-122.264527,-122.264527,-122.228368,-122.027996,-122.028016,-121.964517,-121.960126,-121.799426,-121.797461,-121.794053,-121.793299,-121.789648,-121.78928,-121.790457,-121.789792,-121.787806,-121.78766,-121.786562,-121.785421,-121.785753,-121.783459,-121.780239,-121.778226,-121.777905,-121.779552,-121.78406,-121.785251,-121.783458,-121.785536,-121.785631,-121.78366,-121.78161,-121.782576,-121.780652,-121.781334,-121.782174,-121.78121,-121.781511,-121.7791,-121.777485,-121.774525,-121.774047,-121.774429,-121.773407,-121.77429,-121.776464,-121.777556,-121.779738,-121.778813,-121.777229,-121.773196,-121.771647,-121.772913,-121.772426,-121.776708,-121.77888,-121.782017,-121.781132,-121.781069,-121.78342,-121.783142,-121.78402,-121.782676,-121.779553,-121.772735,-121.773339,-121.772532,-121.773003,-121.771473,-121.771649,-121.770604,-121.771345,-121.769381,-121.76807,-121.768446,-121.769573,-121.770003,-121.769311,-121.769874,-121.769259,-121.771349,-121.772156,-121.771755,-121.772481,-121.773384,-121.776779,-121.777087,-121.779395,-121.779748,-121.784547,-121.787098,-121.789211,-121.789458,-121.790365,-121.793616,-121.796501,-121.799227,-121.801513,-121.802225,-121.805421,-121.81219,-121.814176,-121.815895,-121.817468,-121.820056,-121.821394,-121.825726,-121.830059,-121.832225,-121.834472,-121.835193,-121.832785,-121.832623,-121.82955,-121.828042,-121.827324,-121.825487,-121.825042,-121.825381,-121.823599,-121.822016,-121.822384,-121.824299,-121.824533,-121.825663,-121.827099,-121.829103,-121.829239,-121.833384,-121.831355,-121.830273,-121.828402,-121.832449,-121.835458,-121.83679,-121.835963,-121.837282,-121.843135,-121.845087,-121.84511,-121.84356,-121.841469,-121.836722,-121.841387,-121.84539,-121.848898,-121.851462,-121.853218,-121.857063,-121.859711,-121.85998,-121.858022,-121.859435,-121.859497,-121.858124,-121.858174,-121.859205,-121.858102,-121.858364,-121.860927,-121.861569,-121.861353,-121.862399,-121.861553,-121.865338,-121.864863,-121.86649,-121.868366,-121.869966,-121.865855,-121.865553,-121.866636,-121.86838,-121.868029,-121.869385,-121.871602,-121.876903,-121.884325,-121.888545,-121.891442,-121.892574,-121.893921,-121.898393,-121.899743,-121.901482,-121.904318,-121.905856,-121.907868,-121.911588,-121.913613,-121.916265,-121.916801,-121.920359,-121.923578,-121.928213,-121.929404,-121.931438,-121.934322,-121.936964,-121.939333,-121.93656,-121.931479,-121.931269,-121.932415,-121.937524,-121.94233,-121.943782,-121.94521,-121.947402,-121.952256,-121.952638,-121.951391,-121.95134,-121.95296,-121.956466,-121.9575,-121.959462,-121.961483,-121.962046,-121.965431,-121.968548,-121.972931,-121.972875,-121.975113,-121.975358,-121.97542,-121.974896,-121.976173,-121.976081,-121.974401,-121.9744,-121.975192,-121.974803,-121.975226,-121.976052,-121.976763,-121.977799,-121.976611,-121.975264,-121.973657,-121.973495,-121.974756,-121.974278,-121.975565,-121.97546,-121.974371,-121.97073,-121.967767,-121.963754,-121.964537,-121.964924,-121.964404,-121.966654,-121.968382,-121.967348,-121.967157,-121.967844,-121.96739,-121.966186,-121.964026,-121.960507,-121.962544,-121.96538,-121.968894,-121.969609,-121.969048,-121.965522,-121.961437,-121.963562,-121.967095,-121.968164,-121.970119,-121.971991,-121.970437,-121.974141,-121.974351,-121.975677,-121.981248,-121.981007,-121.979648,-121.978289,-121.975173,-121.975571,-121.973689,-121.975456,-121.977949,-121.978262,-121.977,-121.975842,-121.973588,-121.973125,-121.974629,-121.975179,-121.974607,-121.973498,-121.971795,-121.967179,-121.966917,-121.967826,-121.972422,-121.973084,-121.972889,-121.973488,-121.976117,-121.978224,-121.979573,-121.979319,-121.980832,-121.981099,-121.983119,-121.98475,-121.984519,-121.985716,-121.986267,-121.985717,-121.98691,-121.985633,-121.982442,-121.980619,-121.980509,-121.978135,-121.974541,-121.973742,-121.972147,-121.969516,-121.967951,-121.9657,-121.964918,-121.968364,-121.977014,-121.981146,-121.98666,-121.99214,-121.995526,-121.997755,-122.000095,-122.001623,-122.001944,-122.002362,-122.003068,-122.010965,-122.013037,-122.016941,-122.020002,-122.026748,-122.02914,-122.034958,-122.035993,-122.038966,-122.04094,-122.042529,-122.046115,-122.047708,-122.049781,-122.056872,-122.059263,-122.061334,-122.064361,-122.067707,-122.071531,-122.072724,-122.070284,-122.071291,-122.076149,-122.078379,-122.080848,-122.0826,-122.086742,-122.092318,-122.093513,-122.094982,-122.094779,-122.096613,-122.099228,-122.103544,-122.105215,-122.106566,-122.109553,-122.110753,-122.112224,-122.116677,-122.124336,-122.125264,-122.12716,-122.129193,-122.131009,-122.131616,-122.133128,-122.133674,-122.135109,-122.136349,-122.138746,-122.139145,-122.140828,-122.142806,-122.142867,-122.141768,-122.140082,-122.140274,-122.143532,-122.144946,-122.146991,-122.146222,-122.147807,-122.149534,-122.148688,-122.147726,-122.145139,-122.142355,-122.138758,-122.132474,-122.131583,-122.129797,-122.129678,-122.130579,-122.128721,-122.130529,-122.133453,-122.133547,-122.130937,-122.131417,-122.133046,-122.133356,-122.132331,-122.132848,-122.134547,-122.13445,-122.135334,-122.136871,-122.138917,-122.140492,-122.140161,-122.13888,-122.137364,-122.136458,-122.138412,-122.138978,-122.136912,-122.138621,-122.145365,-122.147339,-122.146301,-122.148739,-122.151573,-122.15296,-122.149927,-122.147305,-122.14421,-122.14345,-122.140676,-122.138814,-122.13754,-122.132435,-122.132034,-122.270653,-122.27067,-122.447124,-122.508441,-122.508438,-122.622914,-122.622946,-122.741716,-122.741317,-122.741914,-122.741845,-122.771564,-122.776409,-122.781518,-122.833744,-122.892765,-122.9124,-122.932533,-122.935501,-122.970915,-122.987618,-122.987626,-123.107475,-123.107672,-123.107318,-123.137211,-123.13733,-123.137588,-123.137646,-123.138001,-123.137319,-123.147539,-123.153653,-123.185986,-123.312001,-123.313129,-123.348246,-123.3482,-123.397831,-123.411426,-123.470371,-123.470251,-123.529153,-123.529005,-123.579689,-123.57958,-123.619574,-123.619367,-123.619621,-123.619012,-123.658909,-123.658767,-123.703628,-123.7038,-123.734733,-123.75871,-123.81007,-123.827004,-123.827036,-123.831984,-123.832118,-123.837073,-123.837143,-123.842059,-123.842136,-123.847057,-123.847397,-123.852268,-123.852602,-123.862381,-123.862685,-123.872399,-123.872566,-123.872667,-123.877485,-123.877749,-123.882553,-123.882804,-123.897197,-123.897407,-123.902195,-123.902391,-123.907166,-123.916158,-123.925917,-123.926089,-123.925479,-123.934708,-123.946529,-123.946294,-123.96592,-123.98581,-124.005944,-124.025781,-124.064585,-124.064614,-124.098533,-124.101667,-124.102125,-124.104167,-124.138807,-124.158728145934,-124.150267],"lat":[43.91085,43.958437,43.995325,44.013606,44.0174173436398,44.023007,44.042125,44.0485338927156,44.065967,44.092848,44.0928706736351,44.105834,44.11123,44.114417,44.117217,44.119776,44.122027,44.12613,44.1341,44.136034,44.137549,44.139211,44.141892,44.142519,44.171913,44.185962,44.1904979663121,44.198164,44.206554,44.2167,44.221742,44.235071,44.24275,44.245977,44.249408,44.255421,44.260489,44.265475,44.270597,44.272721,44.274641,44.276194,44.2769899702691,44.276117,44.275094,44.277178,44.277375,44.282951,44.283304,44.283547,44.283606,44.283944,44.283946,44.280267,44.276699,44.281915,44.282597,44.281402,44.281523,44.281471,44.281185,44.280647,44.280496,44.281021,44.283725,44.283719,44.283725,44.283724,44.283726,44.283725,44.283725,44.283725,44.283725,44.283431,44.277606,44.275152,44.267131,44.266608,44.261582,44.259514,44.255751,44.253056,44.251601,44.248645,44.248114,44.247537,44.245854,44.240113,44.235315,44.233078,44.233269,44.231343,44.228779,44.226627,44.2252,44.222689,44.219947,44.214094,44.211612,44.207989,44.204725,44.201877,44.200071,44.200016,44.200024,44.200077,44.200136,44.200745,44.200129,44.200572,44.200613,44.200616,44.200736,44.259129,44.258894,44.258952,44.25898,44.287317,44.286662,44.285586,44.285373,44.285539,44.284298,44.284282,44.283601,44.281187,44.281352,44.282129,44.283455,44.282285,44.282166,44.28097,44.278525,44.277106,44.276858,44.27432,44.275804,44.27639,44.276269,44.27983,44.284171,44.283952,44.284435,44.284724,44.285708,44.285866,44.28565,44.283459,44.2834,44.283909,44.283816,44.284609,44.286729,44.288119,44.290537,44.290066,44.289137,44.28724,44.28473,44.285909,44.286051,44.287467,44.285828,44.28823,44.286529,44.286668,44.285639,44.283162,44.282775,44.281778,44.280931,44.281603,44.27937,44.279319,44.27822,44.279938,44.278893,44.277019,44.275771,44.275387,44.273948,44.27373,44.274459,44.274128,44.27327,44.273535,44.271849,44.270633,44.268902,44.269093,44.270062,44.271093,44.269688,44.26881,44.267078,44.266384,44.264246,44.260088,44.25681,44.253458,44.252551,44.251096,44.249263,44.249458,44.249189,44.25002,44.249852,44.247801,44.246867,44.245298,44.244228,44.24447,44.244427,44.242953,44.24123,44.239178,44.238046,44.237819,44.236587,44.235358,44.234628,44.22979,44.228044,44.229146,44.228689,44.229347,44.230575,44.231617,44.230568,44.231089,44.232295,44.235344,44.235588,44.235022,44.235184,44.23431,44.23486,44.233706,44.231511,44.22987,44.228633,44.226715,44.226498,44.228581,44.230717,44.231535,44.22982,44.227819,44.2262,44.223448,44.22167,44.222611,44.222308,44.219967,44.221927,44.22148,44.219132,44.219196,44.222406,44.222878,44.222599,44.223039,44.222209,44.220805,44.219036,44.21805,44.216748,44.217388,44.218543,44.21871,44.221306,44.220296,44.218544,44.218198,44.220657,44.22058,44.216938,44.217063,44.211013,44.20944,44.210413,44.209667,44.20938,44.21102,44.211945,44.211748,44.213326,44.216311,44.217265,44.219183,44.220742,44.221659,44.221577,44.224454,44.227001,44.226938,44.227653,44.229606,44.231189,44.234719,44.237579,44.238506,44.240603,44.243382,44.249537,44.252841,44.25263,44.253847,44.253847,44.253818,44.256164,44.257238,44.257313,44.25828,44.254613,44.252707,44.25152,44.249326,44.247071,44.245463,44.243505,44.240762,44.234981,44.233215,44.230903,44.229239,44.225653,44.224606,44.221483,44.218877,44.216985,44.215751,44.212595,44.209599,44.208394,44.207811,44.20542,44.205326,44.203014,44.201958,44.199392,44.198499,44.196545,44.194809,44.194255,44.192042,44.190792,44.190156,44.187627,44.185623,44.183762,44.181082,44.178687,44.17565,44.173127,44.171595,44.169488,44.167583,44.164798,44.16353,44.159933,44.160744,44.159765,44.158315,44.155202,44.154322,44.151746,44.148462,44.14625,44.145276,44.139831,44.137039,44.134981,44.133307,44.131314,44.12676,44.125254,44.123916,44.118178,44.115245,44.11205,44.110428,44.108132,44.106409,44.10395,44.10134,44.099603,44.095897,44.094858,44.091034,44.089686,44.088537,44.085138,44.082353,44.080121,44.077214,44.076541,44.075019,44.072607,44.071873,44.067131,44.061662,44.060089,44.05684,44.052691,44.052251,44.053164,44.052956,44.051201,44.051832,44.050905,44.047911,44.044147,44.041365,44.041599,44.039744,44.037024,44.035576,44.033319,44.03106,44.029158,44.024752,44.023129,44.021567,44.019426,44.016406,44.012359,44.010777,44.008066,44.004224,44.002135,43.99759,43.995395,43.994496,43.991094,43.990573,43.989247,43.988727,43.987296,43.987284,43.985983,43.984745,43.982647,43.979073,43.976239,43.975021,43.973445,43.972587,43.971232,43.969574,43.967175,43.967269,43.966335,43.966596,43.965248,43.961526,43.958507,43.954542,43.953806,43.952781,43.951404,43.948783,43.947384,43.945593,43.944787,43.943048,43.941197,43.939036,43.937103,43.935837,43.932315,43.930281,43.925795,43.923898,43.923286,43.920959,43.919789,43.917106,43.915837,43.914504,43.911859,43.911681,43.907841,43.907985,43.90867,43.908658,43.9109,43.910784,43.912269,43.914537,43.9159,43.914863,43.913363,43.913876,43.912326,43.912917,43.912347,43.911488,43.911171,43.908566,43.909181,43.907347,43.905543,43.904908,43.903343,43.900866,43.900588,43.898992,43.897504,43.894213,43.890663,43.886262,43.884603,43.882058,43.881049,43.878063,43.876552,43.875554,43.873938,43.871681,43.870083,43.868549,43.868195,43.866226,43.865003,43.865763,43.864554,43.861156,43.859351,43.85757,43.855444,43.851773,43.851243,43.848478,43.846044,43.843043,43.84128,43.83999,43.838518,43.83585,43.834914,43.830226,43.828526,43.827615,43.827875,43.829345,43.827147,43.821219,43.817418,43.812541,43.811768,43.811555,43.813036,43.812761,43.809736,43.808235,43.805798,43.803954,43.801924,43.800984,43.795743,43.793313,43.791207,43.78699,43.784709,43.782628,43.78124,43.77872,43.777706,43.774753,43.769542,43.76734,43.765176,43.763745,43.762525,43.759699,43.757767,43.756832,43.752983,43.750748,43.750364,43.748549,43.746965,43.742964,43.741516,43.739082,43.737692,43.735841,43.733585,43.730635,43.729102,43.725444,43.724446,43.722386,43.721911,43.7176,43.715821,43.714027,43.710661,43.708584,43.706227,43.705008,43.704254,43.702821,43.701406,43.69714,43.695848,43.692868,43.691409,43.690301,43.688021,43.683766,43.680825,43.676079,43.673038,43.670143,43.667019,43.665708,43.66425,43.661708,43.656292,43.653858,43.652527,43.644379,43.64254,43.639685,43.637181,43.635627,43.633715,43.631689,43.629837,43.627549,43.62779,43.627045,43.626385,43.625796,43.625894,43.625632,43.625893,43.626937,43.62704,43.626357,43.622528,43.616414,43.615498,43.614657,43.609274,43.609162,43.609916,43.606611,43.604822,43.603609,43.602452,43.601758,43.601615,43.600817,43.599211,43.597823,43.597881,43.594581,43.59192,43.590297,43.589719,43.587403,43.58775,43.58775,43.584945,43.581616,43.579585,43.579643,43.577964,43.577326,43.577615,43.579584,43.579642,43.579215,43.576825,43.575654,43.574618,43.574987,43.574486,43.572977,43.569273,43.567709,43.565274,43.56549,43.562447,43.561938,43.55993,43.558293,43.557376,43.557284,43.55495,43.553278,43.551491,43.549437,43.544544,43.543161,43.541944,43.540482,43.53711,43.535952,43.534465,43.530775,43.529683,43.528421,43.52841,43.525509,43.523617,43.523017,43.520693,43.519057,43.515463,43.513576,43.513285,43.511821,43.510434,43.507323,43.505694,43.503594,43.499774,43.496887,43.491969,43.491401,43.489966,43.485057,43.483834,43.482811,43.479701,43.478185,43.476034,43.47356,43.472069,43.468423,43.467445,43.467514,43.466716,43.463835,43.461778,43.461777,43.460686,43.459132,43.456987,43.456339,43.45514,43.45489,43.452654,43.450923,43.449351,43.448708,43.447662,43.444354,43.442479,43.442832,43.444169,43.444947,43.444501,43.443167,43.441124,43.440221,43.440011,43.441628,43.44141,43.441275,43.440226,43.440262,43.438458,43.437395,43.452015,43.517582,43.544654,43.544317,43.544034,43.543912,43.544702,43.544882,43.543886,43.544357,43.54417,43.541679,43.540992,43.538988,43.540013,43.542099,43.605889,43.605906,43.649355,43.677086,43.736284,43.753648,43.77967,43.779635,43.779631,43.779533,43.77991,43.77991,43.78017,43.809212,43.809076,43.809877,43.810056,43.831183,43.830061,43.86833,43.868291,43.891057,43.891672,43.899074,43.906509,43.921117,43.921672,43.936474,43.937399,43.944319,43.944062,43.943882,43.944581,43.944837,43.94305,43.94308,43.935987,43.935984,43.932458,43.932429,43.928878,43.928822,43.924661,43.924682,43.920553,43.920658,43.916562,43.916733,43.914097,43.912655,43.91275,43.908629,43.908714,43.904582,43.904714,43.900512,43.900512,43.896281,43.896252,43.897322,43.898476,43.878689,43.865947,43.866012,43.871689,43.862737,43.863042,43.862001,43.862996,43.862224,43.862277,43.86421,43.863512,43.86343,43.863417,43.863289,43.863611,43.8637200341693,43.91085]}]],[[{"lng":[-119.943441,-119.943504,-119.931595,-119.931944,-119.932611,-119.896969,-119.896465,-119.895056,-119.895163,-119.896581,-119.897434,-119.777528,-119.775402,-119.657183,-119.614325,-118.932024,-118.867264,-118.857192,-118.816931,-118.81689,-118.799711,-118.587172,-118.587125,-118.467308,-118.466299,-118.347859,-118.347856,-118.227645,-118.228107,-118.230291,-118.231731,-118.232392,-118.232171,-118.232178,-118.232011,-118.228069,-118.228618,-118.228683,-118.228673,-118.228793,-118.216832,-118.216384,-118.214698,-118.195281,-118.196857,-118.197369215928,-118.501002,-118.601806,-118.628692114981,-118.644698465629,-118.696409,-118.775869,-118.777228,-118.795612,-118.829630206433,-119.001022,-119.20828,-119.231876,-119.251033,-119.324182599298,-119.360121480893,-119.359446,-119.363579,-119.363648,-119.363896,-119.365156,-119.365337,-119.705858,-119.706005,-119.943779,-119.943441],"lat":[42.753671,42.917079,42.917005,42.976439,43.178963,43.179017,43.353816,43.568127,43.592745,43.611164,43.6982,43.697957,43.959086,43.95892,43.959593,43.960374,43.960462,43.960227,43.960733,44.047828,44.047775,44.046995,44.040266,44.040375,44.040374,44.040388,44.039075,44.039862,43.779195,43.779207,43.779216,43.612266,43.436775,43.43565,43.348959,43.348964,43.096791,43.086086,43.042817,42.914625,42.914703,42.805902,42.275891,42.275813,42.135279,41.9969940811635,41.995446,41.993895,41.9932978970796,41.9929424184721,41.991794,41.992692,41.992671,41.992394,41.9926256901358,41.993793,41.993177,41.994212,41.993843,41.9942055845967,41.9943837248054,42.13723,42.137231,42.220094,42.487079,42.661822,42.748958,42.748791,42.746605,42.746371,42.753671]}]],[[{"lng":[-122.867891,-122.857175,-122.851912,-122.846503,-122.846485,-122.846494,-122.843407,-122.842499,-122.825967,-122.82066,-122.807188,-122.805556,-122.80547,-122.787507,-122.786266,-122.784896,-122.769123,-122.764942,-122.75407,-122.746817,-122.743741,-122.743868,-122.743811,-122.743798,-122.743856,-122.743923,-122.743923,-122.743933,-122.743922,-122.743915,-122.743919,-122.743921,-122.743926,-122.743942,-122.743939,-122.743848,-122.743941,-122.743942,-122.743956,-122.743963,-122.743974,-122.744029,-122.74406,-122.744006,-122.743991,-122.743721,-122.741101,-122.738563,-122.733422,-122.7303,-122.725541,-122.721663,-122.721355,-122.719286,-122.715938,-122.712169,-122.707893,-122.705021,-122.703304,-122.702001,-122.701808,-122.698697,-122.697382,-122.694678,-122.682505,-122.681893,-122.675572,-122.673311,-122.672677,-122.666298,-122.666145,-122.660451,-122.654959,-122.648725,-122.648787,-122.651183,-122.646267,-122.64616,-122.647666,-122.651227,-122.652605,-122.658274,-122.659105,-122.660979,-122.656972,-122.652988,-122.652921,-122.646958,-122.641245,-122.64158,-122.636587,-122.63656,-122.632974,-122.626278,-122.622359,-122.618977,-122.618995,-122.618588,-122.618341,-122.616871,-122.616195,-122.615374,-122.613127,-122.610832,-122.608722,-122.606614,-122.60573,-122.60175,-122.601454,-122.599675,-122.597665,-122.59762,-122.597395,-122.597198,-122.597184,-122.596702,-122.596603,-122.596245,-122.58937,-122.586836,-122.58613,-122.5855,-122.583961,-122.57905,-122.571309,-122.570126,-122.568617,-122.565483,-122.558255,-122.55301,-122.548002,-122.547638,-122.537618,-122.532488,-122.530085,-122.527468,-122.517067,-122.514243,-122.510439,-122.507261,-122.504364,-122.501787,-122.501043,-122.499336,-122.496748,-122.486584,-122.485866,-122.479942,-122.47555,-122.474558,-122.47253,-122.468001,-122.466639,-122.45466,-122.447789,-122.443966,-122.439145,-122.414457,-122.41397,-122.403758,-122.389346,-122.383141,-122.372796,-122.372096,-122.357752,-122.348315,-122.342882,-122.316084,-122.305836,-122.2727,-122.263944,-122.249828,-122.249969,-122.166674,-122.147212,-122.126545,-122.126544,-122.085981,-122.004194,-121.983147,-121.983148,-121.821956,-121.821959,-121.819587,-121.815501,-121.814319,-121.810726,-121.806845,-121.805977,-121.807559,-121.807583,-121.80559,-121.805791,-121.807908,-121.806939,-121.806916,-121.80456,-121.802589,-121.799679,-121.796434,-121.794539,-121.793651,-121.792696,-121.790802,-121.785633,-121.783928,-121.780122,-121.776204,-121.773181,-121.766144,-121.762165,-121.756938,-121.744622,-121.738405,-121.735074,-121.732298,-121.730946,-121.726508,-121.72419,-121.723201,-121.720904,-121.716979,-121.714579,-121.708575,-121.705532,-121.704123,-121.700473,-121.699988,-121.698113,-121.696925,-121.69756,-121.700209,-121.699231,-121.700709,-121.700918,-121.702141,-121.70123,-121.701957,-121.703546,-121.70326,-121.704223,-121.704567,-121.703592,-121.702846,-121.70326,-121.702476,-121.700932,-121.698691,-121.697615,-121.693809,-121.691752,-121.689975,-121.688772,-121.687276,-121.687945,-121.685262,-121.683547,-121.68159,-121.679081,-121.679232,-121.680813,-121.679888,-121.68,-121.681973,-121.684562,-121.68505,-121.685033,-121.687532,-121.689008,-121.690481,-121.690732,-121.692134,-121.695032,-121.696479,-121.696411,-121.691878,-121.689261,-121.680898,-121.682463,-121.681537,-121.684793,-121.685304,-121.686262,-121.684475,-121.682607,-121.685082,-121.689772,-121.691112,-121.697685,-121.698375,-121.69945,-121.703592,-121.705971,-121.709251,-121.710517,-121.711275,-121.712953,-121.714469,-121.715592,-121.719697,-121.727341,-121.73048,-121.73492,-121.736292,-121.738512,-121.741175,-121.74687,-121.748245,-121.749061,-121.748649,-121.747973,-121.746454,-121.743454,-121.740329,-121.738794,-121.736506,-121.733403,-121.732018,-121.731438,-121.730168,-121.729226,-121.728533,-121.727194,-121.725283,-121.723999,-121.718675,-121.715716,-121.712219,-121.711596,-121.710503,-121.710201,-121.71065,-121.710291,-121.708402,-121.70805,-121.706179,-121.702383,-121.700208,-121.69865,-121.699675,-121.696085,-121.695074,-121.693387,-121.69088,-121.687776,-121.685005,-121.682723,-121.677722,-121.667021,-121.665717,-121.664694,-121.662881,-121.662382,-121.662415,-121.661656,-121.660444,-121.657245,-121.653866,-121.652638,-121.652581,-121.653315,-121.652732,-121.651394,-121.652018,-121.653593,-121.656909,-121.659639,-121.660828,-121.660419,-121.66043,-121.65871,-121.660852,-121.672405,-121.680346,-121.683277,-121.688164,-121.691214,-121.693396,-121.696035,-121.697656,-121.698143,-121.699939,-121.707639,-121.710813,-121.714462,-121.715266,-121.722584,-121.722407,-121.718977,-121.718681,-121.716996,-121.717652,-121.720814,-121.725175,-121.730625,-121.735545,-121.737791,-121.740994,-121.744103,-121.749443,-121.751454,-121.752152,-121.755915,-121.766495,-121.770738,-121.778672,-121.779906,-121.781727,-121.78183,-121.779672,-121.779132,-121.778803,-121.781121,-121.781588,-121.781098,-121.781958,-121.784556,-121.788805,-121.793219,-121.798154,-121.80044,-121.804426,-121.805269,-121.805667,-121.804406,-121.803163,-121.802547,-121.803471,-121.802935,-121.801623,-121.802626,-121.803345,-121.800131,-121.798684,-121.798502,-121.79603,-121.794783,-121.792475,-121.792162,-121.791112,-121.787787,-121.786147,-121.785593,-121.785612,-121.786735,-121.790661,-121.796127,-121.79511,-121.789703,-121.787028,-121.78285,-121.77977,-121.777156,-121.773775,-121.772236,-121.766527,-121.764083,-121.76256,-121.760379,-121.754124,-121.752417,-121.748452,-121.745436,-121.744453,-121.744585,-121.747324,-121.747297,-121.742614,-121.738297,-121.735372,-121.732821,-121.728994,-121.723005,-121.71456,-121.714854,-121.715592,-121.71822,-121.723013,-121.724519,-121.726138,-121.728208,-121.730737,-121.734396,-121.735253,-121.734223,-121.765322,-121.806706,-122.257482,-122.317709,-122.378871,-122.388999,-122.401021,-122.399655,-122.396057,-122.393936,-122.393227,-122.394475,-122.39354,-122.394498,-122.394349,-122.395774,-122.399554,-122.401663,-122.404145,-122.407737,-122.410428,-122.413982,-122.422733,-122.423551,-122.426441,-122.429684,-122.435193,-122.436643,-122.439655,-122.441487,-122.445521,-122.446968,-122.450045,-122.453594,-122.455185,-122.4585,-122.464204,-122.466492,-122.47126,-122.475125,-122.480324,-122.483507,-122.48619,-122.487974,-122.492889,-122.495627,-122.496329,-122.499167,-122.500908,-122.505316,-122.506406,-122.508106,-122.511494,-122.515898,-122.51585,-122.516997,-122.517542,-122.518934,-122.522276,-122.523985,-122.526335,-122.527397,-122.52966,-122.532858,-122.535472,-122.536946,-122.540368,-122.540574,-122.542187,-122.543205,-122.545409,-122.546099,-122.548613,-122.549216,-122.550897,-122.552009,-122.551783,-122.553144,-122.554761,-122.556847,-122.555943,-122.557935,-122.559757,-122.558937,-122.560126,-122.561605,-122.56115,-122.562859,-122.56507,-122.56476,-122.565592,-122.567212,-122.566342,-122.567385,-122.568801,-122.571483,-122.573,-122.576221,-122.579862,-122.58168,-122.586299,-122.588868,-122.592472,-122.594954,-122.595491,-122.593133,-122.594367,-122.593682,-122.593818,-122.594626,-122.593197,-122.593483,-122.593502,-122.594702,-122.593535,-122.595636,-122.594796,-122.595829,-122.59552,-122.599078,-122.602164,-122.609216,-122.61168,-122.616241,-122.618649,-122.623428,-122.626492,-122.629512,-122.631083,-122.633939,-122.635839,-122.63866,-122.639844,-122.643168,-122.644197,-122.646144,-122.647963,-122.649252,-122.650233,-122.653581,-122.657523,-122.658507,-122.660029,-122.662537,-122.666038,-122.669637,-122.673705,-122.677361,-122.677936,-122.68152,-122.681147,-122.685747,-122.689571,-122.69464,-122.699104,-122.700829,-122.705237,-122.704641,-122.70536,-122.707425,-122.707287,-122.711949,-122.714132,-122.717097,-122.718753,-122.717886,-122.720723,-122.721141,-122.719677,-122.722655,-122.723727,-122.725293,-122.725607,-122.729745,-122.729595,-122.732936,-122.736633,-122.737647,-122.739652,-122.740594,-122.743301,-122.744146,-122.745578,-122.746317,-122.748307,-122.749968,-122.748752,-122.74984,-122.752579,-122.753353,-122.755755,-122.757254,-122.760276,-122.760977,-122.762126,-122.763246,-122.763984,-122.765164,-122.764789,-122.765616,-122.766302,-122.767681,-122.766995,-122.769068,-122.7707,-122.773366,-122.773903,-122.775889,-122.774314,-122.776307,-122.776942,-122.775718,-122.776187,-122.777586,-122.777663,-122.781786,-122.782827,-122.782815,-122.785493,-122.786549,-122.788505,-122.786627,-122.78538,-122.786313,-122.784888,-122.780824,-122.779965,-122.781352,-122.780652,-122.782013,-122.782884,-122.78211,-122.779564,-122.780383,-122.779835,-122.778455,-122.778553,-122.776847,-122.776907,-122.775109,-122.774156,-122.772894,-122.772035,-122.770026,-122.772065,-122.773305,-122.774752,-122.773688,-122.771475,-122.769712,-122.768112,-122.766605,-122.763332,-122.762055,-122.760535,-122.759894,-122.7619,-122.756883,-122.756696,-122.759303,-122.757657,-122.756386,-122.754149,-122.756842,-122.75439,-122.752463,-122.751894,-122.752724,-122.756569,-122.757844,-122.760134,-122.760358,-122.754911,-122.756151,-122.757919,-122.758214,-122.756239,-122.7544,-122.753184,-122.753841,-122.756522,-122.753884,-122.753413,-122.755088,-122.756638,-122.759434,-122.760415,-122.759871,-122.757517,-122.755534,-122.75652,-122.753163,-122.751459,-122.751833,-122.754896,-122.754437,-122.751348,-122.751611,-122.749815,-122.750561,-122.750461,-122.752691,-122.754369,-122.753159,-122.753648,-122.75639,-122.757403,-122.758803,-122.759494,-122.758267,-122.75582,-122.757473,-122.754592,-122.752483,-122.752237,-122.753886,-122.753387,-122.748307,-122.747358,-122.748557,-122.745399,-122.747201,-122.748091,-122.746621,-122.747151,-122.746712,-122.748913,-122.749779,-122.752533,-122.75186,-122.748109,-122.747274,-122.746774,-122.74563,-122.745299,-122.747765,-122.749821,-122.750085,-122.750739,-122.749784,-122.747736,-122.749131,-122.75124,-122.750248,-122.751948,-122.749958,-122.749828,-122.751113,-122.750062,-122.747134,-122.747534,-122.745653,-122.744481,-122.744258,-122.743964,-122.743741,-122.743598,-122.743512,-122.743481,-122.743483,-122.74445,-122.742709,-122.74112,-122.741516,-122.738988,-122.73926,-122.784756,-122.784857,-122.784898,-122.7849,-122.832856,-122.834576,-122.834765,-122.837929,-122.842326,-122.846224,-122.84674,-122.849872,-122.849925,-122.868073,-122.867891],"lat":[45.317345,45.317273,45.317228,45.317192,45.328151,45.34595,45.346154,45.346133,45.346249,45.346233,45.346276,45.34566,45.331772,45.33182,45.33182,45.331825,45.331909,45.331928,45.331994,45.332045,45.332067,45.346587,45.353992,45.355871,45.359577,45.371751,45.372181,45.375538,45.377431,45.381513,45.386122,45.386845,45.387483,45.391704,45.393033,45.396544,45.402592,45.402702,45.404972,45.406149,45.407918,45.415311,45.418855,45.421046,45.426072,45.433294,45.433268,45.433238,45.433199,45.43324,45.433167,45.433137,45.433135,45.433113,45.433079,45.433056,45.433042,45.433037,45.433038,45.433056,45.433041,45.433041,45.433041,45.43301,45.432841,45.432841,45.432867,45.432795,45.432792,45.432743,45.432743,45.432702,45.432668,45.432718,45.432811,45.436059,45.439584,45.441424,45.443983,45.445281,45.445741,45.453242,45.454341,45.457819,45.458066,45.458314,45.458318,45.458669,45.458671,45.461482,45.461476,45.461474,45.46155,45.461451,45.461444,45.461451,45.460908,45.460933,45.460832,45.460889,45.461473,45.461481,45.461493,45.461501,45.461505,45.461493,45.461488,45.461486,45.461464,45.461454,45.461453,45.461453,45.461457,45.461457,45.461457,45.461458,45.461458,45.461458,45.46149,45.461522,45.461483,45.461487,45.461494,45.461518,45.461392,45.46138,45.461365,45.461307,45.461062,45.461053,45.461045,45.461058,45.461353,45.461318,45.461296,45.461273,45.461262,45.46126,45.461256,45.461252,45.461187,45.461107,45.46107,45.461028,45.460982,45.461132,45.461138,45.461176,45.461183,45.461184,45.461173,45.461135,45.461127,45.460941,45.460974,45.461001,45.461134,45.461579,45.461581,45.461421,45.4613,45.461276,45.46123,45.461222,45.461426,45.461502,45.461529,45.46149,45.461439,45.461394,45.461412,45.461422,45.460935,45.460837,45.460828,45.460039,45.461299,45.46058,45.461534,45.461403,45.460237,45.460226,45.461674,45.461675,45.459678,45.457968,45.455518,45.454649,45.451832,45.450143,45.448983,45.444307,45.443096,45.442561,45.440485,45.435494,45.432929,45.431927,45.427854,45.427171,45.424228,45.418572,45.415174,45.415202,45.412164,45.4101,45.407275,45.402672,45.402457,45.403433,45.402844,45.401105,45.397261,45.397131,45.395664,45.395593,45.394798,45.393784,45.393648,45.39177,45.3894,45.387131,45.386754,45.383619,45.383545,45.381733,45.378531,45.376309,45.373838,45.373564,45.371963,45.369899,45.368338,45.366277,45.364545,45.363389,45.356172,45.35187,45.349016,45.346629,45.344448,45.339223,45.338957,45.334258,45.331267,45.329188,45.327889,45.323929,45.322947,45.321348,45.319453,45.316379,45.309477,45.306251,45.30503,45.30306,45.300714,45.299775,45.297177,45.295895,45.294816,45.292672,45.290025,45.287942,45.286259,45.283681,45.281798,45.279234,45.276153,45.275625,45.271641,45.268412,45.263859,45.25792,45.255359,45.254141,45.251348,45.250581,45.247204,45.243495,45.240067,45.235873,45.233301,45.230368,45.228988,45.228409,45.22965,45.229558,45.227391,45.226448,45.224054,45.2233,45.221466,45.21998,45.21847,45.215347,45.212368,45.21133,45.210941,45.211691,45.212044,45.211543,45.208963,45.206919,45.206156,45.206788,45.205997,45.2051,45.197559,45.1918,45.188995,45.18635,45.183795,45.182227,45.180374,45.176313,45.174913,45.170913,45.170633,45.170314,45.168594,45.164721,45.161556,45.159339,45.158354,45.156838,45.154039,45.153424,45.152824,45.150597,45.148733,45.143283,45.14039,45.137271,45.134055,45.131594,45.129102,45.127066,45.123789,45.12179,45.118883,45.117392,45.116934,45.11806,45.122474,45.12369,45.123572,45.12236,45.120519,45.11972,45.115172,45.114456,45.11335,45.107592,45.105425,45.104415,45.103177,45.102852,45.101992,45.099886,45.098582,45.097111,45.088803,45.086706,45.084943,45.082515,45.079635,45.075258,45.073623,45.069473,45.066355,45.066362,45.067683,45.068111,45.068012,45.067109,45.065692,45.06365,45.062866,45.061626,45.059579,45.05852,45.057054,45.055912,45.053214,45.051756,45.045432,45.044095,45.042325,45.039285,45.038037,45.037566,45.036915,45.036784,45.036182,45.034668,45.033616,45.034428,45.03385,45.034098,45.034836,45.036162,45.037218,45.03958,45.039837,45.037277,45.035136,45.034399,45.033698,45.031646,45.030126,45.026237,45.021486,45.018144,45.016312,45.015214,45.015132,45.016028,45.017471,45.01615,45.015183,45.012877,45.011496,45.006124,45.002217,44.999614,44.995386,44.992173,44.987321,44.982743,44.981021,44.977103,44.976452,44.974963,44.973167,44.970487,44.964926,44.959666,44.95786,44.956569,44.95477,44.952248,44.950377,44.947412,44.945223,44.941371,44.937426,44.935668,44.934682,44.935457,44.935654,44.935153,44.936857,44.938213,44.93984,44.941721,44.941952,44.941233,44.938447,44.932036,44.93057,44.927539,44.923042,44.920925,44.91983,44.917166,44.914636,44.912122,44.910179,44.907761,44.906819,44.904814,44.906315,44.90613,44.90277,44.900018,44.89745,44.896167,44.895375,44.893142,44.891348,44.890799,44.88931,44.888473,44.88572,44.885719,44.88572,44.88572,44.88572,44.885716,44.88572,44.88572,44.886262,44.889461,44.890411,44.891673,44.893745,44.895326,44.896804,44.899106,44.901513,44.904077,44.903796,44.904679,44.905012,44.903207,44.903949,44.904154,44.903461,44.903142,44.902029,44.903297,44.90295,44.90407,44.903958,44.906108,44.908139,44.910375,44.911579,44.913152,44.915212,44.916363,44.915471,44.917318,44.918395,44.921567,44.921549,44.922659,44.921358,44.920914,44.919965,44.919034,44.917781,44.918567,44.918332,44.91951,44.919599,44.922628,44.927857,44.929833,44.930043,44.932797,44.933534,44.934565,44.935681,44.936046,44.935156,44.935035,44.937446,44.936684,44.939975,44.943562,44.945139,44.945665,44.948872,44.949182,44.950115,44.950425,44.954172,44.954646,44.95626,44.957953,44.959177,44.959405,44.961426,44.962863,44.963588,44.965195,44.967159,44.969355,44.970562,44.971395,44.973208,44.973904,44.975131,44.977266,44.978628,44.980206,44.982564,44.983735,44.98521,44.985101,44.986044,44.985983,44.988407,44.988748,44.989629,44.988875,44.99089,44.992781,44.995429,44.996424,44.997588,45.00001,45.00081,45.003442,45.004531,45.006866,45.009501,45.012247,45.013907,45.016304,45.017789,45.01962,45.020549,45.021784,45.021866,45.024354,45.025,45.026964,45.028271,45.028355,45.030057,45.032175,45.033795,45.033418,45.031682,45.031442,45.032126,45.03377,45.033754,45.032445,45.032454,45.035844,45.035458,45.035768,45.035877,45.037081,45.038637,45.043633,45.046532,45.047052,45.046514,45.046314,45.047789,45.050296,45.052439,45.053471,45.054055,45.055997,45.057489,45.05929,45.061008,45.061957,45.062479,45.064479,45.067162,45.069124,45.069888,45.072405,45.074183,45.0758,45.077761,45.079641,45.081425,45.083141,45.082868,45.085653,45.087275,45.088244,45.092173,45.093478,45.094204,45.094286,45.095987,45.096291,45.098606,45.099676,45.102757,45.102063,45.103315,45.105482,45.10772,45.107061,45.110084,45.110444,45.111851,45.111575,45.112905,45.112597,45.113867,45.112386,45.11301,45.114389,45.115813,45.114627,45.114868,45.115745,45.1167,45.118255,45.117758,45.119241,45.118832,45.120228,45.121021,45.121981,45.122449,45.123511,45.123531,45.122446,45.124861,45.124528,45.126177,45.127566,45.129344,45.130356,45.130538,45.132497,45.133732,45.135904,45.137743,45.139388,45.140148,45.141555,45.141717,45.143852,45.145019,45.146571,45.147702,45.148922,45.149192,45.151118,45.151644,45.153233,45.153446,45.155281,45.155645,45.157689,45.159421,45.159579,45.160965,45.16182,45.163454,45.163004,45.16167,45.163073,45.163304,45.167946,45.169203,45.169575,45.170901,45.171984,45.172802,45.174712,45.175159,45.177512,45.178058,45.177444,45.179577,45.180131,45.18098,45.182194,45.18265,45.182445,45.183093,45.182647,45.183565,45.184699,45.186249,45.185891,45.186873,45.187131,45.186135,45.187517,45.18822,45.188847,45.189178,45.190158,45.191576,45.191249,45.189771,45.19142,45.194733,45.195719,45.19542,45.193098,45.19176,45.192758,45.193742,45.195927,45.196745,45.195862,45.194701,45.194959,45.197682,45.199202,45.200024,45.199926,45.201089,45.201832,45.202085,45.200599,45.200705,45.203317,45.205555,45.20697,45.209145,45.208981,45.209758,45.210801,45.21165,45.212319,45.211034,45.212283,45.214153,45.215953,45.217883,45.22069,45.221665,45.223337,45.225199,45.227217,45.229017,45.228835,45.23017,45.231213,45.231025,45.229255,45.230095,45.232772,45.233478,45.231969,45.233603,45.235042,45.236119,45.235692,45.238205,45.238406,45.24053,45.242542,45.243364,45.244329,45.245342,45.247278,45.249281,45.252235,45.252059,45.250772,45.250775,45.250826,45.250906,45.250982,45.251193,45.251356,45.251553,45.253319,45.256638,45.257031,45.258664,45.259532,45.259532,45.259575,45.261833,45.273887,45.274069,45.274053,45.274058,45.273822,45.26955,45.265657,45.261773,45.261388,45.259717,45.259697,45.259695,45.317345]}]],[[{"lng":[-123.180908,-123.180532,-123.178468,-123.174215,-123.170891,-123.16781,-123.1616,-123.155436,-123.152597,-123.149402,-123.147924,-123.147995,-123.146617,-123.144973,-123.141485,-123.13733,-123.134498,-123.13309,-123.132383,-123.13017,-123.128245,-123.125287,-123.123769,-123.120462,-123.116542,-123.11321,-123.108792,-123.107108,-123.108165,-123.110396,-123.1123,-123.112769,-123.111472,-123.109725,-123.105091,-123.093008,-123.091347,-123.082998,-123.081694,-123.076574,-123.072813,-123.071687,-123.06993,-123.067478,-123.062005,-123.060074,-123.054933,-123.0496,-123.044433,-123.043631,-123.042906,-123.042127,-123.04148,-123.039822,-123.038095,-123.037897,-123.038923,-123.037566,-123.036985,-123.037316,-123.037807,-123.037779,-123.037594,-123.037374,-123.037897,-123.040164,-123.040529,-123.040853,-123.041717,-123.042938,-123.047081,-123.051824,-123.053762,-123.05465,-123.055299,-123.058089,-123.064261,-123.065415,-123.066938,-123.068685,-123.069219,-123.071977,-123.074723,-123.075577,-123.075174,-123.075113,-123.074284,-123.073539,-123.072732,-123.070654,-123.068975,-123.068849,-123.067835,-123.067043,-123.065974,-123.06603,-123.066732,-123.068079,-123.068271,-123.068627,-123.067619,-123.062251,-123.059397,-123.051936,-123.046115,-123.044916,-123.041478,-123.036121,-123.033439,-123.027643,-123.018118,-123.014574,-123.009998,-123.008255,-123.005564,-123.002309,-122.999042,-122.996444,-122.998002,-123.001054,-123.007494,-123.009878,-123.012235,-123.015037,-123.020187,-123.022368,-123.025303,-123.028136,-123.031177,-123.031676,-123.032027,-123.032467,-123.033292,-123.033173,-123.031407,-123.028875,-123.02705,-123.023019,-123.01801,-123.011513,-123.007346,-123.003569,-123.000726,-123.001883,-123.007746,-123.011189,-123.014505,-123.015382,-123.01624,-123.018862,-123.019124,-123.018777,-123.020521,-123.022219,-123.024949,-123.028675,-123.036649,-123.041321,-123.043892,-123.045896,-123.047009,-123.049662,-123.050918,-123.051106,-123.049012,-123.046867,-123.044146,-123.04117,-123.038475,-123.035667,-123.02609,-123.007632,-123.003867,-122.999659,-122.997737,-122.996221,-122.995366,-122.995576,-122.996087,-122.996469,-122.997702,-122.998455,-122.998984,-123.001527,-123.001497,-123.000788,-122.999811,-122.999265,-122.996046,-122.99097,-122.98831,-122.981086,-122.977037,-122.975052,-122.974937,-122.974957,-122.974911,-122.974699,-122.971659,-122.967579,-122.964021,-122.9623,-122.961195,-122.959922,-122.958818,-122.957273,-122.954429,-122.952144,-122.949691,-122.947317,-122.943419,-122.932081,-122.928984,-122.92513,-122.922836,-122.919112,-122.916561,-122.912621,-122.908708,-122.904219,-122.899528,-122.898048,-122.893198,-122.889006,-122.886812,-122.882494,-122.881015,-122.879136,-122.872906,-122.867179,-122.86352,-122.858823,-122.854691,-122.849925,-122.849872,-122.84674,-122.846224,-122.842326,-122.837929,-122.834765,-122.834576,-122.832856,-122.7849,-122.784898,-122.784857,-122.784756,-122.73926,-122.738988,-122.741516,-122.74112,-122.742709,-122.74445,-122.743483,-122.743481,-122.743512,-122.743598,-122.743741,-122.743964,-122.744258,-122.744481,-122.745653,-122.747534,-122.747134,-122.750062,-122.751113,-122.749828,-122.749958,-122.751948,-122.750248,-122.75124,-122.749131,-122.747736,-122.749784,-122.750739,-122.750085,-122.749821,-122.747765,-122.745299,-122.74563,-122.746774,-122.747274,-122.748109,-122.75186,-122.752533,-122.749779,-122.748913,-122.746712,-122.747151,-122.746621,-122.748091,-122.747201,-122.745399,-122.748557,-122.747358,-122.748307,-122.753387,-122.753886,-122.752237,-122.752483,-122.754592,-122.757473,-122.75582,-122.758267,-122.759494,-122.758803,-122.757403,-122.75639,-122.753648,-122.753159,-122.754369,-122.752691,-122.750461,-122.750561,-122.749815,-122.751611,-122.751348,-122.754437,-122.754896,-122.751833,-122.751459,-122.753163,-122.75652,-122.755534,-122.757517,-122.759871,-122.760415,-122.759434,-122.756638,-122.755088,-122.753413,-122.753884,-122.756522,-122.753841,-122.753184,-122.7544,-122.756239,-122.758214,-122.757919,-122.756151,-122.754911,-122.760358,-122.760134,-122.757844,-122.756569,-122.752724,-122.751894,-122.752463,-122.75439,-122.756842,-122.754149,-122.756386,-122.757657,-122.759303,-122.756696,-122.756883,-122.7619,-122.759894,-122.760535,-122.762055,-122.763332,-122.766605,-122.768112,-122.769712,-122.771475,-122.773688,-122.774752,-122.773305,-122.772065,-122.770026,-122.772035,-122.772894,-122.774156,-122.775109,-122.776907,-122.776847,-122.778553,-122.778455,-122.779835,-122.780383,-122.779564,-122.78211,-122.782884,-122.782013,-122.780652,-122.781352,-122.779965,-122.780824,-122.784888,-122.786313,-122.78538,-122.786627,-122.788505,-122.786549,-122.785493,-122.782815,-122.782827,-122.781786,-122.777663,-122.777586,-122.776187,-122.775718,-122.776942,-122.776307,-122.774314,-122.775889,-122.773903,-122.773366,-122.7707,-122.769068,-122.766995,-122.767681,-122.766302,-122.765616,-122.764789,-122.765164,-122.763984,-122.763246,-122.762126,-122.760977,-122.760276,-122.757254,-122.755755,-122.753353,-122.752579,-122.74984,-122.748752,-122.749968,-122.748307,-122.746317,-122.745578,-122.744146,-122.743301,-122.740594,-122.739652,-122.737647,-122.736633,-122.732936,-122.729595,-122.729745,-122.725607,-122.725293,-122.723727,-122.722655,-122.719677,-122.721141,-122.720723,-122.717886,-122.718753,-122.717097,-122.714132,-122.711949,-122.707287,-122.707425,-122.70536,-122.704641,-122.705237,-122.700829,-122.699104,-122.69464,-122.689571,-122.685747,-122.681147,-122.68152,-122.677936,-122.677361,-122.673705,-122.669637,-122.666038,-122.662537,-122.660029,-122.658507,-122.657523,-122.653581,-122.650233,-122.649252,-122.647963,-122.646144,-122.644197,-122.643168,-122.639844,-122.63866,-122.635839,-122.633939,-122.631083,-122.629512,-122.626492,-122.623428,-122.618649,-122.616241,-122.61168,-122.609216,-122.602164,-122.599078,-122.59552,-122.595829,-122.594796,-122.595636,-122.593535,-122.594702,-122.593502,-122.593483,-122.593197,-122.594626,-122.593818,-122.593682,-122.594367,-122.593133,-122.595491,-122.594954,-122.592472,-122.588868,-122.586299,-122.58168,-122.579862,-122.576221,-122.573,-122.571483,-122.568801,-122.567385,-122.566342,-122.567212,-122.565592,-122.56476,-122.56507,-122.562859,-122.56115,-122.561605,-122.560126,-122.558937,-122.559757,-122.557935,-122.555943,-122.556847,-122.554761,-122.553144,-122.551783,-122.552009,-122.550897,-122.549216,-122.548613,-122.546099,-122.545409,-122.543205,-122.542187,-122.540574,-122.540368,-122.536946,-122.535472,-122.532858,-122.52966,-122.527397,-122.526335,-122.523985,-122.522276,-122.518934,-122.517542,-122.516997,-122.51585,-122.515898,-122.511494,-122.508106,-122.506406,-122.505316,-122.500908,-122.499167,-122.496329,-122.495627,-122.492889,-122.487974,-122.48619,-122.483507,-122.480324,-122.475125,-122.47126,-122.466492,-122.464204,-122.4585,-122.455185,-122.453594,-122.450045,-122.446968,-122.445521,-122.441487,-122.439655,-122.436643,-122.435193,-122.429684,-122.426441,-122.423551,-122.422733,-122.413982,-122.410428,-122.407737,-122.404145,-122.401663,-122.399554,-122.395774,-122.394349,-122.394498,-122.39354,-122.394475,-122.393227,-122.393936,-122.396057,-122.399655,-122.401021,-122.388999,-122.378871,-122.317709,-122.257482,-121.806706,-121.765322,-121.734223,-121.733528,-121.736936,-121.739922,-121.746221,-121.747741,-121.747874,-121.750034,-121.753182,-121.751069,-121.748587,-121.742406,-121.741864,-121.742441,-121.745258,-121.746671,-121.750261,-121.752994,-121.753589,-121.759991,-121.76252,-121.764831,-121.767978,-121.775926,-121.781753,-121.787132,-121.790183,-121.792116,-121.796409,-121.803883,-121.808137,-121.812221,-121.811363,-121.810174,-121.813063,-121.813663,-121.816998,-121.820278,-121.819663,-121.820254,-121.817693,-121.816517,-121.816436,-121.817212,-121.817809,-121.819137,-121.817386,-121.813655,-121.81202,-121.810296,-121.80762,-121.806653,-121.804304,-121.804413,-121.801536,-121.798998,-121.796831,-121.795963,-121.79151,-121.789999,-121.784961,-121.783621,-121.779924,-121.778305,-121.776323,-121.773183,-121.772449,-121.771593,-121.769125,-121.769206,-121.76661,-121.763225,-121.761005,-121.759958,-121.762002,-121.768218,-121.772321,-121.775652,-121.774175,-121.780168,-121.782569,-121.788203,-121.788525,-121.79161,-121.792298,-121.795075,-121.797222,-121.800219,-121.799458,-121.802779,-121.804597,-121.802682,-121.798109,-121.79695,-121.794385,-121.795643,-121.79528,-121.795864,-121.795797,-121.796107,-121.796704,-121.797833,-121.798174,-121.802109,-121.802922,-121.800479,-121.797651,-121.796565,-121.797009,-121.796635,-121.795481,-121.793604,-121.793329,-121.790022,-121.788944,-121.787179,-121.788859,-121.793238,-121.794599,-121.799562,-121.963805,-121.964997,-121.966375,-121.967345,-121.971604,-121.973503,-121.974303,-121.977179,-121.980176,-121.981681,-121.984527,-121.992926,-121.996208,-121.999761,-122.001009,-122.003216,-122.005291,-122.008804,-122.011684,-122.015715,-122.016709,-122.01847,-122.020851,-122.024106,-122.026339,-122.028916,-122.030498,-122.033006,-122.034171,-122.03598,-122.040875,-122.045304,-122.046094,-122.047028,-122.050762,-122.054415,-122.056484,-122.058813,-122.060621,-122.063939,-122.065765,-122.068144,-122.069796,-122.071823,-122.074393,-122.075401,-122.077104,-122.081091,-122.08412,-122.086244,-122.088617,-122.09404,-122.096559,-122.100326,-122.103815,-122.107563,-122.108719,-122.110688,-122.11344,-122.118702,-122.119828,-122.119821,-122.121442,-122.122466,-122.124247,-122.128698,-122.130972,-122.132685,-122.138702,-122.14237,-122.149224,-122.152774,-122.154325,-122.156292,-122.161118,-122.164191,-122.166572,-122.171843,-122.174251,-122.178684,-122.179739,-122.184557,-122.189405,-122.193924,-122.196732,-122.198046,-122.198685,-122.199334,-122.204021,-122.207421,-122.210663,-122.21445,-122.218413,-122.220719,-122.222145,-122.224659,-122.22769,-122.23037,-122.231438,-122.23292,-122.237408,-122.23706,-122.242203,-122.245971,-122.246528,-122.247582,-122.250044,-122.253592,-122.255066,-122.255448,-122.259394,-122.261423,-122.264381,-122.269612,-122.271886,-122.273067,-122.274,-122.27376,-122.276675,-122.278591,-122.282872,-122.288569,-122.292897,-122.300164,-122.302935,-122.306909,-122.308786,-122.311568,-122.317447,-122.318858,-122.32137,-122.325742,-122.328534,-122.333374,-122.334685,-122.340708,-122.343213,-122.34955,-122.354329,-122.35614,-122.362732,-122.370076,-122.372462,-122.378629,-122.382079,-122.38863,-122.39138,-122.394416,-122.397991,-122.400882,-122.4027,-122.406298,-122.408208,-122.41,-122.41099,-122.411198,-122.410944,-122.410988,-122.411213,-122.412346,-122.419433,-122.423287,-122.428316,-122.431319,-122.435041,-122.436918,-122.44036,-122.441817,-122.442151,-122.443103,-122.443897,-122.454774,-122.457333,-122.46124,-122.469302,-122.473551,-122.475835,-122.475968,-122.475677,-122.477499,-122.480122,-122.484798,-122.487637,-122.496565,-122.503151,-122.50559,-122.511612,-122.519439,-122.520605,-122.520625,-122.52245,-122.522561,-122.52029,-122.521912,-122.531042,-122.532911,-122.536666,-122.538944,-122.541561,-122.542407,-122.546669,-122.553888,-122.56151,-122.564402,-122.56693,-122.568195,-122.568548,-122.569953,-122.5701,-122.572269,-122.576929,-122.582836,-122.597363,-122.599469,-122.603458,-122.607766,-122.61524,-122.618014,-122.620463,-122.621327,-122.627139,-122.634129,-122.639144,-122.64073,-122.645826,-122.65029,-122.653472,-122.660327,-122.66985,-122.670774,-122.677492,-122.680574,-122.683555,-122.690864,-122.694844,-122.696463,-122.700531,-122.705411,-122.713778,-122.715588,-122.719631,-122.721705,-122.724795,-122.726418,-122.727945,-122.729355,-122.732714,-122.737302,-122.743446,-122.748027,-122.753221,-122.757763,-122.759186,-122.762124,-122.763398,-122.765303,-122.768613,-122.773998,-122.778248,-122.779831,-122.783465,-122.787691,-122.793327,-122.794418,-122.800709,-122.804166,-122.803195,-122.805408,-122.807949,-122.812321,-122.813636,-122.813769,-122.815899,-122.819465,-122.821487,-122.825426,-122.828925,-122.832797,-122.839136,-122.839763,-122.842851,-122.845145,-122.847178,-122.848492,-122.846935,-122.8471,-122.849696,-122.852323,-122.856157,-122.861237,-122.864965,-122.868847,-122.871689,-122.873219,-122.873245,-122.87453,-122.882731,-122.884958,-122.890258,-122.891829,-122.892398,-122.895184,-122.897648,-122.899397,-122.900612,-122.902456,-122.90538,-122.906842,-122.909232,-122.909888,-122.913298,-122.916886,-122.919518,-122.919464,-122.922578,-122.925638,-122.928097,-122.929887,-122.929381,-122.931922,-122.93408,-122.937846,-122.943228,-122.947659,-122.949349,-122.955481,-122.957256,-122.962703,-122.964661,-122.969086,-122.971694,-122.97265,-122.97364,-122.973993,-122.973649,-122.974427,-122.975862,-122.979769,-122.985042,-122.986746,-122.988675,-122.990027,-122.991695,-122.993648,-122.996175,-122.998293,-122.997623,-122.996025,-122.996297,-122.998717,-123.000013,-123.001831,-123.004903,-123.005477,-123.006847,-123.007595,-123.010604,-123.01133,-123.012491,-123.013065,-123.01383,-123.014599,-123.015982,-123.018107,-123.018367,-123.018598,-123.018734,-123.018747,-123.018679,-123.017345,-123.016551,-123.015765,-123.015049,-123.014433,-123.013824,-123.013866,-123.01474,-123.01509,-123.015148,-123.015825,-123.016667,-123.018153,-123.019999,-123.024002,-123.027127,-123.031884,-123.034095,-123.035804,-123.03941,-123.041567,-123.042756,-123.041897,-123.039451,-123.039828,-123.039988,-123.040809,-123.041354,-123.042037,-123.043527,-123.044987,-123.050025,-123.053026,-123.055342,-123.060106,-123.061853,-123.061431,-123.060721,-123.061117,-123.062154,-123.066818,-123.07173,-123.076375,-123.078903,-123.081389,-123.086457,-123.089503,-123.092658,-123.095772,-123.099242,-123.100881,-123.105377,-123.106032,-123.107712,-123.111578,-123.113025,-123.118721,-123.120253,-123.119733,-123.120155,-123.123007,-123.12769,-123.133831,-123.13696,-123.139759,-123.142191,-123.143843,-123.145463,-123.147833,-123.148411,-123.148333,-123.14752,-123.145812,-123.144012,-123.140101,-123.137656,-123.133628,-123.132924,-123.131328,-123.129627,-123.128571,-123.126787,-123.125807,-123.124779,-123.122064,-123.117983,-123.110229,-123.102131,-123.097713,-123.095698,-123.09199,-123.091349,-123.091479,-123.093335,-123.101167,-123.103566,-123.109462,-123.1114,-123.118528,-123.126252,-123.131734,-123.140136,-123.143754,-123.149254,-123.151364,-123.152849,-123.154541,-123.158928,-123.166472,-123.169856,-123.173863,-123.17778,-123.179387,-123.179555,-123.179677,-123.179758,-123.179829,-123.18001,-123.180117,-123.179881,-123.179857,-123.180122,-123.180944,-123.180908],"lat":[44.857553,44.858765,44.861006,44.863534,44.864462,44.864022,44.861579,44.860009,44.860059,44.861254,44.863181,44.866795,44.870722,44.877305,44.88374,44.887259,44.889368,44.891904,44.894683,44.90073,44.904764,44.909273,44.910536,44.912185,44.913242,44.914782,44.917505,44.920337,44.92249,44.923826,44.926012,44.928728,44.930161,44.930863,44.93044,44.930541,44.930297,44.927167,44.926878,44.926914,44.927686,44.928107,44.92905,44.932214,44.936207,44.937885,44.940694,44.942701,44.944231,44.94495,44.945975,44.947098,44.948114,44.95165,44.95657,44.958779,44.961154,44.965581,44.967428,44.972795,44.975841,44.977463,44.979621,44.981139,44.984421,44.988153,44.988502,44.98877,44.989381,44.990026,44.991041,44.990302,44.989928,44.989868,44.989826,44.989368,44.989778,44.990718,44.995005,44.998378,45.000505,45.008897,45.012533,45.014513,45.017489,45.021657,45.02584,45.031314,45.033397,45.036599,45.041493,45.046709,45.054188,45.060738,45.068042,45.069102,45.071438,45.074288,45.074864,45.076586,45.078925,45.082673,45.083942,45.086332,45.089197,45.090273,45.094073,45.097729,45.098953,45.100555,45.100961,45.101967,45.105444,45.107235,45.111091,45.11311,45.114694,45.117631,45.120604,45.123249,45.127319,45.129273,45.133769,45.136757,45.138747,45.139431,45.140185,45.141313,45.144303,45.144999,45.145564,45.146614,45.150825,45.153831,45.15794,45.160852,45.161894,45.162905,45.162765,45.160252,45.159498,45.161321,45.16452,45.167365,45.170955,45.173053,45.175796,45.177017,45.181566,45.189247,45.191003,45.19584,45.199841,45.201121,45.202051,45.201943,45.199434,45.198918,45.199481,45.201105,45.204744,45.207266,45.209391,45.211305,45.214705,45.216583,45.21828,45.220788,45.222272,45.222789,45.223224,45.222137,45.22217,45.223696,45.226947,45.230698,45.233981,45.237426,45.238305,45.238752,45.239953,45.241311,45.242731,45.254877,45.257284,45.259347,45.26085,45.261554,45.264811,45.267714,45.268761,45.271011,45.273321,45.276226,45.276928,45.278081,45.279143,45.279979,45.283041,45.285083,45.284894,45.28388,45.282982,45.281837,45.280509,45.278695,45.273639,45.270488,45.26826,45.267485,45.267586,45.268499,45.268621,45.268635,45.268509,45.268065,45.267445,45.266203,45.262835,45.259435,45.256719,45.256622,45.257798,45.257491,45.256531,45.255211,45.254827,45.254425,45.253827,45.252972,45.253084,45.254719,45.257252,45.259697,45.259717,45.261388,45.261773,45.265657,45.26955,45.273822,45.274058,45.274053,45.274069,45.273887,45.261833,45.259575,45.259532,45.259532,45.258664,45.257031,45.256638,45.253319,45.251553,45.251356,45.251193,45.250982,45.250906,45.250826,45.250775,45.250772,45.252059,45.252235,45.249281,45.247278,45.245342,45.244329,45.243364,45.242542,45.24053,45.238406,45.238205,45.235692,45.236119,45.235042,45.233603,45.231969,45.233478,45.232772,45.230095,45.229255,45.231025,45.231213,45.23017,45.228835,45.229017,45.227217,45.225199,45.223337,45.221665,45.22069,45.217883,45.215953,45.214153,45.212283,45.211034,45.212319,45.21165,45.210801,45.209758,45.208981,45.209145,45.20697,45.205555,45.203317,45.200705,45.200599,45.202085,45.201832,45.201089,45.199926,45.200024,45.199202,45.197682,45.194959,45.194701,45.195862,45.196745,45.195927,45.193742,45.192758,45.19176,45.193098,45.19542,45.195719,45.194733,45.19142,45.189771,45.191249,45.191576,45.190158,45.189178,45.188847,45.18822,45.187517,45.186135,45.187131,45.186873,45.185891,45.186249,45.184699,45.183565,45.182647,45.183093,45.182445,45.18265,45.182194,45.18098,45.180131,45.179577,45.177444,45.178058,45.177512,45.175159,45.174712,45.172802,45.171984,45.170901,45.169575,45.169203,45.167946,45.163304,45.163073,45.16167,45.163004,45.163454,45.16182,45.160965,45.159579,45.159421,45.157689,45.155645,45.155281,45.153446,45.153233,45.151644,45.151118,45.149192,45.148922,45.147702,45.146571,45.145019,45.143852,45.141717,45.141555,45.140148,45.139388,45.137743,45.135904,45.133732,45.132497,45.130538,45.130356,45.129344,45.127566,45.126177,45.124528,45.124861,45.122446,45.123531,45.123511,45.122449,45.121981,45.121021,45.120228,45.118832,45.119241,45.117758,45.118255,45.1167,45.115745,45.114868,45.114627,45.115813,45.114389,45.11301,45.112386,45.113867,45.112597,45.112905,45.111575,45.111851,45.110444,45.110084,45.107061,45.10772,45.105482,45.103315,45.102063,45.102757,45.099676,45.098606,45.096291,45.095987,45.094286,45.094204,45.093478,45.092173,45.088244,45.087275,45.085653,45.082868,45.083141,45.081425,45.079641,45.077761,45.0758,45.074183,45.072405,45.069888,45.069124,45.067162,45.064479,45.062479,45.061957,45.061008,45.05929,45.057489,45.055997,45.054055,45.053471,45.052439,45.050296,45.047789,45.046314,45.046514,45.047052,45.046532,45.043633,45.038637,45.037081,45.035877,45.035768,45.035458,45.035844,45.032454,45.032445,45.033754,45.03377,45.032126,45.031442,45.031682,45.033418,45.033795,45.032175,45.030057,45.028355,45.028271,45.026964,45.025,45.024354,45.021866,45.021784,45.020549,45.01962,45.017789,45.016304,45.013907,45.012247,45.009501,45.006866,45.004531,45.003442,45.00081,45.00001,44.997588,44.996424,44.995429,44.992781,44.99089,44.988875,44.989629,44.988748,44.988407,44.985983,44.986044,44.985101,44.98521,44.983735,44.982564,44.980206,44.978628,44.977266,44.975131,44.973904,44.973208,44.971395,44.970562,44.969355,44.967159,44.965195,44.963588,44.962863,44.961426,44.959405,44.959177,44.957953,44.95626,44.954646,44.954172,44.950425,44.950115,44.949182,44.948872,44.945665,44.945139,44.943562,44.939975,44.936684,44.937446,44.935035,44.935156,44.936046,44.935681,44.934565,44.933534,44.932797,44.930043,44.929833,44.927857,44.922628,44.919599,44.91951,44.918332,44.918567,44.917781,44.919034,44.919965,44.920914,44.921358,44.922659,44.921549,44.921567,44.918395,44.917318,44.915471,44.916363,44.915212,44.913152,44.911579,44.910375,44.908139,44.906108,44.903958,44.90407,44.90295,44.903297,44.902029,44.903142,44.903461,44.904154,44.903949,44.903207,44.905012,44.904679,44.903796,44.904077,44.901513,44.899106,44.896804,44.895326,44.893745,44.891673,44.890411,44.889461,44.886262,44.88572,44.88572,44.885716,44.88572,44.88572,44.88572,44.885719,44.88572,44.882059,44.879812,44.876673,44.875394,44.872298,44.869565,44.864573,44.86124,44.856706,44.855163,44.853292,44.847398,44.845514,44.841401,44.837387,44.832677,44.829919,44.828908,44.82543,44.824633,44.820267,44.819734,44.819846,44.818958,44.815469,44.815433,44.813004,44.812002,44.81217,44.811634,44.811574,44.807869,44.806377,44.805407,44.80399,44.803173,44.800134,44.795847,44.79466,44.793037,44.792964,44.792548,44.791602,44.790637,44.7898,44.786813,44.784404,44.781509,44.78228,44.782159,44.780597,44.779078,44.777548,44.779277,44.778183,44.776675,44.772848,44.772311,44.773281,44.771856,44.772641,44.775543,44.77555,44.77416,44.775636,44.775136,44.772141,44.769993,44.769111,44.766914,44.767292,44.765293,44.762326,44.760886,44.76137,44.759964,44.754074,44.752723,44.750464,44.748893,44.748232,44.747845,44.746259,44.744269,44.741882,44.738266,44.735456,44.732713,44.730793,44.729236,44.729116,44.727671,44.727148,44.725896,44.724655,44.72052,44.716295,44.71558,44.714547,44.714077,44.713842,44.713707,44.711741,44.710685,44.703088,44.70078,44.699309,44.69837,44.698304,44.69753,44.696291,44.6946,44.6928,44.690417,44.689291,44.687063,44.685153,44.683929,44.683915,44.683888,44.684129,44.685564,44.685483,44.689168,44.691926,44.692141,44.691065,44.693635,44.693787,44.69226,44.689704,44.690406,44.687755,44.687445,44.68911,44.688618,44.686724,44.687317,44.690576,44.690836,44.690819,44.689988,44.690218,44.689948,44.688861,44.687201,44.685691,44.685799,44.687338,44.688084,44.688263,44.688731,44.692286,44.692841,44.692955,44.693644,44.697043,44.697513,44.696384,44.696426,44.697193,44.697478,44.698365,44.700448,44.700734,44.700608,44.698712,44.699471,44.702147,44.702552,44.704358,44.705825,44.707154,44.707611,44.706996,44.707172,44.708855,44.710107,44.710977,44.71193,44.713165,44.714143,44.715879,44.717151,44.718001,44.718005,44.721143,44.725179,44.7261,44.726127,44.724254,44.719643,44.717671,44.717039,44.715565,44.71368,44.713151,44.710244,44.708729,44.707001,44.705819,44.703685,44.703152,44.703218,44.700798,44.696784,44.69617,44.697184,44.695977,44.696236,44.694456,44.693239,44.694399,44.695981,44.696937,44.697071,44.697668,44.698465,44.70099,44.705106,44.706416,44.713068,44.717246,44.719361,44.720745,44.722005,44.722504,44.723565,44.725706,44.728796,44.729275,44.73179,44.732929,44.734203,44.735506,44.738496,44.741007,44.746135,44.747099,44.750634,44.753062,44.753979,44.754257,44.75525,44.75549,44.75611,44.75621,44.758914,44.759289,44.758822,44.758759,44.756705,44.756323,44.755412,44.755972,44.756864,44.75804,44.75766,44.757225,44.757428,44.756511,44.754975,44.752014,44.752082,44.754362,44.755029,44.753131,44.752316,44.753697,44.755047,44.755006,44.754739,44.754428,44.754134,44.753908,44.753124,44.752753,44.752512,44.752011,44.753528,44.751448,44.752751,44.754761,44.756134,44.755458,44.753528,44.753404,44.753858,44.754725,44.755009,44.755259,44.755633,44.755564,44.753742,44.752139,44.752096,44.752567,44.753934,44.75489,44.755819,44.755009,44.754001,44.751043,44.749763,44.750074,44.752692,44.753486,44.754101,44.755686,44.758945,44.760641,44.762046,44.764031,44.766805,44.766867,44.766226,44.764863,44.765619,44.766239,44.767362,44.768217,44.767942,44.768072,44.769646,44.771258,44.774001,44.774716,44.774732,44.775558,44.776476,44.777214,44.777804,44.778181,44.782461,44.784075,44.788271,44.788863,44.789213,44.789107,44.787851,44.787861,44.787054,44.784738,44.782401,44.781976,44.781136,44.780277,44.777719,44.777574,44.777923,44.777371,44.776088,44.775417,44.77602,44.777267,44.777245,44.778523,44.780196,44.781647,44.789338,44.791364,44.792929,44.793214,44.792106,44.789677,44.789109,44.789479,44.787808,44.787738,44.789642,44.790451,44.790249,44.791419,44.792586,44.793174,44.792765,44.793463,44.792603,44.79278,44.794422,44.793666,44.791563,44.791537,44.791578,44.789678,44.78903,44.786855,44.785434,44.785209,44.783213,44.779591,44.777942,44.778194,44.775523,44.771708,44.77072,44.770298,44.770616,44.770896,44.774362,44.77468,44.774063,44.772644,44.769308,44.767536,44.76229,44.760755,44.759186,44.758055,44.7583,44.758216,44.757137,44.75506,44.752291,44.751136,44.751034,44.750569,44.748623,44.747499,44.745129,44.743985,44.744958,44.743794,44.741044,44.739819,44.739187,44.737503,44.736472,44.732507,44.729806,44.728611,44.726906,44.724935,44.723703,44.721852,44.72222,44.720663,44.719301,44.716995,44.71578,44.714889,44.715479,44.717986,44.718634,44.720937,44.721094,44.715557,44.714277,44.713103,44.709874,44.707984,44.705845,44.702888,44.700518,44.698606,44.697578,44.696492,44.696526,44.695985,44.694026,44.693479,44.693872,44.696058,44.695699,44.694101,44.69212,44.690286,44.689016,44.687233,44.686916,44.688924,44.68809,44.687041,44.686898,44.68794,44.689732,44.690091,44.690794,44.691194,44.691887,44.69276,44.694116,44.697591,44.69816,44.698774,44.699336,44.699592,44.700354,44.704244,44.705776,44.707409,44.709128,44.710897,44.712904,44.714894,44.717341,44.71976,44.719877,44.721154,44.72213,44.723642,44.725376,44.725578,44.723951,44.72107,44.720551,44.721804,44.723498,44.725243,44.728972,44.731045,44.733589,44.735417,44.735833,44.736823,44.73726,44.737595,44.73808,44.738451,44.73849,44.737627,44.737034,44.737684,44.738869,44.743405,44.744883,44.747124,44.748042,44.748094,44.74615,44.743504,44.743073,44.743343,44.745997,44.747011,44.747551,44.746539,44.746215,44.746553,44.748844,44.751034,44.752966,44.759049,44.759483,44.758445,44.756922,44.753731,44.752475,44.751272,44.751372,44.752109,44.751258,44.749592,44.7488,44.748914,44.749516,44.751446,44.755137,44.760578,44.765404,44.770231,44.771832,44.773729,44.775272,44.778736,44.779867,44.785587,44.787897,44.789249,44.79117,44.791961,44.792666,44.793774,44.794537,44.796516,44.797542,44.799099,44.800848,44.806642,44.80953,44.811523,44.814044,44.817768,44.818847,44.82098,44.821691,44.822803,44.826079,44.826479,44.825503,44.825398,44.826506,44.827607,44.829536,44.830219,44.830236,44.828733,44.829041,44.83042,44.833332,44.835729,44.83612,44.836601,44.837131,44.837984,44.839568,44.841506,44.844667,44.845611,44.851647,44.855601,44.857553]}]],[[{"lng":[-121.849512,-121.847093,-121.843955,-121.844453,-121.844256,-121.843049,-121.844366,-121.845971,-121.847034,-121.84938,-121.848875,-121.847359,-121.84688,-121.844861,-121.843914,-121.839796,-121.834668,-121.832405,-121.829007,-121.82561,-121.824155,-121.823104,-121.819453,-121.818283,-121.815638,-121.814698,-121.809865,-121.809382,-121.809419,-121.811212,-121.813074,-121.812509,-121.813482,-121.816073,-121.816317,-121.815832,-121.8138,-121.813604,-121.811331,-121.807657,-121.806817,-121.807092,-121.804825,-121.803286,-121.802801,-121.802093,-121.803133,-121.801798,-121.800708,-121.801265,-121.800617,-121.79921,-121.800051,-121.799081,-121.799965,-121.798363,-121.796859,-121.79518,-121.793895,-121.795273,-121.795192,-121.800216,-121.800926,-121.798646,-121.800331,-121.802162,-121.802325,-121.804756,-121.806559,-121.81069,-121.811566,-121.810189,-121.80941,-121.807491,-121.808206,-121.805763,-121.805488,-121.80419,-121.802244,-121.80273,-121.801352,-121.800054,-121.797945,-121.799432,-121.799566,-121.797991,-121.797622,-121.797993,-121.79865,-121.798969,-121.799036,-121.798805,-121.798435,-121.798296,-121.801092,-121.801611,-121.800563,-121.800936,-121.800345,-121.799241,-121.799675,-121.800929,-121.800402,-121.799562,-121.794599,-121.793238,-121.788859,-121.787179,-121.788944,-121.790022,-121.793329,-121.793604,-121.795481,-121.796635,-121.797009,-121.796565,-121.797651,-121.800479,-121.802922,-121.802109,-121.798174,-121.797833,-121.796704,-121.796107,-121.795797,-121.795864,-121.79528,-121.795643,-121.794385,-121.79695,-121.798109,-121.802682,-121.804597,-121.802779,-121.799458,-121.800219,-121.797222,-121.795075,-121.792298,-121.79161,-121.788525,-121.788203,-121.782569,-121.780168,-121.774175,-121.775652,-121.772321,-121.768218,-121.762002,-121.759958,-121.761005,-121.763225,-121.76661,-121.769206,-121.769125,-121.771593,-121.772449,-121.773183,-121.776323,-121.778305,-121.779924,-121.783621,-121.784961,-121.789999,-121.79151,-121.795963,-121.796831,-121.798998,-121.801536,-121.804413,-121.804304,-121.806653,-121.80762,-121.810296,-121.81202,-121.813655,-121.817386,-121.819137,-121.817809,-121.817212,-121.816436,-121.816517,-121.817693,-121.820254,-121.819663,-121.820278,-121.816998,-121.813663,-121.813063,-121.810174,-121.811363,-121.812221,-121.808137,-121.803883,-121.796409,-121.792116,-121.790183,-121.787132,-121.781753,-121.775926,-121.767978,-121.764831,-121.76252,-121.759991,-121.753589,-121.752994,-121.725068,-121.725068,-121.351973,-121.210841,-121.091897,-121.090568,-121.08948,-120.989505,-120.923309,-120.68959,-120.371441,-120.372635,-120.379053,-120.380711,-120.377062,-120.377797,-120.38353,-120.386035,-120.386498,-120.385489,-120.384813,-120.380814,-120.379005,-120.379794,-120.381376,-120.385877,-120.385062,-120.390987,-120.393173,-120.394109,-120.395872,-120.398292,-120.399226,-120.401654,-120.404676,-120.404685,-120.400743,-120.39737,-120.394668,-120.394254,-120.394825,-120.397984,-120.399248,-120.398603,-120.393046,-120.389667,-120.387782,-120.387452,-120.388118,-120.387642,-120.385687,-120.386378,-120.385768,-120.386561,-120.406743,-120.597275,-120.827555,-120.827552,-120.826899,-120.988824,-120.988375,-121.014525,-121.058034,-121.058352,-121.076748,-121.077844,-121.107534,-121.130934,-121.149644,-121.189792,-121.199971,-121.229289,-121.2293,-121.242113,-121.291112,-121.405495,-121.473293,-121.533117,-121.59326,-121.596883,-121.636001,-121.673699,-121.674928,-121.776324,-121.776324,-121.843138,-121.843218,-121.846123,-121.846756,-121.846519,-121.845128,-121.845745,-121.842528,-121.841332,-121.843244,-121.843146,-121.845531,-121.844403,-121.845334,-121.84552,-121.845745,-121.847561,-121.847578,-121.846191,-121.846615,-121.844711,-121.841535,-121.841128,-121.84291,-121.844408,-121.847502,-121.848677,-121.848139,-121.848791,-121.847291,-121.847634,-121.849462,-121.849512],"lat":[44.468364,44.470459,44.471833,44.473565,44.475957,44.479035,44.481512,44.483372,44.483275,44.484523,44.486706,44.488942,44.49109,44.491746,44.492775,44.495385,44.499335,44.502985,44.504256,44.50698,44.510048,44.511203,44.512045,44.512981,44.512108,44.513325,44.513812,44.514425,44.517546,44.519831,44.525157,44.527784,44.531585,44.534596,44.537376,44.539172,44.541745,44.54353,44.545235,44.546928,44.548444,44.551851,44.553353,44.555321,44.559782,44.562017,44.564929,44.566362,44.567833,44.570839,44.572228,44.573115,44.576399,44.579193,44.581321,44.582152,44.588985,44.592814,44.594056,44.596546,44.597702,44.600249,44.603152,44.605198,44.606225,44.608412,44.610439,44.611599,44.613731,44.61439,44.615767,44.617967,44.622239,44.623723,44.628211,44.631081,44.63302,44.633771,44.636033,44.63719,44.637365,44.639156,44.640313,44.643578,44.646223,44.64721,44.649507,44.650642,44.651538,44.652275,44.652762,44.653385,44.653849,44.654228,44.657456,44.660301,44.663489,44.665891,44.671413,44.672991,44.676467,44.67856,44.683013,44.683915,44.683929,44.685153,44.687063,44.689291,44.690417,44.6928,44.6946,44.696291,44.69753,44.698304,44.69837,44.699309,44.70078,44.703088,44.710685,44.711741,44.713707,44.713842,44.714077,44.714547,44.71558,44.716295,44.72052,44.724655,44.725896,44.727148,44.727671,44.729116,44.729236,44.730793,44.732713,44.735456,44.738266,44.741882,44.744269,44.746259,44.747845,44.748232,44.748893,44.750464,44.752723,44.754074,44.759964,44.76137,44.760886,44.762326,44.765293,44.767292,44.766914,44.769111,44.769993,44.772141,44.775136,44.775636,44.77416,44.77555,44.775543,44.772641,44.771856,44.773281,44.772311,44.772848,44.776675,44.778183,44.779277,44.777548,44.779078,44.780597,44.782159,44.78228,44.781509,44.784404,44.786813,44.7898,44.790637,44.791602,44.792548,44.792964,44.793037,44.79466,44.795847,44.800134,44.803173,44.80399,44.805407,44.806377,44.807869,44.811574,44.811634,44.81217,44.812002,44.813004,44.815433,44.815469,44.818958,44.819846,44.819734,44.820267,44.824633,44.82543,44.828908,44.829919,44.829919,44.825519,44.8247,44.825067,44.825098,44.824093,44.823272,44.823135,44.822996,44.822491,44.821769,44.82037,44.819357,44.817938,44.814826,44.812034,44.8119,44.810985,44.809966,44.809674,44.807041,44.807352,44.806314,44.80298,44.800721,44.798474,44.796406,44.795784,44.797013,44.802712,44.803969,44.802357,44.799835,44.797861,44.794719,44.792695,44.789951,44.788414,44.786038,44.784272,44.782665,44.78073,44.778767,44.776973,44.773307,44.771638,44.769866,44.767886,44.763229,44.761979,44.761175,44.653068,44.578606,44.564009,44.564036,44.563012,44.562793,44.562604,44.476499,44.476484,44.390265,44.390325,44.390428,44.390474,44.390427,44.390531,44.3906,44.390635,44.390647,44.390621,44.390631,44.390646,44.393036,44.392954,44.392893,44.393153,44.393464,44.393184,44.392612,44.392578,44.392413,44.393383,44.393387,44.393402,44.392829,44.39263,44.395459,44.398504,44.4022,44.404103,44.407373,44.408824,44.409387,44.41103,44.4118,44.413395,44.414634,44.417873,44.420456,44.424733,44.426582,44.428753,44.430542,44.431791,44.433879,44.437707,44.441974,44.444912,44.447288,44.451388,44.454743,44.458411,44.459549,44.461925,44.462899,44.464364,44.466672,44.468364]}]],[[{"lng":[-122.289972,-122.28747,-122.287458,-122.287177,-122.28769,-122.287686,-122.287818,-122.284689,-122.283449,-122.283778,-122.283792,-122.282708,-122.28273,-122.282622,-122.282585,-122.282245,-122.119656,-122.076261,-122.08045,-122.083097,-122.086152,-122.087905,-122.09102,-122.093776,-122.093953,-122.092989,-122.091829,-122.092132,-122.089048,-122.086957,-122.08859,-122.086627,-122.08697,-122.08664,-122.084436,-122.083111,-122.082668,-122.08346,-122.081345,-122.079883,-122.077287,-122.077133,-122.076045,-122.075297,-122.071996,-122.068737,-122.065175,-122.064263,-122.064303,-122.065324,-122.066487,-122.067115,-122.065992,-122.066281,-122.065023,-122.06047,-122.057458,-122.055484,-122.053544,-122.054283,-122.052383,-122.053175,-122.054621,-122.05417,-122.052183,-122.051025,-122.048329,-122.047031,-122.045526,-122.044583,-122.042643,-122.040172,-122.038962,-122.039694,-122.039964,-122.040977,-122.03966,-122.034519,-122.033634,-122.034014,-122.037333,-122.038408,-122.03965,-122.040718,-122.040658,-122.039396,-122.037335,-122.034178,-122.028174,-122.02634,-122.024834,-122.023229,-122.018876,-122.015876,-122.014804,-122.013759,-122.011983,-122.010682,-122.006618,-122.003126,-122.001997,-122.001265,-121.999218,-121.996857,-121.996478,-121.992757,-121.992743,-121.98966,-121.988228,-121.98518,-121.979423,-121.97532,-121.974199,-121.976391,-121.980554,-121.982424,-121.9839,-121.984575,-121.986399,-121.987774,-121.992765,-121.994513,-121.999904,-122.001332,-122.006263,-122.00765,-122.008778,-122.009532,-122.008532,-122.009075,-122.008467,-122.005582,-122.003164,-122.001443,-121.999293,-122.000957,-122.001748,-122.008646,-122.012305,-122.013078,-122.01326,-122.015941,-122.015598,-122.012945,-122.012157,-122.009233,-122.009346,-122.008208,-122.010144,-122.010789,-122.010403,-122.01216,-122.013147,-122.015812,-122.017972,-122.020536,-122.021663,-122.021803,-122.025284,-122.028001,-122.030376,-122.033694,-122.031057,-122.030513,-122.029159,-122.029958,-122.032684,-122.033982,-122.039166,-122.042212,-122.044577,-122.047945,-122.048876,-122.051658,-122.053217,-122.056221,-122.057121,-122.05949,-122.06024,-122.062266,-122.062769,-122.062446,-122.05922,-122.0571,-122.060407,-122.062799,-122.063256,-122.064155,-122.067515,-122.073062,-122.074132,-122.077115,-122.081246,-122.083154,-122.085681,-122.085903,-122.084586,-122.084678,-122.088043,-122.091182,-122.091581,-122.093408,-122.095125,-122.096658,-122.099629,-122.101598,-122.101702,-122.106436,-122.108581,-122.111765,-122.113959,-122.117102,-122.118494,-122.120581,-122.123909,-122.126425,-122.128491,-122.129916,-122.132883,-122.133328,-122.131782,-122.132034,-122.132435,-122.13754,-122.138814,-122.140676,-122.14345,-122.14421,-122.147305,-122.149927,-122.15296,-122.151573,-122.148739,-122.146301,-122.147339,-122.145365,-122.138621,-122.136912,-122.138978,-122.138412,-122.136458,-122.137364,-122.13888,-122.140161,-122.140492,-122.138917,-122.136871,-122.135334,-122.13445,-122.134547,-122.132848,-122.132331,-122.133356,-122.133046,-122.131417,-122.130937,-122.133547,-122.133453,-122.130529,-122.128721,-122.130579,-122.129678,-122.129797,-122.131583,-122.132474,-122.138758,-122.142355,-122.145139,-122.147726,-122.148688,-122.149534,-122.147807,-122.146222,-122.146991,-122.144946,-122.143532,-122.140274,-122.140082,-122.141768,-122.142867,-122.142806,-122.140828,-122.139145,-122.138746,-122.136349,-122.135109,-122.133674,-122.133128,-122.131616,-122.131009,-122.129193,-122.12716,-122.125264,-122.124336,-122.116677,-122.112224,-122.110753,-122.109553,-122.106566,-122.105215,-122.103544,-122.099228,-122.096613,-122.094779,-122.094982,-122.093513,-122.092318,-122.086742,-122.0826,-122.080848,-122.078379,-122.076149,-122.071291,-122.070284,-122.072724,-122.071531,-122.067707,-122.064361,-122.061334,-122.059263,-122.056872,-122.049781,-122.047708,-122.046115,-122.042529,-122.04094,-122.038966,-122.035993,-122.034958,-122.02914,-122.026748,-122.020002,-122.016941,-122.013037,-122.010965,-122.003068,-122.002362,-121.642987,-121.600018,-121.547864,-121.464437,-121.398498,-121.39767,-121.332969,-121.332609,-121.332413,-121.348471,-121.349247,-121.349315,-121.3513,-121.35055,-121.35053,-121.350007,-121.349679,-121.131887,-120.996685,-120.996696,-120.899236,-120.883327,-120.882106,-120.882106,-120.880436,-120.880501,-120.879805,-120.879925977229,-120.940201,-120.980416,-121.022114,-121.080956,-121.111238326886,-121.125007,-121.174152,-121.250331958387,-121.297304,-121.31648631619,-121.328988,-121.344911,-121.356649,-121.435531,-121.447537949131,-121.518985,-121.519526386293,-121.591106,-121.600214645464,-121.600302875257,-121.680618944726,-121.69468,-121.800981,-121.825079635986,-121.889217528984,-121.88925504236,-121.939829,-121.954084502429,-121.95743,-122.034563,-122.047234,-122.144058,-122.163511,-122.189401401612,-122.260687,-122.284835725791,-122.289748006076,-122.289972],"lat":[42.127156,42.127168,42.202994,42.288838,42.392086,42.395348,42.4745,42.4745,42.707455,42.901702,42.910926,42.910928,42.996499,43.056265,43.067719,43.06772,43.067757,43.067744,43.069772,43.069841,43.072046,43.072155,43.073641,43.076257,43.077449,43.082238,43.083706,43.086837,43.090462,43.091483,43.094927,43.096334,43.098894,43.100431,43.101539,43.103033,43.104749,43.10851,43.1135,43.115911,43.1177,43.120005,43.122069,43.126545,43.129445,43.131102,43.135701,43.140814,43.143377,43.146062,43.147204,43.149964,43.150872,43.152756,43.15248,43.154236,43.15582,43.156334,43.157965,43.162171,43.164577,43.167235,43.168662,43.172116,43.174665,43.176881,43.178552,43.181278,43.183103,43.186757,43.187293,43.189496,43.191598,43.193526,43.196262,43.197659,43.199921,43.205333,43.206901,43.207857,43.211156,43.213191,43.214102,43.216623,43.218136,43.218581,43.217497,43.218674,43.219886,43.221535,43.221998,43.224582,43.226832,43.226904,43.228348,43.232005,43.234109,43.234593,43.234065,43.23423,43.234752,43.236587,43.238929,43.239893,43.24262,43.248354,43.251153,43.253139,43.254846,43.25735,43.259784,43.260981,43.261693,43.262296,43.26518,43.268887,43.27039,43.27353,43.27473,43.277653,43.279401,43.280439,43.281121,43.281696,43.285971,43.288227,43.291051,43.294341,43.296048,43.298773,43.30118,43.302549,43.304723,43.307618,43.308993,43.310469,43.312566,43.317236,43.317991,43.31895,43.32131,43.324152,43.325457,43.327747,43.329023,43.331929,43.33516,43.337374,43.340257,43.342685,43.344697,43.345646,43.347589,43.350868,43.352741,43.358409,43.359378,43.362042,43.361911,43.360013,43.358849,43.35665,43.360048,43.361626,43.363153,43.364558,43.366071,43.368514,43.370607,43.372241,43.37526,43.377492,43.377553,43.379996,43.380888,43.381459,43.383771,43.386782,43.390573,43.39268,43.394378,43.395276,43.398562,43.399646,43.400716,43.403898,43.405868,43.406547,43.407003,43.409675,43.410852,43.412149,43.414465,43.418402,43.419318,43.420242,43.421641,43.422579,43.423647,43.426736,43.42882,43.429284,43.427893,43.425298,43.425947,43.425083,43.428032,43.429801,43.429219,43.429089,43.431354,43.431977,43.432837,43.435399,43.434663,43.435349,43.435234,43.436162,43.436528,43.437293,43.439396,43.440221,43.441124,43.443167,43.444501,43.444947,43.444169,43.442832,43.442479,43.444354,43.447662,43.448708,43.449351,43.450923,43.452654,43.45489,43.45514,43.456339,43.456987,43.459132,43.460686,43.461777,43.461778,43.463835,43.466716,43.467514,43.467445,43.468423,43.472069,43.47356,43.476034,43.478185,43.479701,43.482811,43.483834,43.485057,43.489966,43.491401,43.491969,43.496887,43.499774,43.503594,43.505694,43.507323,43.510434,43.511821,43.513285,43.513576,43.515463,43.519057,43.520693,43.523017,43.523617,43.525509,43.52841,43.528421,43.529683,43.530775,43.534465,43.535952,43.53711,43.540482,43.541944,43.543161,43.544544,43.549437,43.551491,43.553278,43.55495,43.557284,43.557376,43.558293,43.55993,43.561938,43.562447,43.56549,43.565274,43.567709,43.569273,43.572977,43.574486,43.574987,43.574618,43.575654,43.576825,43.579215,43.579642,43.579584,43.577615,43.577326,43.577964,43.579643,43.579585,43.581616,43.584945,43.58775,43.58775,43.587403,43.589719,43.590297,43.59192,43.594581,43.597881,43.597823,43.599211,43.600817,43.601615,43.601758,43.602452,43.603609,43.604822,43.606611,43.609916,43.609162,43.609274,43.614657,43.615498,43.616648,43.616443,43.616497,43.616607,43.616218,43.616295,43.616645,43.473058,43.356663,43.356753,43.111683,43.089928,42.919989,42.919989,42.91669,42.833905,42.746644,42.746775,42.746349,42.743688,42.743806,42.744214,42.486559,42.483262,42.483263,42.428587,41.996882,41.9937643415584,41.993492,41.993023,41.993308,41.995314,41.995871512136,41.996125,41.997228,41.9973071788576,41.997356,41.997018172313,41.996798,41.996214,41.996493,41.997327,41.9974692924328,41.998316,41.9983223656297,41.999164,41.9992909902104,41.9992922202857,42.0004119646647,42.000608,42.002122,42.0024146243105,42.0031934363034,42.0031938918199,42.003808,42.0035463939955,42.003485,42.004696,42.005339,42.006552,42.007264,42.0073583154912,42.007618,42.0080194929245,42.0081011637255,42.127156]}]],[[{"lng":[-121.108335,-121.108065,-121.107534,-121.077844,-121.076748,-121.058352,-121.058034,-121.014525,-120.988375,-120.988824,-120.826899,-120.827552,-120.827555,-120.597275,-120.406743,-120.386561,-120.387186,-120.385775,-120.386074,-120.36646,-120.143544,-120.101166,-120.021621,-120.020708,-120.010547,-120.000617,-119.970532,-119.960375,-119.899283,-119.899002,-119.655517,-119.654993,-119.656838,-119.657183,-119.775402,-119.777528,-119.897434,-120.237934,-120.257777,-120.258386,-120.298364,-120.378107,-120.37874,-120.747848,-120.748249,-120.918109,-120.986587,-120.986955,-120.987084,-120.987271,-121.028358,-121.09243,-121.102773,-121.102781,-121.102791,-121.102883,-121.102938,-121.108537,-121.108335],"lat":[44.26204,44.32718,44.3906,44.390531,44.390427,44.390474,44.390428,44.390325,44.390265,44.476484,44.476499,44.562604,44.562793,44.563012,44.564036,44.564009,44.476624,44.476624,44.436083,44.437015,44.437751,44.43821,44.438793,44.389687,44.389727,44.389104,44.388968,44.389457,44.389575,44.30662,44.307045,44.220276,44.220277,43.95892,43.959086,43.697957,43.6982,43.697376,43.698762,43.785297,43.785545,43.785429,43.872362,43.871331,43.95731,43.959365,43.960852,44.047637,44.076292,44.134026,44.135452,44.137751,44.138125,44.169238,44.17139,44.20241,44.218487,44.218519,44.26204]}]],[[{"lng":[-118.697766,-118.656251,-118.656266,-118.633925,-118.613243,-118.613254,-118.613107,-118.577354,-118.572271,-118.536194,-118.506296,-118.506172,-118.469471,-118.428329,-118.428539,-118.428539,-118.404806,-118.404849,-118.392817,-118.38422,-118.384117,-118.366522,-118.366326,-118.267614,-118.241665,-118.241668,-118.197876,-118.197955,-118.117464,-118.116461,-118.116362,-118.116355,-118.116309,-118.11836,-118.116844,-118.117121,-118.117194,-118.066383,-118.066513,-118.066465,-118.066506,-118.054666,-118.045102,-118.045003,-117.972948,-117.97298,-117.747327,-117.747405,-117.747464,-117.74765,-117.788395,-117.787623,-117.766865,-117.767063,-117.746137,-117.745959,-117.730633,-117.727225,-117.727235,-117.683986,-117.683794,-117.683951,-117.68379,-117.664146,-117.663391,-117.643485,-117.643494,-117.622777,-117.622801,-117.582344,-117.582674,-117.582166,-117.562208,-117.561969,-117.542058,-117.542216,-117.522249,-117.522313,-117.520674,-117.520941,-117.501432,-117.496311,-117.476762,-117.476684,-117.373361,-117.320193,-117.266006,-117.266006,-117.266005,-117.313239,-117.368183,-117.379472,-117.381873,-117.563486,-117.563402,-117.564033,-117.747664,-117.777504,-117.779549,-117.78438,-117.784917,-117.784223,-117.784287,-117.780449,-117.778261,-117.778664,-117.77942,-117.781825,-117.784715,-117.786109,-117.790617,-117.791738,-117.794182,-117.793112,-117.795976,-117.794825,-117.795624,-117.793626,-117.793905,-117.795811,-117.797179,-117.794612,-117.793418,-117.795212,-117.796519,-117.797076,-117.799062,-117.798106,-117.799102,-117.801591,-117.803038,-117.804671,-117.802486,-117.803614,-117.805343,-117.803943,-117.80439,-117.805679,-117.807106,-117.809642,-117.812501,-117.813232,-117.810901,-117.812384,-117.810499,-117.810347,-117.81202,-117.814507,-117.818062,-117.827784,-117.827377,-117.828819,-117.834022,-117.838224,-117.840934,-117.840601,-117.837244,-117.83775,-117.83989,-117.841727,-117.844909,-117.84433,-117.842069,-117.84343,-117.850204,-117.850462,-117.853788,-117.858127,-117.859832,-117.862058,-117.868648,-117.870438,-117.871887,-117.873734,-117.873396,-117.881163,-117.884041,-117.88527,-117.885361,-117.888408,-117.885732,-117.886506,-117.890152,-117.890515,-117.894708,-117.894074,-117.897252,-117.896386,-117.900497,-117.901443,-117.903603,-117.906142,-117.911901,-117.912473,-117.913393,-117.914198,-117.915266,-117.917055,-117.917634,-117.918603,-117.920378,-117.922093,-117.921696,-117.925714,-117.92723,-117.928321,-117.931873,-117.933931,-117.93636,-117.937296,-117.940522,-117.942835,-117.944977,-117.946243,-117.9477,-117.950925,-117.952633,-117.956183,-117.958124,-117.965211,-117.968688,-117.97216,-117.975378,-117.977728,-117.982631,-117.985755,-117.990182,-117.993112,-117.998992,-118.000318,-118.00333,-118.006843,-118.007344,-118.009949,-118.016228,-118.022745,-118.028283,-118.032237,-118.037125,-118.041949,-118.044232,-118.046279,-118.051814,-118.057584,-118.060105,-118.063637,-118.064404,-118.06955,-118.0717,-118.074772,-118.077997,-118.080456,-118.086523,-118.088982,-118.089673,-118.091286,-118.09213,-118.094052,-118.096972,-118.098817,-118.100661,-118.102659,-118.10804,-118.108962,-118.110422,-118.115495,-118.11925,-118.126328,-118.128407,-118.130351,-118.136551,-118.137729,-118.138203,-118.139929,-118.141185,-118.140482,-118.140876,-118.142367,-118.148405,-118.154916,-118.15578,-118.155076,-118.156488,-118.161036,-118.164484,-118.166758,-118.169815,-118.172167,-118.175223,-118.17687,-118.178908,-118.184709,-118.192549,-118.194901,-118.197174,-118.200232,-118.201486,-118.203838,-118.206973,-118.209168,-118.211519,-118.214184,-118.214497,-118.21246,-118.212459,-118.213556,-118.213478,-118.212772,-118.214731,-118.213634,-118.213869,-118.217081,-118.219197,-118.220763,-118.220371,-118.223192,-118.223739,-118.225462,-118.227421,-118.228047,-118.229691,-118.231806,-118.232658,-118.232165,-118.232197,-118.245136,-118.244662,-118.251326,-118.254562,-118.256409,-118.260454,-118.263148,-118.264747,-118.267939,-118.270121,-118.272668,-118.274333,-118.276006,-118.277008,-118.278403,-118.280496,-118.28229,-118.282246,-118.284328,-118.286304,-118.287892,-118.290194,-118.292543,-118.296386,-118.299031,-118.298941,-118.299819,-118.302714,-118.304524,-118.305238,-118.307603,-118.308807,-118.308527,-118.311985,-118.314562,-118.315687,-118.318969,-118.320187,-118.321271,-118.323544,-118.324554,-118.329464,-118.32962,-118.331747,-118.3346,-118.336217,-118.339081,-118.342078,-118.34662,-118.350693,-118.351765,-118.356323,-118.356759,-118.358389,-118.359455,-118.364214,-118.366738,-118.367815,-118.368541,-118.370856,-118.373475,-118.375376,-118.378083,-118.380085,-118.381016,-118.386538,-118.387501,-118.38708,-118.387479,-118.390619,-118.390399,-118.389864,-118.392626,-118.39477,-118.39872,-118.40065,-118.404535,-118.405273,-118.408772,-118.411093,-118.416289,-118.418766,-118.42272,-118.425078,-118.430751,-118.433878,-118.4361,-118.439339,-118.438286,-118.437099,-118.438268,-118.438524,-118.437462,-118.437612,-118.436403,-118.437351,-118.44167,-118.444209,-118.445887,-118.446726,-118.446315,-118.448093,-118.452852,-118.456019,-118.457035,-118.464283,-118.469023,-118.469598,-118.468871,-118.518689,-118.519022,-118.518687,-118.547652,-118.546632,-118.655992,-118.656102,-118.696986,-118.697013,-118.697766],"lat":[45.345647,45.345146,45.340337,45.340006,45.339884,45.345788,45.354951,45.354773,45.354767,45.354518,45.354632,45.354867,45.355164,45.35519,45.428951,45.429076,45.429013,45.44255,45.442554,45.44258,45.435246,45.43531,45.428951,45.429103,45.428841,45.427391,45.427204,45.4704,45.470702,45.470732,45.49282,45.498842,45.514652,45.514664,45.600729,45.673797,45.688607,45.688395,45.737574,45.769522,45.77346,45.773563,45.773538,45.817073,45.816896,45.860595,45.861072,45.850523,45.833238,45.773625,45.773515,45.689567,45.689605,45.660227,45.660736,45.616635,45.61692,45.61699,45.51478,45.51523,45.506771,45.441917,45.428365,45.428344,45.365749,45.365322,45.33687,45.336789,45.338171,45.338096,45.324359,45.310184,45.310219,45.295879,45.295956,45.267424,45.267731,45.253458,45.223598,45.209768,45.210148,45.209977,45.209973,45.166539,45.16654,45.166537,45.166539,45.152442,45.08057,45.080581,45.080569,45.079993,45.079997,45.079446,45.036118,44.992866,44.992426,44.992161,44.995244,44.995675,44.998322,44.999668,45.003714,45.005572,45.007621,45.009631,45.01143,45.013583,45.014289,45.013987,45.014854,45.016317,45.016682,45.018583,45.018489,45.020454,45.021648,45.022058,45.023142,45.02278,45.023925,45.023959,45.025795,45.026273,45.025335,45.026679,45.026766,45.028164,45.029284,45.02915,45.02718,45.028184,45.029705,45.030495,45.029481,45.031851,45.032625,45.032832,45.031655,45.032445,45.032274,45.030655,45.028808,45.027532,45.026711,45.025607,45.024511,45.024491,45.025909,45.033314,45.035472,45.037596,45.042113,45.04804,45.050658,45.051643,45.052819,45.055138,45.055136,45.054096,45.054797,45.056057,45.057026,45.058477,45.059736,45.060351,45.060443,45.059753,45.055712,45.054525,45.05758,45.060146,45.064703,45.065639,45.060713,45.059622,45.060095,45.058249,45.056709,45.0571,45.051089,45.049436,45.048706,45.047569,45.04524,45.043706,45.039581,45.037917,45.036321,45.034604,45.033156,45.030232,45.028008,45.028207,45.027236,45.026847,45.026033,45.025357,45.024736,45.024485,45.023006,45.020889,45.019079,45.016939,45.016787,45.015197,45.013626,45.014081,45.0125,45.012767,45.009324,45.008418,45.006667,45.006698,45.006582,45.004881,45.002967,45.000952,45.000621,44.997626,44.995908,44.99617,44.995873,44.994951,44.995409,44.99459,44.99525,44.994448,44.994348,44.994876,44.99484,44.996376,44.997415,44.997644,45.000595,45.001635,45.003403,45.003881,45.004007,45.006961,45.006868,45.00991,45.012785,45.012569,45.012924,45.014088,45.015179,45.016873,45.019598,45.021068,45.024723,45.025648,45.032029,45.033716,45.036878,45.038568,45.041238,45.042327,45.04233,45.044892,45.044347,45.045602,45.046198,45.046801,45.046962,45.045162,45.044761,45.044444,45.045214,45.045024,45.040799,45.040018,45.036458,45.035513,45.033844,45.031677,45.02945,45.027725,45.026728,45.022278,45.020442,45.018775,45.017883,45.015711,45.016657,45.016103,45.017161,45.017105,45.019388,45.019389,45.017995,45.019389,45.017997,45.017329,45.015325,45.015104,45.013155,45.01232,45.010203,45.010094,45.008201,45.007421,45.006585,45.005306,45.00108,44.999353,44.996519,44.995073,44.991343,44.990567,44.989174,44.988505,44.987447,44.984888,44.983722,44.981549,44.979158,44.977488,44.976652,44.973481,44.97237,44.969921,44.966976,44.963285,44.960686,44.960686,44.958396,44.956351,44.956457,44.956934,44.956655,44.958896,44.95929,44.958731,44.957313,44.957659,44.957348,44.957896,44.96023,44.961771,44.962104,44.963114,44.964726,44.964459,44.965046,44.964509,44.962755,44.962913,44.960768,44.96063,44.963426,44.963839,44.968559,44.968488,44.969209,44.969659,44.970771,44.972016,44.971568,44.972586,44.974252,44.975929,44.975415,44.973044,44.972832,44.971889,44.972329,44.973393,44.975827,44.976675,44.978879,44.979593,44.983748,44.986988,44.987332,44.987824,44.988214,44.990605,44.992174,44.992301,44.990763,44.986714,44.985957,44.984037,44.982434,44.981597,44.981894,44.980115,44.979488,44.98129,44.983712,44.983786,44.980483,44.979407,44.97756,44.974115,44.972402,44.972544,44.973976,44.97436,44.975912,44.976476,44.975031,44.973309,44.971192,44.968752,44.967006,44.965656,44.963809,44.963891,44.96256,44.96242,44.96625,44.968054,44.971665,44.975192,44.977115,44.978587,44.980277,44.98298,44.984781,44.985326,44.986752,44.986767,44.988471,44.990024,44.990623,44.989289,44.989514,44.990257,44.989822,44.991737,44.992707,44.995176,44.995877,45.010173,45.08069,45.080753,45.196898,45.196928,45.257729,45.257715,45.259928,45.345647]}]],[[{"lng":[-124.214477,-124.210531,-124.210203396979,-124.208958,-124.206343,-124.206343,-124.206343,-124.200217,-124.193623,-124.193984,-124.177685,-124.16856,-124.164503939476,-124.158728145934,-124.138807,-124.104167,-124.102125,-124.101667,-124.098533,-124.064614,-124.064585,-124.025781,-124.005944,-123.98581,-123.96592,-123.946294,-123.946529,-123.934708,-123.925479,-123.926089,-123.925917,-123.916158,-123.907166,-123.902391,-123.902195,-123.897407,-123.897197,-123.882804,-123.882553,-123.877749,-123.877485,-123.872667,-123.872566,-123.872399,-123.862685,-123.862381,-123.852602,-123.852268,-123.847397,-123.847057,-123.842136,-123.842059,-123.837143,-123.837073,-123.832118,-123.831984,-123.827036,-123.827004,-123.81007,-123.75871,-123.734733,-123.7038,-123.703628,-123.658767,-123.658909,-123.619012,-123.619621,-123.619367,-123.619574,-123.57958,-123.579689,-123.529005,-123.529153,-123.470251,-123.470371,-123.411426,-123.397831,-123.3482,-123.348246,-123.313129,-123.312001,-123.185986,-123.153653,-123.147539,-123.137319,-123.138001,-123.137646,-123.137588,-123.13733,-123.137211,-123.107318,-123.107672,-123.107475,-122.987626,-122.987618,-122.970915,-122.935501,-122.932533,-122.9124,-122.892765,-122.833744,-122.781518,-122.776409,-122.771564,-122.741845,-122.741914,-122.741317,-122.741716,-122.622946,-122.622914,-122.508438,-122.508441,-122.447124,-122.27067,-122.270653,-122.132034,-122.131782,-122.133328,-122.132883,-122.129916,-122.128491,-122.126425,-122.123909,-122.120581,-122.118494,-122.117102,-122.113959,-122.111765,-122.108581,-122.106436,-122.101702,-122.101598,-122.099629,-122.096658,-122.095125,-122.093408,-122.091581,-122.091182,-122.088043,-122.084678,-122.084586,-122.085903,-122.085681,-122.083154,-122.081246,-122.077115,-122.074132,-122.073062,-122.067515,-122.064155,-122.063256,-122.062799,-122.060407,-122.0571,-122.05922,-122.062446,-122.062769,-122.062266,-122.06024,-122.05949,-122.057121,-122.056221,-122.053217,-122.051658,-122.048876,-122.047945,-122.044577,-122.042212,-122.039166,-122.033982,-122.032684,-122.029958,-122.029159,-122.030513,-122.031057,-122.033694,-122.030376,-122.028001,-122.025284,-122.021803,-122.021663,-122.020536,-122.017972,-122.015812,-122.013147,-122.01216,-122.010403,-122.010789,-122.010144,-122.008208,-122.009346,-122.009233,-122.012157,-122.012945,-122.015598,-122.015941,-122.01326,-122.013078,-122.012305,-122.008646,-122.001748,-122.000957,-121.999293,-122.001443,-122.003164,-122.005582,-122.008467,-122.009075,-122.008532,-122.009532,-122.008778,-122.00765,-122.006263,-122.001332,-121.999904,-121.994513,-121.992765,-121.987774,-121.986399,-121.984575,-121.9839,-121.982424,-121.980554,-121.976391,-121.974199,-121.97532,-121.979423,-121.98518,-121.988228,-121.98966,-121.992743,-121.992757,-121.996478,-121.996857,-121.999218,-122.001265,-122.001997,-122.003126,-122.006618,-122.010682,-122.011983,-122.013759,-122.014804,-122.015876,-122.018876,-122.023229,-122.024834,-122.02634,-122.028174,-122.034178,-122.037335,-122.039396,-122.040658,-122.040718,-122.03965,-122.038408,-122.037333,-122.034014,-122.033634,-122.034519,-122.03966,-122.040977,-122.039964,-122.039694,-122.038962,-122.040172,-122.042643,-122.044583,-122.045526,-122.047031,-122.048329,-122.051025,-122.052183,-122.05417,-122.054621,-122.053175,-122.052383,-122.054283,-122.053544,-122.055484,-122.057458,-122.06047,-122.065023,-122.066281,-122.065992,-122.067115,-122.066487,-122.065324,-122.064303,-122.064263,-122.065175,-122.068737,-122.071996,-122.075297,-122.076045,-122.077133,-122.077287,-122.079883,-122.081345,-122.08346,-122.082668,-122.083111,-122.084436,-122.08664,-122.08697,-122.086627,-122.08859,-122.086957,-122.089048,-122.092132,-122.091829,-122.092989,-122.093953,-122.093776,-122.09102,-122.087905,-122.086152,-122.083097,-122.08045,-122.076261,-122.119656,-122.282245,-122.282585,-122.282622,-122.28273,-122.385922,-122.40031,-122.401025,-122.401041,-122.401077,-122.420844,-122.420863,-122.440535,-122.440505,-122.46021,-122.460224,-122.520525,-122.520741,-122.560273,-122.560299,-122.580049,-122.580094,-122.600202,-122.600251,-122.621665,-122.637812,-122.637695,-122.677181,-122.677198,-122.697017,-122.69701,-122.716657,-122.716699,-122.736329,-122.736367,-122.756033,-122.756079,-122.775223,-122.775044,-122.784914,-122.785493,-122.794811,-122.794776,-122.814413,-122.833971,-122.853707,-122.852943,-122.868692,-122.911925,-122.9178,-122.93175,-122.9451,-122.951199,-122.95119,-122.970829,-122.970492,-122.990035,-122.990728,-123.009744,-123.009765,-123.112688,-123.112652,-123.152233,-123.152023,-123.180512,-123.180551,-123.190456,-123.190504,-123.200419,-123.200424,-123.209912,-123.210392,-123.229635,-123.229619,-123.249209,-123.249328,-123.27426,-123.274283,-123.309197,-123.309162,-123.328626,-123.328588,-123.347048,-123.366666,-123.36665,-123.371581,-123.371999,-123.400242,-123.401297,-123.4014,-123.406341,-123.406299,-123.425721,-123.425687,-123.431052,-123.444922,-123.445456,-123.455213,-123.455304,-123.465271,-123.465261,-123.484693,-123.494304,-123.494414,-123.523444,-123.542539,-123.542433,-123.562168,-123.562086,-123.567036,-123.566777,-123.571728,-123.571814,-123.581862,-123.581699,-123.677275,-123.677206,-123.687082,-123.687089,-123.697,-123.696843,-123.701384,-123.716505,-123.716492,-123.716495,-123.720137,-123.723188,-123.726832,-123.732315,-123.734082,-123.735741,-123.739229,-123.740093,-123.741725,-123.743493,-123.746879,-123.750436,-123.752421,-123.754526,-123.756486,-123.759427,-123.761476,-123.764019,-123.766112,-123.76995,-123.773571,-123.778041,-123.780349,-123.783304,-123.789263,-123.7917,-123.795111,-123.796456,-123.796749,-123.799136,-123.800083,-123.800444,-123.803732,-123.806976,-123.808536,-123.811553,-123.811789,-123.820439,-123.819144,-123.81915,-123.819496,-123.820515,-123.821513,-123.821121,-123.821118,-123.761594,-123.761384,-123.761333,-123.707057,-123.707059,-123.702144,-123.702139,-123.702131,-123.702167,-123.703655,-123.703417,-123.703568,-123.703862,-123.704456,-123.704752,-123.764356,-123.764339,-123.763917,-123.764496,-123.762289,-123.761983,-123.762801,-123.761528,-123.764884,-123.769016,-123.817614,-123.817154,-123.816657,-123.875628,-123.875698,-123.949573,-123.949565,-123.979004,-124.062969,-124.100765,-124.146347,-124.180894,-124.183435,-124.218966377223,-124.214477],"lat":[43.627619,43.653347,43.6547163514708,43.659922,43.666628,43.6691103603323,43.674021,43.689555,43.706137,43.706674,43.767228,43.808955,43.8315479200854,43.8637200341693,43.863611,43.863289,43.863417,43.86343,43.863512,43.86421,43.862277,43.862224,43.862996,43.862001,43.863042,43.862737,43.871689,43.866012,43.865947,43.878689,43.898476,43.897322,43.896252,43.896281,43.900512,43.900512,43.904714,43.904582,43.908714,43.908629,43.91275,43.912655,43.914097,43.916733,43.916562,43.920658,43.920553,43.924682,43.924661,43.928822,43.928878,43.932429,43.932458,43.935984,43.935987,43.94308,43.94305,43.944837,43.944581,43.943882,43.944062,43.944319,43.937399,43.936474,43.921672,43.921117,43.906509,43.899074,43.891672,43.891057,43.868291,43.86833,43.830061,43.831183,43.810056,43.809877,43.809076,43.809212,43.78017,43.77991,43.77991,43.779533,43.779631,43.779635,43.77967,43.753648,43.736284,43.677086,43.649355,43.605906,43.605889,43.542099,43.540013,43.538988,43.540992,43.541679,43.54417,43.544357,43.543886,43.544882,43.544702,43.543912,43.544034,43.544317,43.544654,43.517582,43.452015,43.437395,43.438458,43.440262,43.440226,43.441275,43.44141,43.441628,43.440011,43.440221,43.439396,43.437293,43.436528,43.436162,43.435234,43.435349,43.434663,43.435399,43.432837,43.431977,43.431354,43.429089,43.429219,43.429801,43.428032,43.425083,43.425947,43.425298,43.427893,43.429284,43.42882,43.426736,43.423647,43.422579,43.421641,43.420242,43.419318,43.418402,43.414465,43.412149,43.410852,43.409675,43.407003,43.406547,43.405868,43.403898,43.400716,43.399646,43.398562,43.395276,43.394378,43.39268,43.390573,43.386782,43.383771,43.381459,43.380888,43.379996,43.377553,43.377492,43.37526,43.372241,43.370607,43.368514,43.366071,43.364558,43.363153,43.361626,43.360048,43.35665,43.358849,43.360013,43.361911,43.362042,43.359378,43.358409,43.352741,43.350868,43.347589,43.345646,43.344697,43.342685,43.340257,43.337374,43.33516,43.331929,43.329023,43.327747,43.325457,43.324152,43.32131,43.31895,43.317991,43.317236,43.312566,43.310469,43.308993,43.307618,43.304723,43.302549,43.30118,43.298773,43.296048,43.294341,43.291051,43.288227,43.285971,43.281696,43.281121,43.280439,43.279401,43.277653,43.27473,43.27353,43.27039,43.268887,43.26518,43.262296,43.261693,43.260981,43.259784,43.25735,43.254846,43.253139,43.251153,43.248354,43.24262,43.239893,43.238929,43.236587,43.234752,43.23423,43.234065,43.234593,43.234109,43.232005,43.228348,43.226904,43.226832,43.224582,43.221998,43.221535,43.219886,43.218674,43.217497,43.218581,43.218136,43.216623,43.214102,43.213191,43.211156,43.207857,43.206901,43.205333,43.199921,43.197659,43.196262,43.193526,43.191598,43.189496,43.187293,43.186757,43.183103,43.181278,43.178552,43.176881,43.174665,43.172116,43.168662,43.167235,43.164577,43.162171,43.157965,43.156334,43.15582,43.154236,43.15248,43.152756,43.150872,43.149964,43.147204,43.146062,43.143377,43.140814,43.135701,43.131102,43.129445,43.126545,43.122069,43.120005,43.1177,43.115911,43.1135,43.10851,43.104749,43.103033,43.101539,43.100431,43.098894,43.096334,43.094927,43.091483,43.090462,43.086837,43.083706,43.082238,43.077449,43.076257,43.073641,43.072155,43.072046,43.069841,43.069772,43.067744,43.067757,43.06772,43.067719,43.056265,42.996499,42.996644,42.996632,42.996632,42.993456,42.983458,42.983439,42.968927,42.968923,42.95442,42.954373,42.939873,42.93976,42.939077,42.939185,42.92469,42.924651,42.9108,42.911073,42.895693,42.896812,42.89699,42.881141,42.88108,42.866603,42.866572,42.852099,42.85211,42.837671,42.837661,42.823496,42.823195,42.828689,42.8288,42.806831,42.806845,42.792712,42.792721,42.778221,42.780511,42.780653,42.781766,42.774603,42.774541,42.774704,42.774753,42.774874,42.774805,42.774773,42.767555,42.768116,42.760945,42.76095,42.759538,42.75941,42.752144,42.752218,42.75575,42.755835,42.737721,42.737765,42.731655,42.731703,42.724495,42.724474,42.717236,42.717161,42.709983,42.709956,42.70261,42.702421,42.724404,42.724712,42.73203,42.732055,42.728412,42.728247,42.73175,42.732226,42.732194,42.739471,42.739484,42.724955,42.724951,42.724958,42.710297,42.710288,42.713966,42.714483,42.711039,42.710928,42.711122,42.703025,42.702982,42.699406,42.699297,42.702942,42.702168,42.702248,42.70918,42.709186,42.709832,42.717122,42.717574,42.724796,42.72483,42.735693,42.735716,42.732098,42.732149,42.73992,42.739682,42.750145,42.750274,42.753789,42.753907,42.739593,42.739703,42.739658,42.784061,42.785376,42.784164,42.783945,42.781526,42.780131,42.781753,42.782516,42.782865,42.783343,42.786552,42.787971,42.788228,42.787735,42.788245,42.789804,42.789808,42.79107,42.792391,42.792059,42.793468,42.794568,42.797407,42.797665,42.798915,42.799426,42.798147,42.797302,42.793699,42.792936,42.79277,42.790954,42.790094,42.78959,42.787536,42.786983,42.787868,42.788837,42.824101,42.824112,42.884356,42.885135,42.909661,42.909675,42.924483,42.965284,42.996291,42.996318,43.054511,43.08316,43.083457,43.087067,43.087083,43.112458,43.113946,43.17059,43.170579,43.177696,43.186134,43.214139,43.243253,43.257741,43.258054,43.2636,43.287099,43.344799,43.351419,43.358748,43.387997,43.422294,43.431548,43.431695,43.431306,43.459594,43.516449,43.515947,43.608407,43.608472,43.609265,43.609363,43.609641,43.611244,43.611216,43.611445,43.610925,43.6109319633736,43.627619]}]],[[{"lng":[-122.929193,-122.928956,-122.929145,-122.929122,-122.929146,-122.885463,-122.87539,-122.863423,-122.784735,-122.784663,-122.762437,-122.762189526428,-122.772511,-122.772681206097,-122.774511,-122.76381,-122.762414110309,-122.743540245466,-122.738109,-122.713309,-122.691381583242,-122.6911850902,-122.691008,-122.675327484197,-122.675093773773,-122.675008,-122.643907,-122.634962906196,-122.607718206328,-122.602606,-122.588917822907,-122.586005557515,-122.582325993186,-122.581406,-122.55127899822,-122.550211685523,-122.549955276927,-122.549438939157,-122.548149,-122.545981397444,-122.523668,-122.505353096256,-122.49601900833,-122.492259,-122.479315,-122.475778139509,-122.474659,-122.471883289024,-122.455261778702,-122.453891,-122.438674,-122.416934004748,-122.410706,-122.401222955157,-122.397100512625,-122.391802,-122.383435896741,-122.380302,-122.372189242991,-122.352802,-122.341811701881,-122.339070265255,-122.331502,-122.294901,-122.294819998052,-122.266701,-122.262625,-122.259530999909,-122.248993,-122.248911947664,-122.2017,-122.197527546048,-122.183695,-122.166829998749,-122.14075,-122.129548,-122.12949,-122.126197,-122.126197,-122.112356,-122.101675,-122.100176014643,-122.044374,-122.022571,-122.00369,-121.983038,-121.979797,-121.963547,-121.961258017759,-121.955734,-121.951838,-121.935149,-121.922028852172,-121.922051,-121.918698,-121.916509,-121.915478,-121.913115,-121.915184,-121.915527,-121.914551,-121.915913,-121.915803,-121.918095,-121.918386,-121.91549,-121.910547,-121.910516,-121.911443,-121.913019,-121.913911,-121.912619,-121.910309,-121.907326,-121.908329,-121.907176,-121.906325,-121.902915,-121.903291,-121.902678,-121.901879,-121.908793,-121.911695,-121.919685,-121.922136,-121.91644,-121.913216,-121.913761,-121.913087,-121.911614,-121.911443,-121.909746,-121.906924,-121.906688,-121.902817,-121.895902,-121.89392,-121.891749,-121.888674,-121.885605,-121.881862,-121.878538,-121.874665,-121.870166,-121.869342,-121.868187,-121.866919,-121.864656,-121.860873,-121.859828,-121.860137,-121.861111,-121.86337,-121.860323,-121.85882,-121.854653,-121.850403,-121.847872,-121.846821,-121.846764,-121.844301,-121.842521,-121.836809,-121.83527,-121.831765,-121.828898,-121.824922,-121.821485,-121.819587,-121.821959,-121.821956,-121.983148,-121.983147,-122.004194,-122.085981,-122.126544,-122.126545,-122.147212,-122.166674,-122.249969,-122.249828,-122.263944,-122.2727,-122.305836,-122.316084,-122.342882,-122.348315,-122.357752,-122.372096,-122.372796,-122.383141,-122.389346,-122.403758,-122.41397,-122.414457,-122.439145,-122.443966,-122.447789,-122.45466,-122.466639,-122.468001,-122.47253,-122.474558,-122.47555,-122.479942,-122.485866,-122.486584,-122.496748,-122.499336,-122.501043,-122.501787,-122.504364,-122.507261,-122.510439,-122.514243,-122.517067,-122.527468,-122.530085,-122.532488,-122.537618,-122.547638,-122.548002,-122.55301,-122.558255,-122.565483,-122.568617,-122.570126,-122.571309,-122.57905,-122.583961,-122.5855,-122.58613,-122.586836,-122.58937,-122.596245,-122.596603,-122.596702,-122.597184,-122.597198,-122.597395,-122.59762,-122.597665,-122.599675,-122.601454,-122.60175,-122.60573,-122.606614,-122.608722,-122.610832,-122.613127,-122.615374,-122.616195,-122.616871,-122.618341,-122.618588,-122.618995,-122.618977,-122.622359,-122.626278,-122.632974,-122.63656,-122.636587,-122.64158,-122.641245,-122.646958,-122.652921,-122.652988,-122.656972,-122.660979,-122.659105,-122.658274,-122.652605,-122.651227,-122.647666,-122.64616,-122.646267,-122.651183,-122.648787,-122.648725,-122.654959,-122.660451,-122.666145,-122.666298,-122.672677,-122.673311,-122.675572,-122.681893,-122.682505,-122.694678,-122.697382,-122.698697,-122.701808,-122.702001,-122.703304,-122.705021,-122.707893,-122.712169,-122.715938,-122.719286,-122.721355,-122.721663,-122.725541,-122.7303,-122.733422,-122.738563,-122.741101,-122.743721,-122.743718,-122.743703,-122.743691,-122.743673,-122.743668,-122.743649,-122.743659,-122.743667,-122.743672,-122.743663,-122.743654,-122.743626,-122.743671,-122.743681,-122.743711,-122.743745,-122.743746,-122.743758,-122.743798,-122.743799,-122.743809,-122.743785,-122.743803,-122.743805,-122.743813,-122.743815,-122.743828,-122.743847,-122.743856,-122.743859,-122.743859,-122.743862,-122.764464,-122.764486,-122.764472,-122.764459,-122.764458,-122.764439,-122.764436,-122.764412,-122.765076,-122.76609,-122.77215,-122.774659,-122.779838,-122.78234,-122.783624,-122.784232,-122.784864,-122.784768,-122.784769,-122.78477,-122.784771,-122.795111,-122.792699,-122.795914,-122.796057,-122.803132,-122.804585,-122.805432,-122.805481,-122.826005,-122.826222,-122.826342,-122.846978,-122.846905,-122.846849,-122.866745,-122.867592,-122.867495,-122.868303,-122.887963,-122.887837,-122.908992,-122.909078,-122.918725,-122.929128,-122.929193],"lat":[45.671015,45.67835,45.69381,45.698697,45.721482,45.721378,45.721418,45.721416,45.720946,45.72865,45.728665,45.7285767375573,45.699637,45.6980030214684,45.680437,45.657138,45.6564319354118,45.6468852157137,45.644138,45.637438,45.6249517318773,45.6248398415969,45.624739,45.6181727840074,45.6180749177675,45.618039,45.609739,45.6092842265807,45.6078989364008,45.607639,45.6052506713647,45.6047425360023,45.6041005214526,45.60394,45.5974429961583,45.5972128260687,45.5971575305685,45.597046180342,45.596768,45.5961361625816,45.589632,45.5859286680353,45.5840412856794,45.583281,45.579761,45.5786549714616,45.578305,45.5768358833279,45.5680385200064,45.567313,45.563585,45.5667315782601,45.567633,45.5710983445711,45.5726047893983,45.574541,45.5755594821359,45.575941,45.5740234392524,45.569441,45.558502299525,45.5557737334935,45.548241,45.543541,45.5435418617228,45.543841,45.544321,45.5450981314783,45.547745,45.5477731000169,45.564141,45.5672822170685,45.577696,45.5803711516712,45.584508,45.582945,45.582967,45.582573,45.582617,45.581409,45.583516,45.5841961560057,45.609516,45.615151,45.61593,45.622812,45.624839,45.632784,45.6359407622737,45.643559,45.644951,45.644169,45.6491618990508,45.610761,45.608288,45.607635,45.605163,45.601297,45.598698,45.597109,45.593684,45.591609,45.589685,45.587287,45.585484,45.582447,45.581241,45.579733,45.576484,45.575168,45.571163,45.568211,45.566826,45.566723,45.564983,45.56255,45.561935,45.561121,45.559517,45.55686,45.55619,45.549992,45.548941,45.547614,45.546673,45.543205,45.537275,45.535329,45.532567,45.530303,45.529082,45.526749,45.524655,45.520828,45.51853,45.514896,45.513388,45.512631,45.512252,45.512408,45.513125,45.514295,45.515751,45.514598,45.514103,45.508715,45.506786,45.504495,45.501814,45.499168,45.496923,45.495096,45.492844,45.489377,45.489006,45.486638,45.486502,45.483377,45.481329,45.47907,45.476188,45.476109,45.474619,45.472492,45.470184,45.467466,45.465469,45.46333,45.461675,45.461674,45.460226,45.460237,45.461403,45.461534,45.46058,45.461299,45.460039,45.460828,45.460837,45.460935,45.461422,45.461412,45.461394,45.461439,45.46149,45.461529,45.461502,45.461426,45.461222,45.46123,45.461276,45.4613,45.461421,45.461581,45.461579,45.461134,45.461001,45.460974,45.460941,45.461127,45.461135,45.461173,45.461184,45.461183,45.461176,45.461138,45.461132,45.460982,45.461028,45.46107,45.461107,45.461187,45.461252,45.461256,45.46126,45.461262,45.461273,45.461296,45.461318,45.461353,45.461058,45.461045,45.461053,45.461062,45.461307,45.461365,45.46138,45.461392,45.461518,45.461494,45.461487,45.461483,45.461522,45.46149,45.461458,45.461458,45.461458,45.461457,45.461457,45.461457,45.461453,45.461453,45.461454,45.461464,45.461486,45.461488,45.461493,45.461505,45.461501,45.461493,45.461481,45.461473,45.460889,45.460832,45.460933,45.460908,45.461451,45.461444,45.461451,45.46155,45.461474,45.461476,45.461482,45.458671,45.458669,45.458318,45.458314,45.458066,45.457819,45.454341,45.453242,45.445741,45.445281,45.443983,45.441424,45.439584,45.436059,45.432811,45.432718,45.432668,45.432702,45.432743,45.432743,45.432792,45.432795,45.432867,45.432841,45.432841,45.43301,45.433041,45.433041,45.433041,45.433056,45.433038,45.433037,45.433042,45.433056,45.433079,45.433113,45.433135,45.433137,45.433167,45.43324,45.433199,45.433238,45.433268,45.433294,45.435079,45.442944,45.444663,45.447284,45.447693,45.454892,45.456685,45.458486,45.465576,45.467532,45.469466,45.476439,45.476442,45.477961,45.484201,45.487084,45.48725,45.488258,45.494401,45.494665,45.497618,45.505017,45.506834,45.507374,45.507886,45.508181,45.509582,45.512509,45.5144,45.515754,45.516665,45.519509,45.519562,45.526737,45.528166,45.529634,45.529727,45.531184,45.531344,45.533822,45.533858,45.533852,45.533815,45.533809,45.533897,45.533946,45.533971,45.533982,45.533994,45.54232,45.543979,45.545158,45.5484,45.548433,45.54935,45.552082,45.555695,45.555689,45.556182,45.555687,45.562911,45.563041,45.568063,45.577521,45.577516,45.581018,45.591836,45.591881,45.591878,45.606226,45.606223,45.606352,45.620466,45.620763,45.635228,45.635399,45.635313,45.671015]}]],[[{"lng":[-119.672228,-119.667065,-119.603647,-119.593374,-119.552894,-119.544565,-119.306611,-119.306043,-119.162966,-119.002263,-118.946612,-118.675353,-118.518689,-118.468871,-118.469598,-118.469023,-118.464283,-118.457035,-118.456019,-118.452852,-118.448093,-118.446315,-118.446726,-118.445887,-118.444209,-118.44167,-118.437351,-118.436403,-118.437612,-118.437462,-118.438524,-118.438268,-118.437099,-118.438286,-118.439339,-118.4361,-118.433878,-118.430751,-118.425078,-118.42272,-118.418766,-118.416289,-118.411093,-118.408772,-118.405273,-118.404535,-118.40065,-118.39872,-118.39477,-118.392626,-118.389864,-118.390399,-118.390619,-118.387479,-118.38708,-118.387501,-118.386538,-118.381016,-118.380085,-118.378083,-118.375376,-118.373475,-118.370856,-118.368541,-118.367815,-118.366738,-118.364214,-118.359455,-118.358389,-118.356759,-118.356323,-118.351765,-118.350693,-118.34662,-118.342078,-118.339081,-118.336217,-118.3346,-118.331747,-118.32962,-118.329464,-118.324554,-118.323544,-118.321271,-118.320187,-118.318969,-118.315687,-118.314562,-118.311985,-118.308527,-118.308807,-118.307603,-118.305238,-118.304524,-118.302714,-118.299819,-118.298941,-118.299031,-118.296386,-118.292543,-118.290194,-118.287892,-118.286304,-118.284328,-118.282246,-118.28229,-118.280496,-118.278403,-118.277008,-118.276006,-118.274333,-118.272668,-118.270121,-118.267939,-118.264747,-118.263148,-118.260454,-118.256409,-118.254562,-118.251326,-118.244662,-118.243553,-118.244533,-118.24364,-118.245043,-118.244382,-118.24161,-118.237322,-118.23623,-118.233636,-118.229663,-118.227547,-118.226449,-118.223449,-118.225709,-118.226727,-118.226561,-118.22828,-118.231337,-118.232128,-118.231634,-118.227791,-118.229421,-118.232795,-118.235115,-118.237399,-118.236831,-118.234808,-118.235656,-118.235589,-118.236369,-118.235329,-118.231462,-118.232402,-118.230979,-118.229972,-118.226627,-118.224904,-118.228056,-118.22816,-118.227459,-118.228076,-118.23518,-118.236861,-118.24055,-118.242499,-118.246533,-118.253802,-118.258237,-118.261829,-118.264012,-118.267786,-118.2759,-118.279179,-118.283489,-118.2872,-118.289794,-118.295659,-118.296234,-118.294716,-118.294909,-118.293566,-118.29906,-118.302862,-118.306764,-118.306817,-118.309246,-118.312281,-118.314454,-118.3187,-118.317934,-118.313907,-118.308421,-118.30847,-118.310056,-118.311173,-118.308837,-118.307233,-118.307522,-118.304572,-118.303366,-118.300975,-118.296269,-118.295068,-118.294827,-118.296548,-118.298077,-118.2978,-118.296578,-118.298355,-118.299459,-118.294383,-118.293393,-118.294019,-118.294094,-118.292122,-118.290151,-118.284994,-118.283385,-118.28311,-118.286294,-118.287422,-118.28984,-118.289351,-118.288299,-118.286739,-118.286281,-118.286743,-118.285439,-118.289862,-118.292079,-118.294194,-118.296443,-118.29877,-118.300094,-118.302565,-118.305462,-118.306628,-118.311639,-118.316347,-118.319306,-118.321741,-118.325783,-118.329785,-118.332304,-118.336355,-118.339207,-118.343374,-118.346502,-118.350798,-118.35243,-118.358121,-118.361673,-118.365587,-118.367621,-118.372775,-118.376666,-118.379786,-118.381491,-118.383411,-118.383321,-118.385176,-118.387277,-118.387177,-118.391704,-118.391656,-118.394052,-118.393659,-118.395839,-118.40025,-118.403611,-118.413647,-118.417419,-118.418867,-118.418247,-118.419907,-118.419381,-118.422747,-118.425086,-118.43182,-118.432064,-118.433707,-118.435673,-118.437712,-118.440003,-118.443456,-118.445862,-118.45227,-118.459157,-118.460487,-118.461866,-118.460802,-118.461528,-118.464244,-118.468284,-118.470581,-118.473427,-118.476922,-118.480904,-118.483704,-118.488174,-118.491292,-118.492404,-118.495257,-118.495729,-118.496169,-118.496583,-118.496787,-118.497422,-118.497865,-118.498161,-118.498373,-118.498457,-118.499774,-118.501794,-118.505765,-118.507765,-118.509705,-118.513679,-118.516539,-118.518181,-118.51944,-118.519174,-118.516452,-118.51749,-118.51765,-118.518688,-118.517591,-118.513986,-118.512691,-118.511088,-118.510957,-118.50892,-118.507077,-118.507257,-118.504437,-118.504435,-118.500889,-118.497947,-118.493278,-118.488713,-118.485639,-118.48214,-118.47732,-118.473527,-118.472734,-118.463113,-118.460962,-118.456063,-118.453139,-118.451401,-118.446702,-118.441788,-118.438184,-118.436806,-118.433626,-118.432342,-118.429638,-118.425197,-118.422329,-118.41909,-118.417036,-118.414113,-118.412928,-118.41088,-118.410214,-118.404947,-118.403639,-118.402581,-118.399942,-118.393181,-118.391024,-118.388087,-118.38634,-118.386038,-118.379855,-118.377906,-118.375037,-118.372365,-118.3711,-118.368572,-118.36454,-118.362249,-118.360273,-118.355851,-118.354824,-118.353557,-118.343684,-118.343208,-118.342172,-118.342194,-118.344374,-118.341779,-118.341699,-118.342567,-118.341934,-118.338063,-118.338852,-118.337588,-118.336404,-118.333246,-118.329297,-118.319431,-118.316589,-118.314537,-118.312564,-118.309704,-118.311853,-118.311696,-118.309328,-118.305778,-118.305777,-118.306961,-118.308934,-118.311222,-118.310984,-118.315622,-118.314069,-118.316873,-118.315482,-118.31769,-118.317296,-118.31982,-118.322737,-118.323526,-118.32617,-118.327739,-118.328495,-118.332254,-118.334252,-118.337408,-118.337886,-118.343274,-118.343872,-118.345607,-118.346866,-118.346234,-118.347614,-118.347966,-118.346739,-118.349305,-118.351025,-118.352379,-118.354821,-118.354205,-118.356315,-118.358417,-118.359224,-118.364066,-118.365535,-118.369628,-118.37153,-118.372225,-118.370803,-118.371036,-118.368806,-118.371346,-118.374236,-118.374509,-118.373523,-118.374563,-118.373195,-118.372863,-118.370202,-118.367772,-118.366115,-118.364615,-118.365086,-118.363427,-118.360667,-118.357986,-118.362312,-118.367042,-118.36365,-118.36231,-118.360732,-118.36514,-118.367973,-118.36939,-118.372852,-118.375367,-118.376741,-118.378302,-118.380034,-118.383108,-118.386097,-118.388293,-118.39201,-118.394593,-118.398703,-118.402845,-118.405392,-118.408786,-118.411069,-118.41351,-118.418155,-118.419336,-118.420911,-118.421542,-118.422173,-118.421545,-118.420601,-118.420366,-118.418457,-118.420684,-118.423597,-118.422102,-118.422418,-118.42895,-118.429108,-118.428322,-118.430919,-118.431147,-118.434066,-118.434853,-118.435954,-118.434932,-118.43501,-118.431707,-118.425493,-118.427067,-118.428483,-118.428326,-118.424394,-118.422586,-118.421329,-118.417555,-118.413703,-118.409774,-118.40889,-118.407612,-118.410955,-118.413314,-118.420455,-118.430374,-118.432812,-118.433813,-118.433579,-118.432384,-118.433621,-118.435357,-118.43437,-118.436986,-118.440356,-118.447799,-118.452455,-118.456729,-118.457563,-118.458579,-118.461061,-118.46887,-118.469096,-118.467883,-118.47266,-118.474848,-118.478595,-118.478727,-118.48124,-118.481412,-118.482345,-118.484647,-118.486512,-118.488681,-118.490468,-118.49507,-118.496152,-118.497321,-118.498411,-118.500117,-118.49732,-118.497499,-118.447185,-118.354145,-118.354122,-118.23217,-118.232214,-118.233908,-118.228843,-118.228541,-118.227645,-118.347856,-118.347859,-118.466299,-118.467308,-118.587125,-118.587172,-118.799711,-118.81689,-118.816931,-118.857192,-118.867264,-118.932024,-119.614325,-119.657183,-119.656838,-119.654993,-119.655517,-119.655248,-119.655108,-119.653696,-119.653832,-119.653673,-119.653885,-119.653538,-119.653476,-119.653347,-119.653184,-119.652431,-119.671532,-119.672228],"lat":[44.995117,44.994664,44.994539,44.99531,44.995311,44.995689,44.995993,44.995696,44.996241,44.996558,44.997439,44.997662,44.995877,44.995176,44.992707,44.991737,44.989822,44.990257,44.989514,44.989289,44.990623,44.990024,44.988471,44.986767,44.986752,44.985326,44.984781,44.98298,44.980277,44.978587,44.977115,44.975192,44.971665,44.968054,44.96625,44.96242,44.96256,44.963891,44.963809,44.965656,44.967006,44.968752,44.971192,44.973309,44.975031,44.976476,44.975912,44.97436,44.973976,44.972544,44.972402,44.974115,44.97756,44.979407,44.980483,44.983786,44.983712,44.98129,44.979488,44.980115,44.981894,44.981597,44.982434,44.984037,44.985957,44.986714,44.990763,44.992301,44.992174,44.990605,44.988214,44.987824,44.987332,44.986988,44.983748,44.979593,44.978879,44.976675,44.975827,44.973393,44.972329,44.971889,44.972832,44.973044,44.975415,44.975929,44.974252,44.972586,44.971568,44.972016,44.970771,44.969659,44.969209,44.968488,44.968559,44.963839,44.963426,44.96063,44.960768,44.962913,44.962755,44.964509,44.965046,44.964459,44.964726,44.963114,44.962104,44.961771,44.96023,44.957896,44.957348,44.957659,44.957313,44.958731,44.95929,44.958896,44.956655,44.956934,44.956457,44.956351,44.958396,44.956525,44.951086,44.950096,44.945198,44.94431,44.943198,44.942695,44.941213,44.940104,44.941695,44.939778,44.939575,44.93691,44.933778,44.931409,44.930012,44.926032,44.924687,44.923482,44.921531,44.918361,44.913854,44.911514,44.91053,44.908385,44.906927,44.904173,44.902902,44.901367,44.898643,44.897046,44.894063,44.891028,44.887149,44.882349,44.878634,44.875568,44.872332,44.870332,44.867783,44.865544,44.862587,44.86166,44.862344,44.863165,44.864071,44.864851,44.863351,44.866013,44.866412,44.869386,44.866573,44.866271,44.865007,44.865367,44.866421,44.863043,44.862086,44.859376,44.856606,44.853018,44.850451,44.848153,44.846614,44.843855,44.841107,44.840039,44.838066,44.836274,44.834937,44.832422,44.830613,44.828794,44.824802,44.823236,44.821229,44.821148,44.819407,44.818712,44.81733,44.816426,44.816164,44.813191,44.809344,44.807807,44.802979,44.800259,44.799211,44.798705,44.796442,44.790167,44.787936,44.787259,44.784664,44.780412,44.77925,44.773003,44.772211,44.77072,44.767331,44.767165,44.765439,44.763371,44.762708,44.759278,44.757123,44.754323,44.750975,44.749868,44.747389,44.746564,44.74698,44.746248,44.746025,44.747643,44.746949,44.74528,44.744241,44.743986,44.742082,44.74151,44.74162,44.74358,44.742467,44.742609,44.743944,44.744444,44.743912,44.743996,44.744738,44.745573,44.745474,44.747126,44.747213,44.745628,44.745249,44.744357,44.742041,44.740717,44.738868,44.739093,44.737389,44.735949,44.734328,44.731398,44.728998,44.727872,44.726005,44.72647,44.724808,44.727122,44.726986,44.724884,44.722776,44.721846,44.718693,44.719488,44.718554,44.719766,44.721091,44.720729,44.721555,44.721547,44.722886,44.724173,44.723436,44.719166,44.715774,44.712657,44.710861,44.708948,44.707521,44.706374,44.705666,44.704,44.705289,44.709199,44.710035,44.71003,44.710944,44.712393,44.713621,44.712865,44.712425,44.712027,44.711729,44.711606,44.711339,44.711163,44.710958,44.710678,44.710619,44.709055,44.708664,44.709331,44.708903,44.706237,44.7061,44.704765,44.706081,44.705886,44.704031,44.702462,44.695931,44.692755,44.691562,44.690074,44.688532,44.684021,44.681049,44.679134,44.677878,44.675417,44.67433,44.669929,44.665556,44.665925,44.665698,44.663566,44.664484,44.663639,44.661871,44.66142,44.658729,44.656632,44.65559,44.656297,44.655396,44.653084,44.652859,44.650017,44.652451,44.653206,44.654376,44.652691,44.652595,44.653966,44.654828,44.652801,44.648687,44.647164,44.646543,44.644739,44.644169,44.643025,44.641444,44.641388,44.643381,44.643539,44.642871,44.643001,44.641555,44.642928,44.644419,44.64645,44.645905,44.646102,44.645121,44.643484,44.643038,44.639823,44.639769,44.637965,44.639377,44.639263,44.635601,44.631821,44.631204,44.628403,44.626656,44.625024,44.621341,44.618969,44.617901,44.616775,44.61249,44.61098,44.609502,44.610007,44.608374,44.608771,44.605442,44.603863,44.601609,44.597549,44.595679,44.592251,44.591181,44.589939,44.58881,44.587851,44.58605,44.585317,44.582581,44.581034,44.577082,44.575043,44.572539,44.570658,44.569192,44.567896,44.566543,44.564173,44.562368,44.56119,44.562207,44.563778,44.565112,44.564453,44.565182,44.567029,44.562544,44.560056,44.559716,44.556217,44.554977,44.553654,44.551086,44.550466,44.548608,44.548037,44.54759,44.545392,44.542545,44.541274,44.539108,44.536041,44.537216,44.538112,44.53281,44.531191,44.528638,44.526215,44.523791,44.521255,44.519056,44.514035,44.512089,44.509207,44.507891,44.506397,44.50479,44.502494,44.498025,44.496334,44.493629,44.491714,44.488219,44.485906,44.484385,44.480101,44.478912,44.474856,44.474066,44.471699,44.469162,44.466621,44.466172,44.462786,44.459231,44.45958,44.461433,44.462276,44.45974,44.458504,44.458337,44.456869,44.457882,44.457777,44.456458,44.454457,44.452648,44.452872,44.454282,44.455921,44.456766,44.455072,44.453439,44.448984,44.444531,44.443008,44.438442,44.432468,44.428179,44.426207,44.423503,44.421752,44.416737,44.414309,44.411717,44.40997,44.4088,44.407153,44.403825,44.401907,44.399426,44.397508,44.39858,44.398748,44.397454,44.394828,44.394126,44.391195,44.388993,44.385782,44.383807,44.380988,44.378619,44.372909,44.370845,44.373036,44.373543,44.371744,44.369882,44.36914,44.368133,44.364889,44.362848,44.359247,44.356125,44.353977,44.352126,44.350936,44.350716,44.349406,44.346428,44.344848,44.340343,44.336551,44.334584,44.325517,44.322048,44.319045,44.318331,44.315917,44.313051,44.309518,44.306626,44.304536,44.302617,44.297932,44.294188,44.289246,44.288546,44.287046,44.28383,44.278536,44.277057,44.277036,44.255248,44.255211,44.255384,44.256824,44.257343,44.256129,44.212548,44.21255,44.183239,44.039862,44.039075,44.040388,44.040374,44.040375,44.040266,44.046995,44.047775,44.047828,43.960733,43.960227,43.960462,43.960374,43.959593,43.95892,44.220277,44.220276,44.307045,44.34547,44.389206,44.38917,44.454961,44.461288,44.534131,44.621785,44.652251,44.652252,44.762701,44.823299,44.823343,44.995117]}]],[[{"lng":[-123.816709,-123.734996,-123.735153,-123.715538,-123.715675,-123.715866,-123.72014,-123.720065,-123.720071,-123.699976,-123.68952,-123.679097,-123.66875,-123.648669,-123.608115,-123.597677,-123.59763,-123.597233,-123.596134,-123.596674,-123.596919,-123.596929,-123.602817,-123.602794,-123.603143,-123.602609,-123.580966,-123.54132,-123.47056,-123.438419,-123.414116,-123.409764,-123.339138,-123.316612,-123.301882,-123.240276,-123.23521,-123.221593,-123.201917,-123.182025,-123.149025,-123.147507,-123.147489,-123.145982,-123.143316,-123.1366,-123.133244,-123.126206,-123.12453,-123.121299,-123.119339,-123.119212,-123.117517,-123.116892,-123.114522,-123.111736,-123.105532,-123.100643,-123.092509,-123.089254,-123.087313,-123.086173,-123.084184,-123.07836,-123.074838,-123.073643,-123.073132,-123.074291,-123.078206,-123.088313,-123.095339,-123.09675,-123.101193,-123.105311,-123.105836,-123.108685,-123.110063,-123.112528,-123.119519,-123.121978,-123.126206,-123.133623,-123.136988,-123.14252,-123.150434,-123.15707,-123.16132,-123.164428,-123.17088,-123.171739,-123.172124,-123.171855,-123.169674,-123.17011,-123.171626,-123.174226,-123.179922,-123.181816,-123.183175,-123.183449,-123.182812,-123.18291,-123.18392,-123.187849,-123.19519,-123.198028,-123.198645,-123.198355,-123.19701,-123.191431,-123.18719,-123.184161,-123.183202,-123.183011,-123.185375,-123.18564,-123.19195,-123.195441,-123.203044,-123.206301,-123.214573,-123.221793,-123.227875,-123.232606,-123.251209,-123.251831,-123.25212,-123.253373,-123.254317,-123.256178,-123.260251,-123.260791,-123.260739,-123.260151,-123.250991,-123.247404,-123.24292,-123.242113,-123.241754,-123.24579,-123.248391,-123.250254,-123.253376,-123.251728,-123.250029,-123.245055,-123.240081,-123.238067,-123.233093,-123.231079,-123.228001,-123.22581,-123.222672,-123.218023,-123.214683,-123.212619,-123.211967,-123.214343,-123.215082,-123.214409,-123.214778,-123.219354,-123.221019,-123.220156,-123.219144,-123.214276,-123.213426,-123.213992,-123.216169,-123.216462,-123.213822,-123.211785,-123.211866,-123.211306,-123.209831,-123.208492,-123.206317,-123.205287,-123.207587,-123.209194,-123.212903,-123.215459,-123.21886,-123.224857,-123.227466,-123.228054,-123.227685,-123.225841,-123.222195,-123.21938,-123.219345,-123.220377,-123.222904,-123.226797,-123.229311,-123.229331,-123.229324,-123.229146,-123.22896,-123.227668,-123.225099,-123.22345,-123.223614,-123.229297,-123.233258,-123.235868,-123.238668,-123.242821,-123.244952,-123.245157,-123.244701,-123.242288,-123.239283,-123.23416,-123.230813,-123.22595,-123.223754,-123.221167,-123.219011,-123.219661,-123.222699,-123.226797,-123.229529,-123.23319,-123.235048,-123.235102,-123.233245,-123.230581,-123.229399,-123.228599,-123.228518,-123.229898,-123.232316,-123.237425,-123.240744,-123.245334,-123.245678,-123.244844,-123.239365,-123.236564,-123.229862,-123.224557,-123.220295,-123.21691,-123.217585,-123.216802,-123.217302,-123.216178,-123.214125,-123.211304,-123.204394,-123.200105,-123.197359,-123.193766,-123.193097,-123.193752,-123.190897,-123.18975,-123.190365,-123.193657,-123.193575,-123.191102,-123.187851,-123.183671,-123.180388,-123.200385,-123.224885,-123.230044,-123.248679,-123.288655,-123.328667,-123.367696,-123.371408,-123.371411,-123.451272,-123.455686,-123.471685,-123.472186,-123.532858,-123.556039,-123.573614,-123.59329,-123.593513,-123.715377,-123.715386,-123.723588,-123.767931,-123.775598,-123.775789,-123.816525,-123.816709],"lat":[44.344622,44.345778,44.36035,44.360458,44.379969,44.389495,44.389506,44.432329,44.433374,44.433788,44.433582,44.433928,44.432935,44.43342,44.433671,44.433109,44.46932,44.477454,44.477454,44.541804,44.545624,44.651139,44.651159,44.702125,44.709242,44.721154,44.719415,44.72127,44.720722,44.720622,44.720552,44.720531,44.720059,44.719994,44.719835,44.719914,44.720146,44.720125,44.720099,44.720085,44.720225,44.717047,44.714848,44.711407,44.70831,44.702178,44.700002,44.696014,44.693903,44.691353,44.684493,44.682083,44.678592,44.676966,44.675549,44.674826,44.674763,44.675959,44.675887,44.674727,44.672546,44.66814,44.665294,44.662326,44.659373,44.657331,44.652359,44.649613,44.646585,44.643195,44.641107,44.640814,44.639818,44.639202,44.63915,44.639262,44.639801,44.640594,44.640896,44.640363,44.639291,44.638056,44.637775,44.63787,44.637507,44.637269,44.637619,44.637507,44.634245,44.632428,44.628866,44.62779,44.624542,44.622674,44.621011,44.620036,44.619901,44.619,44.61745,44.616087,44.613029,44.611036,44.609246,44.60723,44.604953,44.602857,44.60042,44.599046,44.59756,44.595896,44.595583,44.594289,44.593077,44.590002,44.587298,44.587179,44.585814,44.585615,44.586063,44.586028,44.585376,44.584597,44.583056,44.581496,44.574626,44.574095,44.573848,44.572781,44.571477,44.566167,44.559351,44.557491,44.556365,44.555148,44.551983,44.550583,44.548154,44.547324,44.544575,44.539654,44.536969,44.532434,44.52887,44.526486,44.525947,44.526172,44.528059,44.527969,44.524644,44.522623,44.516608,44.513286,44.510982,44.51022,44.507681,44.504978,44.501218,44.495079,44.494188,44.491014,44.488627,44.486962,44.484751,44.482585,44.481805,44.479649,44.476371,44.473803,44.471695,44.468473,44.460622,44.457143,44.452756,44.450269,44.448576,44.447397,44.445745,44.443038,44.437074,44.435239,44.434572,44.434638,44.434205,44.434126,44.433293,44.431889,44.42996,44.426664,44.422371,44.419436,44.416461,44.415712,44.416941,44.417256,44.415073,44.414213,44.414127,44.41312,44.41221,44.406912,44.39935,44.395505,44.393452,44.388135,44.386089,44.385229,44.384887,44.385352,44.384143,44.382254,44.380821,44.377715,44.374888,44.37205,44.371131,44.370322,44.36901,44.366149,44.362497,44.35993,44.359588,44.360124,44.359847,44.358396,44.356979,44.354622,44.352618,44.348468,44.345995,44.344606,44.342591,44.340852,44.339869,44.338879,44.337789,44.33363,44.332099,44.330984,44.329186,44.328999,44.330779,44.331266,44.32943,44.324952,44.32066,44.317272,44.313726,44.310808,44.309747,44.309222,44.308716,44.308829,44.308573,44.306974,44.305646,44.303354,44.29984,44.295892,44.294963,44.292272,44.290742,44.287587,44.285562,44.28493,44.283725,44.283725,44.283725,44.283725,44.283726,44.283724,44.283725,44.283719,44.283725,44.281021,44.280496,44.280647,44.281185,44.281471,44.281523,44.281402,44.282597,44.281915,44.276699,44.280267,44.283946,44.283944,44.283606,44.283547,44.316167,44.315303,44.344622]}]],[[{"lng":[-121.031202,-121.026348,-121.024374,-121.022556,-121.019811,-121.018483,-121.018588,-121.017429,-121.01569,-121.01079,-121.007455,-121.005447,-121.000973,-120.997673,-120.992973,-120.990473,-120.988673,-120.986474,-120.985498,-120.982776,-120.979647,-120.973089,-120.972589,-120.97387,-120.974381,-120.973344,-120.97218,-120.969577,-120.966974,-120.963672,-120.959771,-120.956471,-120.955773,-120.954171,-120.947171,-120.946071,-120.945771,-120.946472,-120.953872,-120.955372,-120.955072,-120.953672,-120.949472,-120.946372,-120.940771,-120.938471,-120.935871,-120.93377,-120.93237,-120.932169,-120.933068,-120.935868,-120.939568,-120.939628,-120.938472,-120.934171,-120.930471,-120.923671,-120.921771,-120.920471,-120.919771,-120.920475,-120.920371,-120.918671,-120.914371,-120.909271,-120.904671,-120.901065,-120.899371,-120.899771,-120.898171,-120.89428,-120.889071,-120.883445,-120.883039,-120.881064,-120.879164,-120.877522,-120.872479,-120.868265,-120.866962,-120.865759,-120.866075,-120.868235,-120.868569,-120.86607,-120.86657,-120.86157,-120.86267,-120.86287,-120.86209,-120.85917,-120.854872,-120.852271,-120.84987,-120.84947,-120.851771,-120.856371,-120.859571,-120.863971,-120.865071,-120.865771,-120.865371,-120.862871,-120.861871,-120.861471,-120.860972,-120.859072,-120.856571,-120.847671,-120.845671,-120.837971,-120.836073,-120.835571,-120.837371,-120.837471,-120.839171,-120.839071,-120.838172,-120.833377,-120.833178,-120.83458,-120.838981,-120.838881,-120.837783,-120.836184,-120.834585,-120.828587,-120.82629,-120.825731,-120.827084,-120.833877,-120.838772,-120.841972,-120.853673,-120.854473,-120.864073,-120.865268,-120.869928,-120.874893,-120.877966,-120.882656,-120.884318,-120.884777,-120.884644,-120.884983,-120.890264,-120.896833,-120.898438,-120.899356,-120.903006,-120.908459,-120.909382,-120.908205,-120.906528,-120.905657,-120.905899,-120.904815,-120.903013,-120.896872,-120.895674,-120.895397,-120.896478,-120.898788,-120.901176,-120.906075,-120.909275,-120.911675,-120.911282,-120.906375,-120.904375,-120.903975,-120.904775,-120.907361,-120.909223,-120.912191,-120.914281,-120.914976,-120.915795173154,-120.913476,-120.895575,-120.885616086084,-120.870042,-120.855674,-120.836141479114,-120.788872,-120.724171,-120.68937,-120.668869,-120.6535343441,-120.649368,-120.649368,-120.646168,-120.646068,-120.643668,-120.640368,-120.638568,-120.635868,-120.631668,-120.629067,-120.624467,-120.618567,-120.612267,-120.609967,-120.606167,-120.604867,-120.603466,-120.603766,-120.602466,-120.600466,-120.593766,-120.587066,-120.583366,-120.577565,-120.574265,-120.572265,-120.569465,-120.567465,-120.566965,-120.560065,-120.558264,-120.556464,-120.553064,-120.552064,-120.551164,-120.549064,-120.547364,-120.544783,-120.539245,-120.535308,-120.531013,-120.528516,-120.524742,-120.520924,-120.517573,-120.515688,-120.513313,-120.510188,-120.508107,-120.506384,-120.499805,-120.498461,-120.496624,-120.493853,-120.490833,-120.488779,-120.488689,-120.489739,-120.492223,-120.492223,-120.491732,-120.489585,-120.485156,-120.48244,-120.48231,-120.479903,-120.479474,-120.478341,-120.47836,-120.479181,-120.480276,-120.482367,-120.485326,-120.486421,-120.484741,-120.481042,-120.479303,-120.477833,-120.478087,-120.477475,-120.472696,-120.469915,-120.47018,-120.46897,-120.46795,-120.464725,-120.459735,-120.45746,-120.453915,-120.452159,-120.449588,-120.44422,-120.440538,-120.438299,-120.439925,-120.444612,-120.446258,-120.446592,-120.444248,-120.438889,-120.432693,-120.428135,-120.426305,-120.421999,-120.416052,-120.411699,-120.410742,-120.409413,-120.408982,-120.409128,-120.408536,-120.40536,-120.404938,-120.402654,-120.402578,-120.404832,-120.407117,-120.407663,-120.407038,-120.405673,-120.402107,-120.401323,-120.392574,-120.390763,-120.388305,-120.386122,-120.385845,-120.384579,-120.381856,-120.377466,-120.372265,-120.365267,-120.359875,-120.35798,-120.357804,-120.359512,-120.365401,-120.369313,-120.372139,-120.375793,-120.376156,-120.380486,-120.380493,-120.379469,-120.377837,-120.376304,-120.370994,-120.367013,-120.365217,-120.364122,-120.360771,-120.359976,-120.360827,-120.363246,-120.364955,-120.365655,-120.367855,-120.373427,-120.377756,-120.382056,-120.386686,-120.394456,-120.399056,-120.405557,-120.409557,-120.414957,-120.422581,-120.426856,-120.426057,-120.423357,-120.424257,-120.423257,-120.420557,-120.417857,-120.412857,-120.411057,-120.407256,-120.407022,-120.409948,-120.416409,-120.421449,-120.422903,-120.429082,-120.43323,-120.438779,-120.441284,-120.446592,-120.449907,-120.45441,-120.459937,-120.462291,-120.46966,-120.472759,-120.477559,-120.481228,-120.483859,-120.490359,-120.495859,-120.493459,-120.491759,-120.489859,-120.486359,-120.482359,-120.481559,-120.483459,-120.489859,-120.493659,-120.495159,-120.496859,-120.496059,-120.492159,-120.487859,-120.484435,-120.482941,-120.483658,-120.486758,-120.492259,-120.493959,-120.501159,-120.501859,-120.505859,-120.506459,-120.506059,-120.502959,-120.494059,-120.489058,-120.484158,-120.482958,-120.484258,-120.489258,-120.492258,-120.495759,-120.498759,-120.501159,-120.502659,-120.506259,-120.507959,-120.509659,-120.514759,-120.519859,-120.525059,-120.527559,-120.528659,-120.519359,-120.518459,-120.523059,-120.525259,-120.528159,-120.530159,-120.532059,-120.532559,-120.529759,-120.522659,-120.515159,-120.513358,-120.512558,-120.513158,-120.514958,-120.516659,-120.521859,-120.524059,-120.523459,-120.524459,-120.527059,-120.532059,-120.534459,-120.534659,-120.531859,-120.530659,-120.533659,-120.533659,-120.535559,-120.540159,-120.543059,-120.543359,-120.541459,-120.533958,-120.532458,-120.531258,-120.530458,-120.531258,-120.530758,-120.530958,-120.531958,-120.534358,-120.539658,-120.541258,-120.539358,-120.535158,-120.529458,-120.527358,-120.528058,-120.527458,-120.530358,-120.538758,-120.540458,-120.540758,-120.538858,-120.531858,-120.525558,-120.524658,-120.524057,-120.524457,-120.527757,-120.531558,-120.534658,-120.536858,-120.537758,-120.538558,-120.540358,-120.542258,-120.545458,-120.548158,-120.547758,-120.546658,-120.544258,-120.542758,-120.543158,-120.544858,-120.547358,-120.553358,-120.555558,-120.553158,-120.549158,-120.547858,-120.542858,-120.541758,-120.540257,-120.540289,-120.541857,-120.545158,-120.546358,-120.547057,-120.544657,-120.541657,-120.538157,-120.535957,-120.533657,-120.534457,-120.535757,-120.540657,-120.542857,-120.550957,-120.554457,-120.556057,-120.552057,-120.550663,-120.551139,-120.550357,-120.546457,-120.544157,-120.542956,-120.541656,-120.543656,-120.545356,-120.544856,-120.541956,-120.540056,-120.534156,-120.530056,-120.528456,-120.525956,-120.524455,-120.523855,-120.524455,-120.527555,-120.529355,-120.533055,-120.537556,-120.540256,-120.542856,-120.543008,-120.541755,-120.540955,-120.536755,-120.534055,-120.532555,-120.531655,-120.529055,-120.524155,-120.521555,-120.520455,-120.521254,-120.519354,-120.516054,-120.509454,-120.506254,-120.502854,-120.497954,-120.493553,-120.48849,-120.484853,-120.481653,-120.480953,-120.481153,-120.482353,-120.487153,-120.487653,-120.485552,-120.483352,-120.480152,-120.474752,-120.472652,-120.473652,-120.476752,-120.480152,-120.482552,-120.484052,-120.483552,-120.480252,-120.476852,-120.472951,-120.469549,-120.468551,-120.468951,-120.471551,-120.474951,-120.476251,-120.476751,-120.476251,-120.475351,-120.466995,-120.464991,-120.46295,-120.457069,-120.45225,-120.44886,-120.450097,-120.453041,-120.45505,-120.45865,-120.46045,-120.46215,-120.465706,-120.463787,-120.460249,-120.458449,-120.458449,-120.461049,-120.460549,-120.461249,-120.463448,-120.463648,-120.462548,-120.464548,-120.467448,-120.468449,-120.468849,-120.470649,-120.476849,-120.479249,-120.482849,-120.486949,-120.491949,-120.494749,-120.498149,-120.50115,-120.50345,-120.506864,-120.51005,-120.51485,-120.512249,-120.508549,-120.504449,-120.503733,-120.504419,-120.626232,-120.688617,-120.729792,-120.730182,-120.729292,-120.729487,-120.728574,-120.726329,-120.727391,-120.727052,-120.728455,-120.727736,-120.726605,-120.725299,-120.722581,-120.721768,-120.720072,-120.718099,-120.719022,-120.718381,-120.718645,-120.722032,-120.722779,-120.72414,-120.72332,-120.724375,-120.723166,-120.726786,-120.727515,-120.731003,-120.733197,-120.734189,-120.737715,-120.739885,-120.742358,-120.744025,-120.745747,-120.74657,-120.747881,-120.74927,-120.75116,-120.753057,-120.75508,-120.757615,-120.761281,-120.761838,-120.76099,-120.764167,-120.765987,-120.76907,-120.769379,-120.767914,-120.767269,-120.769803,-120.770957,-120.771887,-120.776469,-120.779175,-120.781447,-120.785207,-120.789015,-120.790705,-120.791689,-120.793721,-120.79614,-120.797512,-120.799513,-120.801544,-120.802598,-120.804459,-120.807057,-120.810019,-120.810337,-120.814098,-120.816572,-120.818038,-120.82114,-120.824421,-120.826779,-120.828702,-120.830944,-120.8339,-120.83473,-120.837282,-120.838408,-120.841194,-120.846485,-120.848278,-120.850241,-120.852133,-120.855029,-120.857412,-120.858274,-120.862649,-120.866917,-120.869892,-120.874104,-120.880732,-120.883252,-120.885464,-120.889357,-120.890777,-120.891826,-120.893665,-120.89586,-120.896262,-120.900336,-120.903867,-120.906598,-120.907903,-120.91103,-120.913498,-120.915516,-120.920404,-120.921218,-120.918168,-120.919952,-120.92356,-120.925671,-120.928255,-120.929924,-120.930986,-120.932135,-120.933105,-120.934796,-120.937582,-120.939568,-120.940399,-120.941741,-120.943269,-120.944643,-120.945892,-120.948817,-120.949477,-120.95345,-120.955009,-120.952541,-120.952936,-120.95377,-120.960641,-120.96269,-120.965499,-120.969286,-120.971202,-120.976906,-120.978751,-120.979915,-120.981623,-120.982904,-120.984454,-120.987364,-120.987691,-120.990604,-120.992661,-120.994305,-120.996115,-120.996341,-120.998011,-121.002122,-121.004846,-121.005607,-121.00779,-121.009205,-121.012104,-121.013426,-121.012758,-121.01339,-121.015251,-121.017818,-121.018916,-121.019213,-121.017603,-121.017866,-121.022616,-121.024,-121.024294,-121.023358,-121.021783,-121.020802,-121.023205,-121.02369,-121.019103,-121.020535,-121.022339,-121.024289,-121.020562,-121.022387,-121.022886,-121.025146,-121.025194,-121.023648,-121.023799,-121.0217,-121.022667,-121.022588,-121.023321,-121.022639,-121.024033,-121.022217,-121.020367,-121.018924,-121.019468,-121.023617,-121.024876,-121.024135,-121.021053,-121.017426,-121.017771,-121.020739,-121.028421,-121.03044,-121.031202],"lat":[45.285857,45.288917,45.289725,45.291386,45.294684,45.297022,45.301504,45.30514,45.307148,45.309269,45.31006,45.309698,45.307644,45.306544,45.307444,45.309344,45.312644,45.318543,45.320256,45.321963,45.322652,45.320315,45.319027,45.316643,45.312945,45.309899,45.308635,45.307437,45.30694,45.306845,45.307945,45.310345,45.313445,45.316745,45.323445,45.325045,45.327145,45.331345,45.333445,45.334445,45.335645,45.337245,45.337645,45.336745,45.332645,45.331345,45.330844,45.331343,45.332443,45.336443,45.337843,45.340244,45.342046,45.345588,45.346845,45.347745,45.347745,45.347345,45.348045,45.349245,45.351645,45.356144,45.359344,45.361345,45.362645,45.362145,45.360745,45.361596,45.364245,45.370245,45.374445,45.378322,45.383145,45.387278,45.390457,45.392552,45.392414,45.391687,45.388216,45.38852,45.389224,45.391231,45.393451,45.397879,45.401146,45.409346,45.412746,45.422746,45.425346,45.427346,45.428414,45.428645,45.426945,45.427145,45.428545,45.431445,45.433645,45.434645,45.435846,45.439046,45.440546,45.445046,45.446046,45.448446,45.450346,45.454546,45.456246,45.459946,45.461546,45.461946,45.462746,45.467346,45.469146,45.471246,45.474546,45.475646,45.479546,45.483245,45.485645,45.493046,45.494646,45.497345,45.501841,45.502441,45.504841,45.506742,45.507742,45.509945,45.511466,45.514077,45.515307,45.515968,45.515946,45.517546,45.521846,45.523446,45.528746,45.528848,45.528391,45.526944,45.526771,45.527564,45.529435,45.531695,45.538782,45.539326,45.541614,45.54268,45.543979,45.549261,45.553406,45.558241,45.561148,45.564497,45.565662,45.568928,45.571842,45.576068,45.579033,45.585914,45.586685,45.589342,45.592333,45.596399,45.598387,45.600345,45.602445,45.605245,45.608839,45.613245,45.615745,45.617145,45.621645,45.626731,45.627939,45.632496,45.634693,45.636345,45.641301218792,45.640045,45.642945,45.6500815780723,45.661242,45.671545,45.6758434879127,45.686246,45.706446,45.715847,45.730147,45.7372486812962,45.732947,45.730246,45.726146,45.723946,45.722346,45.721046,45.720846,45.721546,45.720646,45.721346,45.722047,45.721447,45.717847,45.715847,45.714547,45.713047,45.706647,45.704747,45.702847,45.702247,45.701548,45.701648,45.700048,45.698648,45.696048,45.695448,45.693748,45.690648,45.686048,45.682348,45.681648,45.679448,45.678348,45.677548,45.672548,45.670148,45.669048,45.669195,45.671165,45.671852,45.671899,45.671177,45.668983,45.667379,45.666867,45.66608,45.66596,45.665119,45.663944,45.661515,45.656275,45.655788,45.655522,45.656147,45.655946,45.654991,45.654794,45.651677,45.648977,45.648871,45.643504,45.643312,45.645171,45.645177,45.645166,45.645151,45.644858,45.642019,45.640653,45.639518,45.639181,45.639391,45.638269,45.637158,45.635036,45.634178,45.633047,45.630668,45.628747,45.627752,45.626368,45.624827,45.622829,45.620066,45.619321,45.619673,45.621577,45.622016,45.624286,45.62586,45.626584,45.627031,45.626112,45.622848,45.621291,45.618006,45.615692,45.613944,45.607454,45.602365,45.598438,45.597302,45.597164,45.597602,45.597026,45.596067,45.595318,45.592508,45.589052,45.583655,45.581893,45.576728,45.574605,45.569936,45.567051,45.565666,45.563101,45.559754,45.557779,45.556725,45.555641,45.554154,45.551701,45.549859,45.548723,45.546732,45.54431,45.541528,45.538808,45.537535,45.537733,45.537249,45.535359,45.533713,45.531459,45.530316,45.53113,45.531392,45.530644,45.528385,45.527588,45.523731,45.521584,45.519428,45.518166,45.518095,45.516641,45.515253,45.51424,45.51263,45.509832,45.508034,45.505691,45.501064,45.49725,45.49655,45.49525,45.493714,45.49295,45.49445,45.496787,45.49705,45.49695,45.49745,45.49825,45.49875,45.50051,45.49795,45.49395,45.49195,45.48605,45.48365,45.48285,45.48305,45.48255,45.48185,45.47445,45.473147,45.470332,45.468636,45.468017,45.469243,45.471716,45.472994,45.475768,45.478877,45.48369,45.485275,45.485194,45.480212,45.478808,45.476929,45.476149,45.472649,45.471983,45.470249,45.468949,45.465349,45.462649,45.462049,45.462449,45.461749,45.459549,45.456549,45.455349,45.453649,45.451849,45.450549,45.446949,45.444049,45.443649,45.442549,45.440716,45.438548,45.435549,45.434349,45.434249,45.434549,45.433999,45.433249,45.431749,45.430649,45.428249,45.427949,45.428249,45.426949,45.422849,45.420549,45.419249,45.416849,45.417349,45.418649,45.419049,45.418749,45.417249,45.407749,45.405749,45.405049,45.404349,45.405449,45.405249,45.403449,45.400349,45.396349,45.394649,45.388849,45.387249,45.386549,45.385449,45.383249,45.381549,45.380449,45.381849,45.381149,45.380649,45.378649,45.376849,45.375649,45.375749,45.377849,45.376849,45.373549,45.372549,45.371849,45.371249,45.370249,45.368449,45.366149,45.363849,45.358149,45.352949,45.351749,45.349949,45.347649,45.346049,45.345249,45.344149,45.343649,45.342049,45.339249,45.336549,45.335149,45.332249,45.331449,45.331449,45.330649,45.329349,45.327749,45.328449,45.328149,45.324249,45.320949,45.319149,45.317549,45.315849,45.314749,45.311549,45.309749,45.309049,45.305749,45.304049,45.30015,45.29915,45.295949,45.294749,45.295049,45.296349,45.297849,45.302749,45.304349,45.304549,45.302549,45.298349,45.296449,45.295549,45.291449,45.288049,45.285649,45.284449,45.284449,45.283249,45.281249,45.279649,45.281049,45.281049,45.279649,45.279049,45.276049,45.274864,45.271849,45.269049,45.267249,45.262949,45.261649,45.261649,45.262449,45.26185,45.25905,45.25585,45.25495,45.253255,45.253849,45.253349,45.252749,45.250449,45.246649,45.244146,45.242426,45.240849,45.237249,45.236649,45.235149,45.231949,45.228449,45.223949,45.222449,45.220249,45.219849,45.22325,45.22465,45.22465,45.22385,45.22255,45.22035,45.21885,45.21675,45.21635,45.21665,45.21785,45.217049,45.213649,45.212507,45.210349,45.209949,45.21115,45.21125,45.21065,45.20605,45.20475,45.20445,45.20535,45.20445,45.20265,45.20105,45.19925,45.19785,45.19615,45.19555,45.19575,45.19765,45.197233,45.19485,45.19335,45.19125,45.18895,45.18665,45.18365,45.18075,45.17955,45.17945,45.18015,45.17975,45.17765,45.17565,45.17325,45.17235,45.17235,45.17155,45.17025,45.16895,45.16835,45.16595,45.16494,45.16355,45.16215,45.15955,45.15775,45.15645,45.15415,45.15185,45.15105,45.146686,45.144196,45.14405,45.145483,45.14545,45.143185,45.140883,45.139253,45.13945,45.13885,45.13795,45.13505,45.130127,45.125985,45.12315,45.12065,45.11945,45.11625,45.11165,45.10865,45.10515,45.10375,45.10115,45.10015,45.10155,45.10285,45.10695,45.10855,45.11165,45.11015,45.10505,45.10435,45.10585,45.10575,45.10455,45.1041,45.10265,45.102778,45.10135,45.09465,45.09095,45.08725,45.08565,45.083477,45.083477,45.083589,45.083695,45.083731,45.085907,45.086873,45.088765,45.089885,45.091092,45.093143,45.095639,45.097334,45.099715,45.100225,45.103616,45.105245,45.106348,45.106596,45.111056,45.114616,45.117583,45.119629,45.121757,45.124848,45.126089,45.127872,45.129578,45.130522,45.131673,45.132358,45.133054,45.135077,45.134533,45.1344,45.134805,45.136159,45.136322,45.137567,45.139557,45.140314,45.142267,45.142428,45.144024,45.144321,45.143845,45.144461,45.145745,45.149272,45.150189,45.153147,45.155435,45.156511,45.157141,45.158737,45.160367,45.162337,45.162694,45.162405,45.163256,45.162708,45.164184,45.163077,45.163302,45.164828,45.165086,45.164483,45.165388,45.165421,45.166442,45.167929,45.168318,45.167194,45.170074,45.170973,45.172641,45.172219,45.172811,45.175916,45.17698,45.175965,45.176743,45.178981,45.179206,45.180176,45.181246,45.184218,45.185869,45.1877,45.189509,45.190206,45.189711,45.193073,45.193862,45.195112,45.19465,45.196764,45.198991,45.198138,45.199481,45.200624,45.199802,45.202305,45.202158,45.201016,45.200704,45.202121,45.203031,45.203406,45.202794,45.203096,45.200337,45.199614,45.199505,45.198189,45.197811,45.198744,45.201804,45.20288,45.201783,45.20033,45.199781,45.200555,45.203523,45.203315,45.201543,45.200106,45.2006,45.199612,45.198147,45.198131,45.200084,45.200797,45.200171,45.200435,45.201916,45.201454,45.200533,45.199129,45.196589,45.196232,45.197026,45.198343,45.198167,45.200064,45.199855,45.200423,45.19887,45.198832,45.200164,45.20007,45.197788,45.198917,45.200376,45.204264,45.204362,45.203313,45.204881,45.206422,45.208369,45.20892,45.20822,45.209422,45.211071,45.211051,45.208977,45.210143,45.21213,45.212996,45.213307,45.212389,45.212678,45.215473,45.216733,45.217611,45.217972,45.218455,45.219531,45.220811,45.22145,45.222909,45.22377,45.225219,45.227813,45.229872,45.23038,45.232197,45.235346,45.236331,45.237762,45.23835,45.239548,45.241133,45.241928,45.245501,45.246643,45.249845,45.251226,45.261002,45.264107,45.264793,45.266282,45.268668,45.270476,45.271766,45.275176,45.27644,45.278573,45.281969,45.284738,45.28618,45.284328,45.28481,45.285857]}]],[[{"lng":[-123.260791,-123.260251,-123.256178,-123.254317,-123.253373,-123.25212,-123.251831,-123.251209,-123.232606,-123.227875,-123.221793,-123.214573,-123.206301,-123.203044,-123.195441,-123.19195,-123.18564,-123.185375,-123.183011,-123.183202,-123.184161,-123.18719,-123.191431,-123.19701,-123.198355,-123.198645,-123.198028,-123.19519,-123.187849,-123.18392,-123.18291,-123.182812,-123.183449,-123.183175,-123.181816,-123.179922,-123.174226,-123.171626,-123.17011,-123.169674,-123.171855,-123.172124,-123.171739,-123.17088,-123.164428,-123.16132,-123.15707,-123.150434,-123.14252,-123.136988,-123.133623,-123.126206,-123.121978,-123.119519,-123.112528,-123.110063,-123.108685,-123.105836,-123.105311,-123.101193,-123.09675,-123.095339,-123.088313,-123.078206,-123.074291,-123.073132,-123.073643,-123.074838,-123.07836,-123.084184,-123.086173,-123.087313,-123.089254,-123.092509,-123.100643,-123.105532,-123.111736,-123.114522,-123.116892,-123.117517,-123.119212,-123.119339,-123.121299,-123.12453,-123.126206,-123.133244,-123.1366,-123.143316,-123.145982,-123.147489,-123.147507,-123.149025,-123.150297,-123.150763,-123.150429,-123.146582,-123.137819,-123.133529,-123.132445,-123.1327,-123.135106,-123.137757,-123.140884,-123.143843,-123.142191,-123.139759,-123.13696,-123.133831,-123.12769,-123.123007,-123.120155,-123.119733,-123.120253,-123.118721,-123.113025,-123.111578,-123.107712,-123.106032,-123.105377,-123.100881,-123.099242,-123.095772,-123.092658,-123.089503,-123.086457,-123.081389,-123.078903,-123.076375,-123.07173,-123.066818,-123.062154,-123.061117,-123.060721,-123.061431,-123.061853,-123.060106,-123.055342,-123.053026,-123.050025,-123.044987,-123.043527,-123.042037,-123.041354,-123.040809,-123.039988,-123.039828,-123.039451,-123.041897,-123.042756,-123.041567,-123.03941,-123.035804,-123.034095,-123.031884,-123.027127,-123.024002,-123.019999,-123.018153,-123.016667,-123.015825,-123.015148,-123.01509,-123.01474,-123.013866,-123.013824,-123.014433,-123.015049,-123.015765,-123.016551,-123.017345,-123.018679,-123.018747,-123.018734,-123.018598,-123.018367,-123.018107,-123.015982,-123.014599,-123.01383,-123.013065,-123.012491,-123.01133,-123.010604,-123.007595,-123.006847,-123.005477,-123.004903,-123.001831,-123.000013,-122.998717,-122.996297,-122.996025,-122.997623,-122.998293,-122.996175,-122.993648,-122.991695,-122.990027,-122.988675,-122.986746,-122.985042,-122.979769,-122.975862,-122.974427,-122.973649,-122.973993,-122.97364,-122.97265,-122.971694,-122.969086,-122.964661,-122.962703,-122.957256,-122.955481,-122.949349,-122.947659,-122.943228,-122.937846,-122.93408,-122.931922,-122.929381,-122.929887,-122.928097,-122.925638,-122.922578,-122.919464,-122.919518,-122.916886,-122.913298,-122.909888,-122.909232,-122.906842,-122.90538,-122.902456,-122.900612,-122.899397,-122.897648,-122.895184,-122.892398,-122.891829,-122.890258,-122.884958,-122.882731,-122.87453,-122.873245,-122.873219,-122.871689,-122.868847,-122.864965,-122.861237,-122.856157,-122.852323,-122.849696,-122.8471,-122.846935,-122.848492,-122.847178,-122.845145,-122.842851,-122.839763,-122.839136,-122.832797,-122.828925,-122.825426,-122.821487,-122.819465,-122.815899,-122.813769,-122.813636,-122.812321,-122.807949,-122.805408,-122.803195,-122.804166,-122.800709,-122.794418,-122.793327,-122.787691,-122.783465,-122.779831,-122.778248,-122.773998,-122.768613,-122.765303,-122.763398,-122.762124,-122.759186,-122.757763,-122.753221,-122.748027,-122.743446,-122.737302,-122.732714,-122.729355,-122.727945,-122.726418,-122.724795,-122.721705,-122.719631,-122.715588,-122.713778,-122.705411,-122.700531,-122.696463,-122.694844,-122.690864,-122.683555,-122.680574,-122.677492,-122.670774,-122.66985,-122.660327,-122.653472,-122.65029,-122.645826,-122.64073,-122.639144,-122.634129,-122.627139,-122.621327,-122.620463,-122.618014,-122.61524,-122.607766,-122.603458,-122.599469,-122.597363,-122.582836,-122.576929,-122.572269,-122.5701,-122.569953,-122.568548,-122.568195,-122.56693,-122.564402,-122.56151,-122.553888,-122.546669,-122.542407,-122.541561,-122.538944,-122.536666,-122.532911,-122.531042,-122.521912,-122.52029,-122.522561,-122.52245,-122.520625,-122.520605,-122.519439,-122.511612,-122.50559,-122.503151,-122.496565,-122.487637,-122.484798,-122.480122,-122.477499,-122.475677,-122.475968,-122.475835,-122.473551,-122.469302,-122.46124,-122.457333,-122.454774,-122.443897,-122.443103,-122.442151,-122.441817,-122.44036,-122.436918,-122.435041,-122.431319,-122.428316,-122.423287,-122.419433,-122.412346,-122.411213,-122.410988,-122.410944,-122.411198,-122.41099,-122.41,-122.408208,-122.406298,-122.4027,-122.400882,-122.397991,-122.394416,-122.39138,-122.38863,-122.382079,-122.378629,-122.372462,-122.370076,-122.362732,-122.35614,-122.354329,-122.34955,-122.343213,-122.340708,-122.334685,-122.333374,-122.328534,-122.325742,-122.32137,-122.318858,-122.317447,-122.311568,-122.308786,-122.306909,-122.302935,-122.300164,-122.292897,-122.288569,-122.282872,-122.278591,-122.276675,-122.27376,-122.274,-122.273067,-122.271886,-122.269612,-122.264381,-122.261423,-122.259394,-122.255448,-122.255066,-122.253592,-122.250044,-122.247582,-122.246528,-122.245971,-122.242203,-122.23706,-122.237408,-122.23292,-122.231438,-122.23037,-122.22769,-122.224659,-122.222145,-122.220719,-122.218413,-122.21445,-122.210663,-122.207421,-122.204021,-122.199334,-122.198685,-122.198046,-122.196732,-122.193924,-122.189405,-122.184557,-122.179739,-122.178684,-122.174251,-122.171843,-122.166572,-122.164191,-122.161118,-122.156292,-122.154325,-122.152774,-122.149224,-122.14237,-122.138702,-122.132685,-122.130972,-122.128698,-122.124247,-122.122466,-122.121442,-122.119821,-122.119828,-122.118702,-122.11344,-122.110688,-122.108719,-122.107563,-122.103815,-122.100326,-122.096559,-122.09404,-122.088617,-122.086244,-122.08412,-122.081091,-122.077104,-122.075401,-122.074393,-122.071823,-122.069796,-122.068144,-122.065765,-122.063939,-122.060621,-122.058813,-122.056484,-122.054415,-122.050762,-122.047028,-122.046094,-122.045304,-122.040875,-122.03598,-122.034171,-122.033006,-122.030498,-122.028916,-122.026339,-122.024106,-122.020851,-122.01847,-122.016709,-122.015715,-122.011684,-122.008804,-122.005291,-122.003216,-122.001009,-121.999761,-121.996208,-121.992926,-121.984527,-121.981681,-121.980176,-121.977179,-121.974303,-121.973503,-121.971604,-121.967345,-121.966375,-121.964997,-121.963805,-121.799562,-121.800402,-121.800929,-121.799675,-121.799241,-121.800345,-121.800936,-121.800563,-121.801611,-121.801092,-121.798296,-121.798435,-121.798805,-121.799036,-121.798969,-121.79865,-121.797993,-121.797622,-121.797991,-121.799566,-121.799432,-121.797945,-121.800054,-121.801352,-121.80273,-121.802244,-121.80419,-121.805488,-121.805763,-121.808206,-121.807491,-121.80941,-121.810189,-121.811566,-121.81069,-121.806559,-121.804756,-121.802325,-121.802162,-121.800331,-121.798646,-121.800926,-121.800216,-121.795192,-121.795273,-121.793895,-121.79518,-121.796859,-121.798363,-121.799965,-121.799081,-121.800051,-121.79921,-121.800617,-121.801265,-121.800708,-121.801798,-121.803133,-121.802093,-121.802801,-121.803286,-121.804825,-121.807092,-121.806817,-121.807657,-121.811331,-121.813604,-121.8138,-121.815832,-121.816317,-121.816073,-121.813482,-121.812509,-121.813074,-121.811212,-121.809419,-121.809382,-121.809865,-121.814698,-121.815638,-121.818283,-121.819453,-121.823104,-121.824155,-121.82561,-121.829007,-121.832405,-121.834668,-121.839796,-121.843914,-121.844861,-121.84688,-121.847359,-121.848875,-121.84938,-121.847034,-121.845971,-121.844366,-121.843049,-121.844256,-121.844453,-121.843955,-121.847093,-121.849512,-121.849462,-121.847634,-121.847291,-121.848791,-121.848139,-121.848677,-121.847502,-121.844408,-121.84291,-121.841128,-121.841535,-121.844711,-121.846615,-121.846191,-121.847578,-121.847561,-121.845745,-121.84552,-121.845334,-121.844403,-121.845531,-121.843146,-121.843244,-121.841332,-121.842528,-121.845745,-121.845128,-121.846519,-121.846756,-121.846123,-121.843218,-121.843138,-121.843906,-121.843159,-121.845488,-121.846471,-121.843678,-121.845412,-121.844616,-121.843342,-121.841952,-121.843679,-121.844914,-121.845989,-121.843458,-121.842406,-121.839822,-121.83738,-121.836875,-121.837076,-121.839415,-121.84041,-121.8439,-121.843443,-121.841828,-121.840536,-121.838253,-121.837607,-121.838718,-121.838718,-121.83956,-121.838263,-121.839298,-121.840783,-121.840443,-121.838989,-121.838745,-121.840333,-121.840437,-121.838501,-121.83719,-121.838672,-121.838296,-121.838676,-121.839829,-121.840178,-121.841105,-121.840588,-121.841346,-121.837029,-121.832349,-121.829123,-121.825631,-121.824693,-121.824493,-121.825031,-121.824508,-121.822017,-121.820794,-121.820058,-121.818602,-121.819172,-121.814002,-121.812668,-121.807791,-121.80525,-121.800871,-121.799426,-121.960126,-121.964517,-122.028016,-122.027996,-122.228368,-122.264527,-122.264527,-122.32715,-122.32949,-122.332446,-122.331478,-122.328531,-122.325744,-122.328729,-122.327313,-122.330673,-122.331857,-122.334249,-122.336791,-122.339923,-122.340612,-122.347714,-122.352623,-122.354488,-122.355447,-122.35689,-122.358069,-122.361244,-122.363745,-122.364257,-122.367197,-122.371128,-122.373799,-122.379589,-122.38457,-122.384561,-122.404781,-122.404748,-122.425089,-122.425081,-122.426446,-122.430218,-122.434885,-122.438796,-122.442879,-122.445272,-122.448436,-122.451074,-122.456337,-122.457892,-122.463518,-122.465628,-122.468798,-122.470829,-122.47368,-122.478045,-122.479635,-122.484305,-122.488381,-122.492272,-122.497,-122.499506,-122.503182,-122.507203,-122.510561,-122.511964,-122.512251,-122.513425,-122.519391,-122.522442,-122.528191,-122.529542,-122.531171,-122.532942,-122.532614,-122.533745,-122.535382,-122.539632,-122.543711,-122.545794,-122.548543,-122.549707,-122.551917,-122.554953,-122.558723,-122.562413,-122.565493,-122.567339,-122.570153,-122.573085,-122.577232,-122.57778,-122.575169,-122.5754,-122.57677,-122.579831,-122.582028,-122.585624,-122.588363,-122.591986,-122.593471,-122.599071,-122.604621,-122.608342,-122.611738,-122.617391,-122.622312,-122.624857,-122.631432,-122.637437,-122.639699,-122.640716,-122.644082,-122.64493,-122.645763,-122.644542,-122.64679,-122.646853,-122.651583,-122.652553,-122.655773,-122.657909,-122.663697,-122.665931,-122.668915,-122.670787,-122.674283,-122.676247,-122.678543,-122.680863,-122.683333,-122.686703,-122.689353,-122.692063,-122.693973,-122.696412,-122.696076,-122.700224,-122.704483,-122.706473,-122.710473,-122.71472,-122.717134,-122.721184,-122.722692,-122.724937,-122.725089,-122.725697,-122.727574,-122.731121,-122.738128,-122.742034,-122.744584,-122.746347,-122.749834,-122.753255,-122.758014,-122.758905,-122.762735,-122.768734,-122.771265,-122.774074,-122.776319,-122.779134,-122.781625,-122.784205,-122.788615,-122.791085,-122.795605,-122.798259,-122.802825,-122.804727,-122.807156,-122.811705,-122.814416,-122.817065,-122.819352,-122.823015,-122.82527,-122.829074,-122.828717,-122.830352,-122.830451,-122.833148,-122.835135,-122.837442,-122.839919,-122.843403,-122.845096,-122.846854,-122.849343,-122.852796,-122.856452,-122.860134,-122.861992,-122.865465,-122.865545,-122.872923,-122.884125,-122.903999,-122.905755,-122.979199,-122.97952,-122.985827,-123.038121,-123.038427,-123.040799,-123.060853,-123.07167,-123.127696,-123.165428,-123.166002,-123.164226,-123.160434,-123.15787,-123.15911,-123.155708,-123.152389,-123.150627,-123.15034,-123.1512,-123.153386,-123.156542,-123.159533,-123.163604,-123.166868,-123.169341,-123.171308,-123.174204,-123.175342,-123.17878,-123.178903,-123.177701,-123.17501,-123.174938,-123.174054,-123.174174,-123.175133,-123.175977,-123.179931,-123.180388,-123.183671,-123.187851,-123.191102,-123.193575,-123.193657,-123.190365,-123.18975,-123.190897,-123.193752,-123.193097,-123.193766,-123.197359,-123.200105,-123.204394,-123.211304,-123.214125,-123.216178,-123.217302,-123.216802,-123.217585,-123.21691,-123.220295,-123.224557,-123.229862,-123.236564,-123.239365,-123.244844,-123.245678,-123.245334,-123.240744,-123.237425,-123.232316,-123.229898,-123.228518,-123.228599,-123.229399,-123.230581,-123.233245,-123.235102,-123.235048,-123.23319,-123.229529,-123.226797,-123.222699,-123.219661,-123.219011,-123.221167,-123.223754,-123.22595,-123.230813,-123.23416,-123.239283,-123.242288,-123.244701,-123.245157,-123.244952,-123.242821,-123.238668,-123.235868,-123.233258,-123.229297,-123.223614,-123.22345,-123.225099,-123.227668,-123.22896,-123.229146,-123.229324,-123.229331,-123.229311,-123.226797,-123.222904,-123.220377,-123.219345,-123.21938,-123.222195,-123.225841,-123.227685,-123.228054,-123.227466,-123.224857,-123.21886,-123.215459,-123.212903,-123.209194,-123.207587,-123.205287,-123.206317,-123.208492,-123.209831,-123.211306,-123.211866,-123.211785,-123.213822,-123.216462,-123.216169,-123.213992,-123.213426,-123.214276,-123.219144,-123.220156,-123.221019,-123.219354,-123.214778,-123.214409,-123.215082,-123.214343,-123.211967,-123.212619,-123.214683,-123.218023,-123.222672,-123.22581,-123.228001,-123.231079,-123.233093,-123.238067,-123.240081,-123.245055,-123.250029,-123.251728,-123.253376,-123.250254,-123.248391,-123.24579,-123.241754,-123.242113,-123.24292,-123.247404,-123.250991,-123.260151,-123.260739,-123.260791],"lat":[44.557491,44.559351,44.566167,44.571477,44.572781,44.573848,44.574095,44.574626,44.581496,44.583056,44.584597,44.585376,44.586028,44.586063,44.585615,44.585814,44.587179,44.587298,44.590002,44.593077,44.594289,44.595583,44.595896,44.59756,44.599046,44.60042,44.602857,44.604953,44.60723,44.609246,44.611036,44.613029,44.616087,44.61745,44.619,44.619901,44.620036,44.621011,44.622674,44.624542,44.62779,44.628866,44.632428,44.634245,44.637507,44.637619,44.637269,44.637507,44.63787,44.637775,44.638056,44.639291,44.640363,44.640896,44.640594,44.639801,44.639262,44.63915,44.639202,44.639818,44.640814,44.641107,44.643195,44.646585,44.649613,44.652359,44.657331,44.659373,44.662326,44.665294,44.66814,44.672546,44.674727,44.675887,44.675959,44.674763,44.674826,44.675549,44.676966,44.678592,44.682083,44.684493,44.691353,44.693903,44.696014,44.700002,44.702178,44.70831,44.711407,44.714848,44.717047,44.720225,44.722689,44.72578,44.727611,44.731585,44.736145,44.738662,44.741157,44.743363,44.745741,44.747062,44.747632,44.748914,44.7488,44.749592,44.751258,44.752109,44.751372,44.751272,44.752475,44.753731,44.756922,44.758445,44.759483,44.759049,44.752966,44.751034,44.748844,44.746553,44.746215,44.746539,44.747551,44.747011,44.745997,44.743343,44.743073,44.743504,44.74615,44.748094,44.748042,44.747124,44.744883,44.743405,44.738869,44.737684,44.737034,44.737627,44.73849,44.738451,44.73808,44.737595,44.73726,44.736823,44.735833,44.735417,44.733589,44.731045,44.728972,44.725243,44.723498,44.721804,44.720551,44.72107,44.723951,44.725578,44.725376,44.723642,44.72213,44.721154,44.719877,44.71976,44.717341,44.714894,44.712904,44.710897,44.709128,44.707409,44.705776,44.704244,44.700354,44.699592,44.699336,44.698774,44.69816,44.697591,44.694116,44.69276,44.691887,44.691194,44.690794,44.690091,44.689732,44.68794,44.686898,44.687041,44.68809,44.688924,44.686916,44.687233,44.689016,44.690286,44.69212,44.694101,44.695699,44.696058,44.693872,44.693479,44.694026,44.695985,44.696526,44.696492,44.697578,44.698606,44.700518,44.702888,44.705845,44.707984,44.709874,44.713103,44.714277,44.715557,44.721094,44.720937,44.718634,44.717986,44.715479,44.714889,44.71578,44.716995,44.719301,44.720663,44.72222,44.721852,44.723703,44.724935,44.726906,44.728611,44.729806,44.732507,44.736472,44.737503,44.739187,44.739819,44.741044,44.743794,44.744958,44.743985,44.745129,44.747499,44.748623,44.750569,44.751034,44.751136,44.752291,44.75506,44.757137,44.758216,44.7583,44.758055,44.759186,44.760755,44.76229,44.767536,44.769308,44.772644,44.774063,44.77468,44.774362,44.770896,44.770616,44.770298,44.77072,44.771708,44.775523,44.778194,44.777942,44.779591,44.783213,44.785209,44.785434,44.786855,44.78903,44.789678,44.791578,44.791537,44.791563,44.793666,44.794422,44.79278,44.792603,44.793463,44.792765,44.793174,44.792586,44.791419,44.790249,44.790451,44.789642,44.787738,44.787808,44.789479,44.789109,44.789677,44.792106,44.793214,44.792929,44.791364,44.789338,44.781647,44.780196,44.778523,44.777245,44.777267,44.77602,44.775417,44.776088,44.777371,44.777923,44.777574,44.777719,44.780277,44.781136,44.781976,44.782401,44.784738,44.787054,44.787861,44.787851,44.789107,44.789213,44.788863,44.788271,44.784075,44.782461,44.778181,44.777804,44.777214,44.776476,44.775558,44.774732,44.774716,44.774001,44.771258,44.769646,44.768072,44.767942,44.768217,44.767362,44.766239,44.765619,44.764863,44.766226,44.766867,44.766805,44.764031,44.762046,44.760641,44.758945,44.755686,44.754101,44.753486,44.752692,44.750074,44.749763,44.751043,44.754001,44.755009,44.755819,44.75489,44.753934,44.752567,44.752096,44.752139,44.753742,44.755564,44.755633,44.755259,44.755009,44.754725,44.753858,44.753404,44.753528,44.755458,44.756134,44.754761,44.752751,44.751448,44.753528,44.752011,44.752512,44.752753,44.753124,44.753908,44.754134,44.754428,44.754739,44.755006,44.755047,44.753697,44.752316,44.753131,44.755029,44.754362,44.752082,44.752014,44.754975,44.756511,44.757428,44.757225,44.75766,44.75804,44.756864,44.755972,44.755412,44.756323,44.756705,44.758759,44.758822,44.759289,44.758914,44.75621,44.75611,44.75549,44.75525,44.754257,44.753979,44.753062,44.750634,44.747099,44.746135,44.741007,44.738496,44.735506,44.734203,44.732929,44.73179,44.729275,44.728796,44.725706,44.723565,44.722504,44.722005,44.720745,44.719361,44.717246,44.713068,44.706416,44.705106,44.70099,44.698465,44.697668,44.697071,44.696937,44.695981,44.694399,44.693239,44.694456,44.696236,44.695977,44.697184,44.69617,44.696784,44.700798,44.703218,44.703152,44.703685,44.705819,44.707001,44.708729,44.710244,44.713151,44.71368,44.715565,44.717039,44.717671,44.719643,44.724254,44.726127,44.7261,44.725179,44.721143,44.718005,44.718001,44.717151,44.715879,44.714143,44.713165,44.71193,44.710977,44.710107,44.708855,44.707172,44.706996,44.707611,44.707154,44.705825,44.704358,44.702552,44.702147,44.699471,44.698712,44.700608,44.700734,44.700448,44.698365,44.697478,44.697193,44.696426,44.696384,44.697513,44.697043,44.693644,44.692955,44.692841,44.692286,44.688731,44.688263,44.688084,44.687338,44.685799,44.685691,44.687201,44.688861,44.689948,44.690218,44.689988,44.690819,44.690836,44.690576,44.687317,44.686724,44.688618,44.68911,44.687445,44.687755,44.690406,44.689704,44.69226,44.693787,44.693635,44.691065,44.692141,44.691926,44.689168,44.685483,44.685564,44.684129,44.683888,44.683915,44.683013,44.67856,44.676467,44.672991,44.671413,44.665891,44.663489,44.660301,44.657456,44.654228,44.653849,44.653385,44.652762,44.652275,44.651538,44.650642,44.649507,44.64721,44.646223,44.643578,44.640313,44.639156,44.637365,44.63719,44.636033,44.633771,44.63302,44.631081,44.628211,44.623723,44.622239,44.617967,44.615767,44.61439,44.613731,44.611599,44.610439,44.608412,44.606225,44.605198,44.603152,44.600249,44.597702,44.596546,44.594056,44.592814,44.588985,44.582152,44.581321,44.579193,44.576399,44.573115,44.572228,44.570839,44.567833,44.566362,44.564929,44.562017,44.559782,44.555321,44.553353,44.551851,44.548444,44.546928,44.545235,44.54353,44.541745,44.539172,44.537376,44.534596,44.531585,44.527784,44.525157,44.519831,44.517546,44.514425,44.513812,44.513325,44.512108,44.512981,44.512045,44.511203,44.510048,44.50698,44.504256,44.502985,44.499335,44.495385,44.492775,44.491746,44.49109,44.488942,44.486706,44.484523,44.483275,44.483372,44.481512,44.479035,44.475957,44.473565,44.471833,44.470459,44.468364,44.466672,44.464364,44.462899,44.461925,44.459549,44.458411,44.454743,44.451388,44.447288,44.444912,44.441974,44.437707,44.433879,44.431791,44.430542,44.428753,44.426582,44.424733,44.420456,44.417873,44.414634,44.413395,44.4118,44.41103,44.409387,44.408824,44.407373,44.404103,44.4022,44.398504,44.395459,44.39263,44.390962,44.389094,44.387299,44.385609,44.383067,44.380153,44.376556,44.37563,44.372889,44.372037,44.370509,44.366867,44.365129,44.361769,44.359568,44.358276,44.357319,44.355981,44.35436,44.351721,44.346432,44.342144,44.340291,44.33971,44.336549,44.334022,44.331492,44.329789,44.327522,44.325139,44.322279,44.320984,44.318174,44.31418,44.312483,44.310141,44.308217,44.307229,44.303011,44.300168,44.299044,44.29663,44.293641,44.291095,44.289461,44.287955,44.285652,44.286844,44.285323,44.28498,44.283437,44.282624,44.280192,44.274814,44.273641,44.271389,44.26845,44.267804,44.263933,44.26195,44.260241,44.260656,44.260147,44.259495,44.25955,44.25828,44.257313,44.257238,44.256164,44.253818,44.253847,44.253847,44.25263,44.252841,44.249537,44.243382,44.240603,44.238506,44.237579,44.234719,44.231189,44.229606,44.227653,44.226938,44.227001,44.224454,44.221577,44.221659,44.220742,44.219183,44.217265,44.216311,44.213326,44.211748,44.211945,44.21102,44.20938,44.209667,44.210413,44.20944,44.211013,44.217063,44.216938,44.22058,44.220657,44.218198,44.218544,44.220296,44.221306,44.21871,44.218543,44.217388,44.216748,44.21805,44.219036,44.220805,44.222209,44.223039,44.222599,44.222878,44.222406,44.219196,44.219132,44.22148,44.221927,44.219967,44.222308,44.222611,44.22167,44.223448,44.2262,44.227819,44.22982,44.231535,44.230717,44.228581,44.226498,44.226715,44.228633,44.22987,44.231511,44.233706,44.23486,44.23431,44.235184,44.235022,44.235588,44.235344,44.232295,44.231089,44.230568,44.231617,44.230575,44.229347,44.228689,44.229146,44.228044,44.22979,44.234628,44.235358,44.236587,44.237819,44.238046,44.239178,44.24123,44.242953,44.244427,44.24447,44.244228,44.245298,44.246867,44.247801,44.249852,44.25002,44.249189,44.249458,44.249263,44.251096,44.252551,44.253458,44.25681,44.260088,44.264246,44.266384,44.267078,44.26881,44.269688,44.271093,44.270062,44.269093,44.268902,44.270633,44.271849,44.273535,44.27327,44.274128,44.274459,44.27373,44.273948,44.275387,44.275771,44.277019,44.278893,44.279938,44.27822,44.279319,44.27937,44.281603,44.280931,44.281778,44.282775,44.283162,44.285639,44.286668,44.286529,44.28823,44.285828,44.287467,44.286051,44.285909,44.28473,44.28724,44.289137,44.290066,44.290537,44.288119,44.286729,44.284609,44.283816,44.283909,44.2834,44.283459,44.28565,44.285866,44.285708,44.284724,44.284435,44.283952,44.284171,44.27983,44.276269,44.27639,44.275804,44.27432,44.276858,44.277106,44.278525,44.28097,44.282166,44.282285,44.283455,44.282129,44.281352,44.281187,44.283601,44.284282,44.284298,44.285539,44.285373,44.285586,44.286662,44.287317,44.25898,44.258952,44.258894,44.259129,44.200736,44.200616,44.200613,44.200572,44.200129,44.200745,44.200136,44.200077,44.200024,44.200016,44.200071,44.201877,44.204725,44.207989,44.211612,44.214094,44.219947,44.222689,44.2252,44.226627,44.228779,44.231343,44.233269,44.233078,44.235315,44.240113,44.245854,44.247537,44.248114,44.248645,44.251601,44.253056,44.255751,44.259514,44.261582,44.266608,44.267131,44.275152,44.277606,44.283431,44.283725,44.28493,44.285562,44.287587,44.290742,44.292272,44.294963,44.295892,44.29984,44.303354,44.305646,44.306974,44.308573,44.308829,44.308716,44.309222,44.309747,44.310808,44.313726,44.317272,44.32066,44.324952,44.32943,44.331266,44.330779,44.328999,44.329186,44.330984,44.332099,44.33363,44.337789,44.338879,44.339869,44.340852,44.342591,44.344606,44.345995,44.348468,44.352618,44.354622,44.356979,44.358396,44.359847,44.360124,44.359588,44.35993,44.362497,44.366149,44.36901,44.370322,44.371131,44.37205,44.374888,44.377715,44.380821,44.382254,44.384143,44.385352,44.384887,44.385229,44.386089,44.388135,44.393452,44.395505,44.39935,44.406912,44.41221,44.41312,44.414127,44.414213,44.415073,44.417256,44.416941,44.415712,44.416461,44.419436,44.422371,44.426664,44.42996,44.431889,44.433293,44.434126,44.434205,44.434638,44.434572,44.435239,44.437074,44.443038,44.445745,44.447397,44.448576,44.450269,44.452756,44.457143,44.460622,44.468473,44.471695,44.473803,44.476371,44.479649,44.481805,44.482585,44.484751,44.486962,44.488627,44.491014,44.494188,44.495079,44.501218,44.504978,44.507681,44.51022,44.510982,44.513286,44.516608,44.522623,44.524644,44.527969,44.528059,44.526172,44.525947,44.526486,44.52887,44.532434,44.536969,44.539654,44.544575,44.547324,44.548154,44.550583,44.551983,44.555148,44.556365,44.557491]}]],[[{"lng":[-123.664749,-123.648969,-123.645909,-123.64362,-123.642355,-123.64134,-123.641389,-123.64295,-123.644987,-123.650637,-123.65773,-123.659517,-123.663013,-123.664993,-123.664749],"lat":[46.24431,46.248461,46.248494,46.248936,46.248754,46.247981,46.247204,46.246304,46.246071,46.244072,46.243367,46.243493,46.242576,46.242691,46.24431]}],[{"lng":[-124.012634,-124.005028,-124.000212,-123.999324,-123.996234,-123.988866,-123.988429,-123.991718,-123.995997,-123.995521,-123.989817,-123.986252,-123.98031,-123.972942,-123.961739,-123.953971,-123.950506,-123.950413615329,-123.947417,-123.927038,-123.924050837444,-123.923582,-123.905277,-123.903064,-123.900449,-123.902501,-123.891762,-123.883336,-123.878821,-123.87478,-123.860943,-123.859272926153,-123.859049388323,-123.857591219399,-123.85574673717,-123.854801,-123.847572098271,-123.847209,-123.845341184316,-123.842849,-123.839603,-123.838415,-123.838415,-123.838415,-123.838415,-123.838415,-123.838415,-123.843644,-123.851904098175,-123.859911,-123.861859819695,-123.862896,-123.866643,-123.864209,-123.85776,-123.854941,-123.849652258608,-123.846209,-123.838801,-123.824412679777,-123.821834,-123.798702737971,-123.793936,-123.787774156994,-123.783204,-123.771027240351,-123.770201,-123.766873,-123.763308,-123.757589,-123.750569859726,-123.748097,-123.744294,-123.735733,-123.725279,-123.718149,-123.69343,-123.693131268615,-123.67865639816,-123.674178,-123.67538,-123.672039,-123.666751,-123.660868,-123.6535,-123.644231,-123.632347,-123.626436257279,-123.619512,-123.614521,-123.60196,-123.595982,-123.582434,-123.559617,-123.548156,-123.547659,-123.538092,-123.526391,-123.516188,-123.501245,-123.479644,-123.474844,-123.468743,-123.46455181596,-123.447592,-123.436254852847,-123.427629,-123.428054143685,-123.430987,-123.422645419531,-123.390404,-123.379541,-123.371433,-123.363743140809,-123.36375,-123.364023,-123.364329,-123.364652,-123.365152,-123.365677,-123.365373,-123.365968,-123.366516,-123.367438,-123.359614,-123.359489,-123.360303,-123.360564,-123.360427,-123.360365,-123.360627,-123.358826,-123.360794,-123.361003,-123.361622,-123.48513,-123.485086,-123.54582,-123.56717,-123.644355,-123.653642,-123.662297,-123.682896,-123.703567,-123.720001,-123.71984,-123.84338,-123.86475,-123.957356,-123.969078621366,-123.968018,-123.968984,-123.965982,-123.961544,-123.962232,-123.964606,-123.963968585885,-123.962515,-123.962736,-123.964284,-123.965946886424,-123.967231,-123.966477037815,-123.965629,-123.965756551586,-123.967625694786,-123.96763,-123.969864540348,-123.971516,-123.971831,-123.97413,-123.978446,-123.978286,-123.977933,-123.980423,-123.983825,-123.983734,-123.985063,-123.988716,-123.99304,-123.991272,-123.993703,-123.988391,-123.98571,-123.980835,-123.974998,-123.973854,-123.975067,-123.974074,-123.972927,-123.969991,-123.957438,-123.956212174103,-123.952063,-123.941831,-123.937578073856,-123.937471,-123.936976303464,-123.936393232754,-123.933810595383,-123.927891,-123.927931398902,-123.927973474601,-123.928928749063,-123.92933,-123.929984556436,-123.933366,-123.941611463287,-123.941929939178,-123.947531,-123.95919,-123.961625301618,-123.963419924031,-123.96377569977,-123.974124,-123.977403593384,-123.986469758432,-123.996766,-124.010344,-124.021428,-124.012634],"lat":[46.23685,46.23833,46.236416,46.233726,46.22978,46.22715,46.224132,46.220408,46.219092,46.216461,46.209224,46.208237,46.206921,46.212678,46.207916,46.207159,46.20577,46.2056637980039,46.202219,46.191617,46.1907284574343,46.190589,46.18069,46.176812,46.174343,46.168704,46.164978,46.168747,46.168089,46.162821,46.158597,46.1582557524132,46.1582100767413,46.1579121278649,46.1575352432675,46.157342,46.1586398125733,46.158705,46.1594863981209,46.160529,46.162163,46.166607,46.168457353916,46.168498,46.170013,46.1700320231959,46.171051,46.171545,46.1760307507397,46.180379,46.1823480586939,46.183395,46.187674,46.189527,46.190757,46.188465,46.1910179139907,46.19268,46.192211,46.1905845016097,46.190293,46.1952595302013,46.196283,46.1975788702633,46.19854,46.2040782109177,46.204454,46.206263,46.211033,46.213001,46.2078971118656,46.206099,46.203961,46.201257,46.195077,46.188989,46.189812,46.1899422023193,46.1962510864866,46.198203,46.212401,46.215474,46.218228,46.216296,46.214652,46.213172,46.213172,46.2141565865164,46.21531,46.217612,46.224749,46.226328,46.230525,46.243426,46.249018,46.259109,46.26061,46.263404,46.266153,46.271004,46.269131,46.267831,46.264531,46.2616183143491,46.249832,46.2381989727856,46.229348,46.2232991346567,46.181571,46.1759919270221,46.154428,46.150998,46.146372,46.1463246103232,46.135489,46.127255,46.125069,46.120724,46.111274,46.099071,46.08312,46.069546,46.058442,46.039528,46.039372,46.011211,45.953538,45.953402,45.879307,45.874827,45.866592,45.836657,45.808172,45.786853,45.779579,45.780021,45.775657,45.775055,45.775411,45.774548,45.77503,45.774656,45.77367,45.773735,45.77308,45.783218,45.783518,45.782754,45.783121,45.7830789476988,45.798472,45.802941,45.80642,45.837101,45.847203,45.856809,45.8589678554596,45.863891,45.869974,45.881946,45.8835462531041,45.884782,45.8883409650687,45.892344,45.8933296722535,45.9077737308722,45.907807,45.9091893558919,45.910211,45.915345,45.917156,45.918179,45.923825,45.928564,45.930863,45.931092,45.933217,45.935011,45.93575,45.938842,45.942494,45.946431,45.94906,45.951157,45.952828,45.956129,45.959261,45.961683,45.962858,45.966328,45.969139,45.974469,45.9747292171811,45.97561,45.97566,45.9772655771636,45.977306,45.978971753744,45.9809350830733,45.9896314000151,46.009564,46.010474,46.0114217704711,46.032939676254,46.041978,46.0467937578809,46.071672,46.0975516365884,46.0985512214542,46.116131,46.141675,46.1460979734688,46.1493573509761,46.1500035077577,46.168798,46.173895405281,46.1879867611841,46.20399,46.223514,46.230109,46.23685]}],[{"lng":[-124.035223,-124.032609,-124.031183,-124.025439,-124.025607,-124.02402,-124.021516,-124.020328,-124.016684,-124.013832,-124.008841,-124.008929,-124.011218,-124.018586,-124.025003,-124.028331,-124.036174,-124.035223],"lat":[46.285137,46.284973,46.28333,46.284567,46.290697,46.290834,46.286917,46.282975,46.279388,46.27331,46.26723,46.26557,46.265752,46.271995,46.274131,46.273967,46.281523,46.285137]}]],[[{"lng":[-121.805269,-121.804426,-121.80044,-121.798154,-121.793219,-121.788805,-121.784556,-121.781958,-121.781098,-121.781588,-121.781121,-121.778803,-121.779132,-121.779672,-121.78183,-121.781727,-121.779906,-121.778672,-121.770738,-121.766495,-121.755915,-121.752152,-121.751454,-121.749443,-121.744103,-121.740994,-121.737791,-121.735545,-121.730625,-121.725175,-121.720814,-121.717652,-121.716996,-121.718681,-121.718977,-121.722407,-121.722584,-121.715266,-121.714462,-121.710813,-121.707639,-121.699939,-121.698143,-121.697656,-121.696035,-121.693396,-121.691214,-121.688164,-121.683277,-121.680346,-121.672405,-121.660852,-121.65871,-121.66043,-121.660419,-121.660828,-121.659639,-121.656909,-121.653593,-121.652018,-121.651394,-121.652732,-121.653315,-121.652581,-121.652638,-121.653866,-121.657245,-121.660444,-121.661656,-121.662415,-121.662382,-121.662881,-121.664694,-121.665717,-121.667021,-121.677722,-121.682723,-121.685005,-121.687776,-121.69088,-121.693387,-121.695074,-121.696085,-121.699675,-121.69865,-121.700208,-121.702383,-121.706179,-121.70805,-121.708402,-121.710291,-121.71065,-121.710201,-121.710503,-121.711596,-121.712219,-121.715716,-121.718675,-121.723999,-121.725283,-121.727194,-121.728533,-121.729226,-121.730168,-121.731438,-121.732018,-121.733403,-121.736506,-121.738794,-121.740329,-121.743454,-121.746454,-121.747973,-121.748649,-121.749061,-121.748245,-121.74687,-121.741175,-121.738512,-121.736292,-121.73492,-121.73048,-121.727341,-121.719697,-121.715592,-121.714469,-121.712953,-121.711275,-121.710517,-121.709251,-121.705971,-121.703592,-121.69945,-121.698375,-121.697685,-121.691112,-121.689772,-121.685082,-121.682607,-121.684475,-121.686262,-121.685304,-121.684793,-121.681537,-121.682463,-121.680898,-121.689261,-121.691878,-121.696411,-121.696479,-121.635917,-121.614577,-121.481888,-121.480617,-121.480361,-121.480879,-121.480159,-121.481441,-121.481798,-121.481719,-121.482056,-121.481813,-121.481753,-121.482168,-121.440646,-121.440551,-121.441224595532,-121.423592,-121.401739,-121.383451776795,-121.372574,-121.365470443381,-121.351267011354,-121.33777,-121.312198,-121.294453886635,-121.287323,-121.251183,-121.215779,-121.204808148559,-121.200367,-121.196631142901,-121.195233,-121.196149220098,-121.196556,-121.183841,-121.170474994227,-121.167852,-121.145534,-121.140560367303,-121.139483,-121.131953,-121.129228277698,-121.123793795051,-121.123239617734,-121.1222,-121.120085996729,-121.117052,-121.120064,-121.084933,-121.071453407883,-121.06437,-121.033582,-121.007449,-120.983478,-120.977978,-120.953077,-120.943977,-120.915876,-120.915795173154,-120.914976,-120.914281,-120.912191,-120.909223,-120.907361,-120.904775,-120.903975,-120.904375,-120.906375,-120.911282,-120.911675,-120.909275,-120.906075,-120.901176,-120.898788,-120.896478,-120.895397,-120.895674,-120.896872,-120.903013,-120.904815,-120.905899,-120.905657,-120.906528,-120.908205,-120.909382,-120.908459,-120.903006,-120.899356,-120.898438,-120.896833,-120.890264,-120.884983,-120.884644,-120.884777,-120.884318,-120.882656,-120.877966,-120.874893,-120.869928,-120.865268,-120.864073,-120.854473,-120.853673,-120.841972,-120.838772,-120.833877,-120.827084,-120.825731,-120.82629,-120.828587,-120.834585,-120.836184,-120.837783,-120.838881,-120.838981,-120.83458,-120.833178,-120.833377,-120.838172,-120.839071,-120.839171,-120.837471,-120.837371,-120.835571,-120.836073,-120.837971,-120.845671,-120.847671,-120.856571,-120.859072,-120.860972,-120.861471,-120.861871,-120.862871,-120.865371,-120.865771,-120.865071,-120.863971,-120.859571,-120.856371,-120.851771,-120.84947,-120.84987,-120.852271,-120.854872,-120.85917,-120.86209,-120.86287,-120.86267,-120.86157,-120.86657,-120.86607,-120.868569,-120.868235,-120.866075,-120.865759,-120.866962,-120.868265,-120.872479,-120.877522,-120.879164,-120.881064,-120.883039,-120.883445,-120.889071,-120.89428,-120.898171,-120.899771,-120.899371,-120.901065,-120.904671,-120.909271,-120.914371,-120.918671,-120.920371,-120.920475,-120.919771,-120.920471,-120.921771,-120.923671,-120.930471,-120.934171,-120.938472,-120.939628,-120.939568,-120.935868,-120.933068,-120.932169,-120.93237,-120.93377,-120.935871,-120.938471,-120.940771,-120.946372,-120.949472,-120.953672,-120.955072,-120.955372,-120.953872,-120.946472,-120.945771,-120.946071,-120.947171,-120.954171,-120.955773,-120.956471,-120.959771,-120.963672,-120.966974,-120.969577,-120.97218,-120.973344,-120.974381,-120.97387,-120.972589,-120.973089,-120.979647,-120.982776,-120.985498,-120.986474,-120.988673,-120.990473,-120.992973,-120.997673,-121.000973,-121.005447,-121.007455,-121.01079,-121.01569,-121.017429,-121.018588,-121.018483,-121.019811,-121.022556,-121.024374,-121.026348,-121.031202,-121.03044,-121.028421,-121.020739,-121.017771,-121.017426,-121.021053,-121.024135,-121.024876,-121.023617,-121.019468,-121.018924,-121.020367,-121.022217,-121.024033,-121.022639,-121.023321,-121.022588,-121.022667,-121.0217,-121.023799,-121.023648,-121.025194,-121.025146,-121.022886,-121.022387,-121.020562,-121.024289,-121.022339,-121.020535,-121.019103,-121.02369,-121.023205,-121.020802,-121.021783,-121.023358,-121.024294,-121.024,-121.022616,-121.017866,-121.017603,-121.019213,-121.018916,-121.017818,-121.015251,-121.01339,-121.012758,-121.013426,-121.012104,-121.009205,-121.00779,-121.005607,-121.004846,-121.002122,-120.998011,-120.996341,-120.996115,-120.994305,-120.992661,-120.990604,-120.987691,-120.987364,-120.984454,-120.982904,-120.981623,-120.979915,-120.978751,-120.976906,-120.971202,-120.969286,-120.965499,-120.96269,-120.960641,-120.95377,-120.952936,-120.952541,-120.955009,-120.95345,-120.949477,-120.948817,-120.945892,-120.944643,-120.943269,-120.941741,-120.940399,-120.939568,-120.937582,-120.934796,-120.933105,-120.932135,-120.930986,-120.929924,-120.928255,-120.925671,-120.92356,-120.919952,-120.918168,-120.921218,-120.920404,-120.915516,-120.913498,-120.91103,-120.907903,-120.906598,-120.903867,-120.900336,-120.896262,-120.89586,-120.893665,-120.891826,-120.890777,-120.889357,-120.885464,-120.883252,-120.880732,-120.874104,-120.869892,-120.866917,-120.862649,-120.858274,-120.857412,-120.855029,-120.852133,-120.850241,-120.848278,-120.846485,-120.841194,-120.838408,-120.837282,-120.83473,-120.8339,-120.830944,-120.828702,-120.826779,-120.824421,-120.82114,-120.818038,-120.816572,-120.814098,-120.810337,-120.810019,-120.807057,-120.804459,-120.802598,-120.801544,-120.799513,-120.797512,-120.79614,-120.793721,-120.791689,-120.790705,-120.789015,-120.785207,-120.781447,-120.779175,-120.776469,-120.771887,-120.770957,-120.769803,-120.767269,-120.767914,-120.769379,-120.76907,-120.765987,-120.764167,-120.76099,-120.761838,-120.761281,-120.757615,-120.75508,-120.753057,-120.75116,-120.74927,-120.747881,-120.74657,-120.745747,-120.744025,-120.742358,-120.739885,-120.737715,-120.734189,-120.733197,-120.731003,-120.727515,-120.726786,-120.723166,-120.724375,-120.72332,-120.72414,-120.722779,-120.722032,-120.718645,-120.718381,-120.719022,-120.718099,-120.720072,-120.721768,-120.722581,-120.725299,-120.726605,-120.727736,-120.728455,-120.727052,-120.727391,-120.726329,-120.728574,-120.729487,-120.729292,-120.730182,-120.729792,-120.688617,-120.626232,-120.504419,-120.503733,-120.494548,-120.495748,-120.49516,-120.495548,-120.494048,-120.490647,-120.489647,-120.489347,-120.488547,-120.483347,-120.482647,-120.483647,-120.484947,-120.489047,-120.489747,-120.488046,-120.481046,-120.481346,-120.483446,-120.485646,-120.488946,-120.488946,-120.480945,-120.479545,-120.479645,-120.481745,-120.480864,-120.482573,-120.486545,-120.487646,-120.487246,-120.483767,-120.482877,-120.481248,-120.480046,-120.478688,-120.479487,-120.477168,-120.47751,-120.480902,-120.483766,-120.48367,-120.47929,-120.477712,-120.476773,-120.476778,-120.477292,-120.479707,-120.482025,-120.485982,-120.485821,-120.484919,-120.485083,-120.486572,-120.487029,-120.489133,-120.488231,-120.482655,-120.479385,-120.481685,-120.480293,-120.478641,-120.476528,-120.472884,-120.474898,-120.47708,-120.476621,-120.472776,-120.470495,-120.470127,-120.471271,-120.471074,-120.468709,-120.468899,-120.474136,-120.473566,-120.469777,-120.467323,-120.462494,-120.460798,-120.458259,-120.455771,-120.454775,-120.453485,-120.450991,-120.444521,-120.43946,-120.436328,-120.436139,-120.438784,-120.440553,-120.446918,-120.451259,-120.455737,-120.458764,-120.460126,-120.460353,-120.459592,-120.456202,-120.454706,-120.454163,-120.455204,-120.452471,-120.445746,-120.443361,-120.439561,-120.43628,-120.435567,-120.433469,-120.427549,-120.424464,-120.41846,-120.413864,-120.41258,-120.411979,-120.410794,-120.410061,-120.40829,-120.405558,-120.405045,-120.405023,-120.401587,-120.400495,-120.397282,-120.394199,-120.390315,-120.387086,-120.380249,-120.378686,-120.376617,-120.372173,-120.371441,-120.68959,-120.923309,-120.989505,-121.08948,-121.090568,-121.091897,-121.210841,-121.351973,-121.725068,-121.725068,-121.752994,-121.750261,-121.746671,-121.745258,-121.742441,-121.741864,-121.742406,-121.748587,-121.751069,-121.753182,-121.750034,-121.747874,-121.747741,-121.746221,-121.739922,-121.736936,-121.733528,-121.734223,-121.735253,-121.734396,-121.730737,-121.728208,-121.726138,-121.724519,-121.723013,-121.71822,-121.715592,-121.714854,-121.71456,-121.723005,-121.728994,-121.732821,-121.735372,-121.738297,-121.742614,-121.747297,-121.747324,-121.744585,-121.744453,-121.745436,-121.748452,-121.752417,-121.754124,-121.760379,-121.76256,-121.764083,-121.766527,-121.772236,-121.773775,-121.777156,-121.77977,-121.78285,-121.787028,-121.789703,-121.79511,-121.796127,-121.790661,-121.786735,-121.785612,-121.785593,-121.786147,-121.787787,-121.791112,-121.792162,-121.792475,-121.794783,-121.79603,-121.798502,-121.798684,-121.800131,-121.803345,-121.802626,-121.801623,-121.802935,-121.803471,-121.802547,-121.803163,-121.804406,-121.805667,-121.805269],"lat":[45.011496,45.012877,45.015183,45.01615,45.017471,45.016028,45.015132,45.015214,45.016312,45.018144,45.021486,45.026237,45.030126,45.031646,45.033698,45.034399,45.035136,45.037277,45.039837,45.03958,45.037218,45.036162,45.034836,45.034098,45.03385,45.034428,45.033616,45.034668,45.036182,45.036784,45.036915,45.037566,45.038037,45.039285,45.042325,45.044095,45.045432,45.051756,45.053214,45.055912,45.057054,45.05852,45.059579,45.061626,45.062866,45.06365,45.065692,45.067109,45.068012,45.068111,45.067683,45.066362,45.066355,45.069473,45.073623,45.075258,45.079635,45.082515,45.084943,45.086706,45.088803,45.097111,45.098582,45.099886,45.101992,45.102852,45.103177,45.104415,45.105425,45.107592,45.11335,45.114456,45.115172,45.11972,45.120519,45.12236,45.123572,45.12369,45.122474,45.11806,45.116934,45.117392,45.118883,45.12179,45.123789,45.127066,45.129102,45.131594,45.134055,45.137271,45.14039,45.143283,45.148733,45.150597,45.152824,45.153424,45.154039,45.156838,45.158354,45.159339,45.161556,45.164721,45.168594,45.170314,45.170633,45.170913,45.174913,45.176313,45.180374,45.182227,45.183795,45.18635,45.188995,45.1918,45.197559,45.2051,45.205997,45.206788,45.206156,45.206919,45.208963,45.211543,45.212044,45.211691,45.210941,45.21133,45.212368,45.215347,45.21847,45.21998,45.221466,45.2233,45.224054,45.226448,45.227391,45.229558,45.22965,45.228409,45.228988,45.230368,45.233301,45.235873,45.240067,45.243495,45.247204,45.250581,45.251348,45.254141,45.255359,45.25792,45.258059,45.257377,45.258128,45.272711,45.286679,45.294275,45.315542,45.34583,45.403625,45.435496,45.482753,45.490679,45.505055,45.519604,45.519394,45.53276,45.6973034385521,45.69399,45.692887,45.6992977172998,45.703111,45.7034861389801,45.7042362225356,45.704949,45.699925,45.6907187476547,45.687019,45.67839,45.671238,45.6559982544447,45.649829,45.6350456589765,45.629513,45.6206319670926,45.616689,45.606441,45.6061542691238,45.606098,45.607886,45.6112362771232,45.611962,45.609762,45.6115234451054,45.6150366628937,45.6153949206591,45.616067,45.6169088233693,45.618117,45.623134,45.647893,45.6509451315419,45.652549,45.650998,45.653217,45.648344,45.649345,45.656745,45.656445,45.641345,45.641301218792,45.636345,45.634693,45.632496,45.627939,45.626731,45.621645,45.617145,45.615745,45.613245,45.608839,45.605245,45.602445,45.600345,45.598387,45.596399,45.592333,45.589342,45.586685,45.585914,45.579033,45.576068,45.571842,45.568928,45.565662,45.564497,45.561148,45.558241,45.553406,45.549261,45.543979,45.54268,45.541614,45.539326,45.538782,45.531695,45.529435,45.527564,45.526771,45.526944,45.528391,45.528848,45.528746,45.523446,45.521846,45.517546,45.515946,45.515968,45.515307,45.514077,45.511466,45.509945,45.507742,45.506742,45.504841,45.502441,45.501841,45.497345,45.494646,45.493046,45.485645,45.483245,45.479546,45.475646,45.474546,45.471246,45.469146,45.467346,45.462746,45.461946,45.461546,45.459946,45.456246,45.454546,45.450346,45.448446,45.446046,45.445046,45.440546,45.439046,45.435846,45.434645,45.433645,45.431445,45.428545,45.427145,45.426945,45.428645,45.428414,45.427346,45.425346,45.422746,45.412746,45.409346,45.401146,45.397879,45.393451,45.391231,45.389224,45.38852,45.388216,45.391687,45.392414,45.392552,45.390457,45.387278,45.383145,45.378322,45.374445,45.370245,45.364245,45.361596,45.360745,45.362145,45.362645,45.361345,45.359344,45.356144,45.351645,45.349245,45.348045,45.347345,45.347745,45.347745,45.346845,45.345588,45.342046,45.340244,45.337843,45.336443,45.332443,45.331343,45.330844,45.331345,45.332645,45.336745,45.337645,45.337245,45.335645,45.334445,45.333445,45.331345,45.327145,45.325045,45.323445,45.316745,45.313445,45.310345,45.307945,45.306845,45.30694,45.307437,45.308635,45.309899,45.312945,45.316643,45.319027,45.320315,45.322652,45.321963,45.320256,45.318543,45.312644,45.309344,45.307444,45.306544,45.307644,45.309698,45.31006,45.309269,45.307148,45.30514,45.301504,45.297022,45.294684,45.291386,45.289725,45.288917,45.285857,45.28481,45.284328,45.28618,45.284738,45.281969,45.278573,45.27644,45.275176,45.271766,45.270476,45.268668,45.266282,45.264793,45.264107,45.261002,45.251226,45.249845,45.246643,45.245501,45.241928,45.241133,45.239548,45.23835,45.237762,45.236331,45.235346,45.232197,45.23038,45.229872,45.227813,45.225219,45.22377,45.222909,45.22145,45.220811,45.219531,45.218455,45.217972,45.217611,45.216733,45.215473,45.212678,45.212389,45.213307,45.212996,45.21213,45.210143,45.208977,45.211051,45.211071,45.209422,45.20822,45.20892,45.208369,45.206422,45.204881,45.203313,45.204362,45.204264,45.200376,45.198917,45.197788,45.20007,45.200164,45.198832,45.19887,45.200423,45.199855,45.200064,45.198167,45.198343,45.197026,45.196232,45.196589,45.199129,45.200533,45.201454,45.201916,45.200435,45.200171,45.200797,45.200084,45.198131,45.198147,45.199612,45.2006,45.200106,45.201543,45.203315,45.203523,45.200555,45.199781,45.20033,45.201783,45.20288,45.201804,45.198744,45.197811,45.198189,45.199505,45.199614,45.200337,45.203096,45.202794,45.203406,45.203031,45.202121,45.200704,45.201016,45.202158,45.202305,45.199802,45.200624,45.199481,45.198138,45.198991,45.196764,45.19465,45.195112,45.193862,45.193073,45.189711,45.190206,45.189509,45.1877,45.185869,45.184218,45.181246,45.180176,45.179206,45.178981,45.176743,45.175965,45.17698,45.175916,45.172811,45.172219,45.172641,45.170973,45.170074,45.167194,45.168318,45.167929,45.166442,45.165421,45.165388,45.164483,45.165086,45.164828,45.163302,45.163077,45.164184,45.162708,45.163256,45.162405,45.162694,45.162337,45.160367,45.158737,45.157141,45.156511,45.155435,45.153147,45.150189,45.149272,45.145745,45.144461,45.143845,45.144321,45.144024,45.142428,45.142267,45.140314,45.139557,45.137567,45.136322,45.136159,45.134805,45.1344,45.134533,45.135077,45.133054,45.132358,45.131673,45.130522,45.129578,45.127872,45.126089,45.124848,45.121757,45.119629,45.117583,45.114616,45.111056,45.106596,45.106348,45.105245,45.103616,45.100225,45.099715,45.097334,45.095639,45.093143,45.091092,45.089885,45.088765,45.086873,45.085907,45.083731,45.083695,45.083589,45.083477,45.083477,45.07465,45.07005,45.068279,45.06355,45.06295,45.06315,45.06095,45.05855,45.05785,45.05695,45.05635,45.05345,45.05195,45.04855,45.04715,45.04315,45.03895,45.03705,45.03415,45.03255,45.02915,45.02705,45.02115,45.01895,45.01525,45.01105,45.009024,45.007686,45.00615,45.002949,45.00165,45.000113,44.998224,44.992758,44.989763,44.988537,44.984596,44.981876,44.980374,44.978676,44.975432,44.972849,44.972941,44.972278,44.970088,44.967456,44.966344,44.965188,44.965194,44.962749,44.960692,44.959686,44.956472,44.955769,44.954047,44.951299,44.950682,44.949244,44.947337,44.945507,44.943142,44.942458,44.940262,44.935458,44.933343,44.932197,44.929493,44.927367,44.924502,44.922126,44.919343,44.916909,44.913847,44.913388,44.909661,44.908162,44.907436,44.907439,44.905528,44.903973,44.903736,44.905132,44.907264,44.908317,44.908663,44.904258,44.899629,44.894791,44.894064,44.888013,44.886701,44.884591,44.884215,44.88281,44.881199,44.878216,44.876113,44.874285,44.873867,44.872612,44.869667,44.865607,44.8644,44.863058,44.863812,44.863607,44.862316,44.860148,44.85675,44.853686,44.853468,44.853762,44.852907,44.852174,44.848417,44.845693,44.840381,44.839552,44.839274,44.838678,44.833779,44.830843,44.830109,44.829377,44.829201,44.829733,44.829257,44.826872,44.826877,44.825007,44.822846,44.821769,44.822491,44.822996,44.823135,44.823272,44.824093,44.825098,44.825067,44.8247,44.825519,44.829919,44.829919,44.832677,44.837387,44.841401,44.845514,44.847398,44.853292,44.855163,44.856706,44.86124,44.864573,44.869565,44.872298,44.875394,44.876673,44.879812,44.882059,44.88572,44.888473,44.88931,44.890799,44.891348,44.893142,44.895375,44.896167,44.89745,44.900018,44.90277,44.90613,44.906315,44.904814,44.906819,44.907761,44.910179,44.912122,44.914636,44.917166,44.91983,44.920925,44.923042,44.927539,44.93057,44.932036,44.938447,44.941233,44.941952,44.941721,44.93984,44.938213,44.936857,44.935153,44.935654,44.935457,44.934682,44.935668,44.937426,44.941371,44.945223,44.947412,44.950377,44.952248,44.95477,44.956569,44.95786,44.959666,44.964926,44.970487,44.973167,44.974963,44.976452,44.977103,44.981021,44.982743,44.987321,44.992173,44.995386,44.999614,45.002217,45.006124,45.011496]}]],[[{"lng":[-122.001944,-122.001623,-122.000095,-121.997755,-121.995526,-121.99214,-121.98666,-121.981146,-121.977014,-121.968364,-121.964918,-121.9657,-121.967951,-121.969516,-121.972147,-121.973742,-121.974541,-121.978135,-121.980509,-121.980619,-121.982442,-121.985633,-121.98691,-121.985717,-121.986267,-121.985716,-121.984519,-121.98475,-121.983119,-121.981099,-121.980832,-121.979319,-121.979573,-121.978224,-121.976117,-121.973488,-121.972889,-121.973084,-121.972422,-121.967826,-121.966917,-121.967179,-121.971795,-121.973498,-121.974607,-121.975179,-121.974629,-121.973125,-121.973588,-121.975842,-121.977,-121.978262,-121.977949,-121.975456,-121.973689,-121.975571,-121.975173,-121.978289,-121.979648,-121.981007,-121.981248,-121.975677,-121.974351,-121.974141,-121.970437,-121.971991,-121.970119,-121.968164,-121.967095,-121.963562,-121.961437,-121.965522,-121.969048,-121.969609,-121.968894,-121.96538,-121.962544,-121.960507,-121.964026,-121.966186,-121.96739,-121.967844,-121.967157,-121.967348,-121.968382,-121.966654,-121.964404,-121.964924,-121.964537,-121.963754,-121.967767,-121.97073,-121.974371,-121.97546,-121.975565,-121.974278,-121.974756,-121.973495,-121.973657,-121.975264,-121.976611,-121.977799,-121.976763,-121.976052,-121.975226,-121.974803,-121.975192,-121.9744,-121.974401,-121.976081,-121.976173,-121.974896,-121.97542,-121.975358,-121.975113,-121.972875,-121.972931,-121.968548,-121.965431,-121.962046,-121.961483,-121.959462,-121.9575,-121.956466,-121.95296,-121.95134,-121.951391,-121.952638,-121.952256,-121.947402,-121.94521,-121.943782,-121.94233,-121.937524,-121.932415,-121.931269,-121.931479,-121.93656,-121.939333,-121.936964,-121.934322,-121.931438,-121.929404,-121.928213,-121.923578,-121.920359,-121.916801,-121.916265,-121.913613,-121.911588,-121.907868,-121.905856,-121.904318,-121.901482,-121.899743,-121.898393,-121.893921,-121.892574,-121.891442,-121.888545,-121.884325,-121.876903,-121.871602,-121.869385,-121.868029,-121.86838,-121.866636,-121.865553,-121.865855,-121.869966,-121.868366,-121.86649,-121.864863,-121.865338,-121.861553,-121.862399,-121.861353,-121.861569,-121.860927,-121.858364,-121.858102,-121.859205,-121.858174,-121.858124,-121.859497,-121.859435,-121.858022,-121.85998,-121.859711,-121.857063,-121.853218,-121.851462,-121.848898,-121.84539,-121.841387,-121.836722,-121.841469,-121.84356,-121.84511,-121.845087,-121.843135,-121.837282,-121.835963,-121.83679,-121.835458,-121.832449,-121.828402,-121.830273,-121.831355,-121.833384,-121.829239,-121.829103,-121.827099,-121.825663,-121.824533,-121.824299,-121.822384,-121.822016,-121.823599,-121.825381,-121.825042,-121.825487,-121.827324,-121.828042,-121.82955,-121.832623,-121.832785,-121.835193,-121.834472,-121.832225,-121.830059,-121.825726,-121.821394,-121.820056,-121.817468,-121.815895,-121.814176,-121.81219,-121.805421,-121.802225,-121.801513,-121.799227,-121.796501,-121.793616,-121.790365,-121.789458,-121.789211,-121.787098,-121.784547,-121.779748,-121.779395,-121.777087,-121.776779,-121.773384,-121.772481,-121.771755,-121.772156,-121.771349,-121.769259,-121.769874,-121.769311,-121.770003,-121.769573,-121.768446,-121.76807,-121.769381,-121.771345,-121.770604,-121.771649,-121.771473,-121.773003,-121.772532,-121.773339,-121.772735,-121.779553,-121.782676,-121.78402,-121.783142,-121.78342,-121.781069,-121.781132,-121.782017,-121.77888,-121.776708,-121.772426,-121.772913,-121.771647,-121.773196,-121.777229,-121.778813,-121.779738,-121.777556,-121.776464,-121.77429,-121.773407,-121.774429,-121.774047,-121.774525,-121.777485,-121.7791,-121.781511,-121.78121,-121.782174,-121.781334,-121.780652,-121.782576,-121.78161,-121.78366,-121.785631,-121.785536,-121.783458,-121.785251,-121.78406,-121.779552,-121.777905,-121.778226,-121.780239,-121.783459,-121.785753,-121.785421,-121.786562,-121.78766,-121.787806,-121.789792,-121.790457,-121.78928,-121.789648,-121.793299,-121.794053,-121.797461,-121.799426,-121.800871,-121.80525,-121.807791,-121.812668,-121.814002,-121.819172,-121.818602,-121.820058,-121.820794,-121.822017,-121.824508,-121.825031,-121.824493,-121.824693,-121.825631,-121.829123,-121.832349,-121.837029,-121.841346,-121.840588,-121.841105,-121.840178,-121.839829,-121.838676,-121.838296,-121.838672,-121.83719,-121.838501,-121.840437,-121.840333,-121.838745,-121.838989,-121.840443,-121.840783,-121.839298,-121.838263,-121.83956,-121.838718,-121.838718,-121.837607,-121.838253,-121.840536,-121.841828,-121.843443,-121.8439,-121.84041,-121.839415,-121.837076,-121.836875,-121.83738,-121.839822,-121.842406,-121.843458,-121.845989,-121.844914,-121.843679,-121.841952,-121.843342,-121.844616,-121.845412,-121.843678,-121.846471,-121.845488,-121.843159,-121.843906,-121.843138,-121.776324,-121.776324,-121.674928,-121.673699,-121.636001,-121.596883,-121.59326,-121.533117,-121.473293,-121.405495,-121.291112,-121.242113,-121.2293,-121.229289,-121.199971,-121.189792,-121.149644,-121.130934,-121.107534,-121.108065,-121.108335,-121.108537,-121.102938,-121.102883,-121.102791,-121.102781,-121.102773,-121.09243,-121.028358,-120.987271,-120.987084,-120.986955,-120.986587,-120.918109,-120.748249,-120.747848,-120.37874,-120.378107,-120.298364,-120.258386,-120.257777,-120.237934,-119.897434,-119.896581,-120.225273,-120.37771,-120.377752,-120.871802,-120.87349,-120.974959,-120.974975,-121.332969,-121.39767,-121.398498,-121.464437,-121.547864,-121.600018,-121.642987,-122.002362,-122.001944],"lat":[43.616414,43.622528,43.626357,43.62704,43.626937,43.625893,43.625632,43.625894,43.625796,43.626385,43.627045,43.62779,43.627549,43.629837,43.631689,43.633715,43.635627,43.637181,43.639685,43.64254,43.644379,43.652527,43.653858,43.656292,43.661708,43.66425,43.665708,43.667019,43.670143,43.673038,43.676079,43.680825,43.683766,43.688021,43.690301,43.691409,43.692868,43.695848,43.69714,43.701406,43.702821,43.704254,43.705008,43.706227,43.708584,43.710661,43.714027,43.715821,43.7176,43.721911,43.722386,43.724446,43.725444,43.729102,43.730635,43.733585,43.735841,43.737692,43.739082,43.741516,43.742964,43.746965,43.748549,43.750364,43.750748,43.752983,43.756832,43.757767,43.759699,43.762525,43.763745,43.765176,43.76734,43.769542,43.774753,43.777706,43.77872,43.78124,43.782628,43.784709,43.78699,43.791207,43.793313,43.795743,43.800984,43.801924,43.803954,43.805798,43.808235,43.809736,43.812761,43.813036,43.811555,43.811768,43.812541,43.817418,43.821219,43.827147,43.829345,43.827875,43.827615,43.828526,43.830226,43.834914,43.83585,43.838518,43.83999,43.84128,43.843043,43.846044,43.848478,43.851243,43.851773,43.855444,43.85757,43.859351,43.861156,43.864554,43.865763,43.865003,43.866226,43.868195,43.868549,43.870083,43.871681,43.873938,43.875554,43.876552,43.878063,43.881049,43.882058,43.884603,43.886262,43.890663,43.894213,43.897504,43.898992,43.900588,43.900866,43.903343,43.904908,43.905543,43.907347,43.909181,43.908566,43.911171,43.911488,43.912347,43.912917,43.912326,43.913876,43.913363,43.914863,43.9159,43.914537,43.912269,43.910784,43.9109,43.908658,43.90867,43.907985,43.907841,43.911681,43.911859,43.914504,43.915837,43.917106,43.919789,43.920959,43.923286,43.923898,43.925795,43.930281,43.932315,43.935837,43.937103,43.939036,43.941197,43.943048,43.944787,43.945593,43.947384,43.948783,43.951404,43.952781,43.953806,43.954542,43.958507,43.961526,43.965248,43.966596,43.966335,43.967269,43.967175,43.969574,43.971232,43.972587,43.973445,43.975021,43.976239,43.979073,43.982647,43.984745,43.985983,43.987284,43.987296,43.988727,43.989247,43.990573,43.991094,43.994496,43.995395,43.99759,44.002135,44.004224,44.008066,44.010777,44.012359,44.016406,44.019426,44.021567,44.023129,44.024752,44.029158,44.03106,44.033319,44.035576,44.037024,44.039744,44.041599,44.041365,44.044147,44.047911,44.050905,44.051832,44.051201,44.052956,44.053164,44.052251,44.052691,44.05684,44.060089,44.061662,44.067131,44.071873,44.072607,44.075019,44.076541,44.077214,44.080121,44.082353,44.085138,44.088537,44.089686,44.091034,44.094858,44.095897,44.099603,44.10134,44.10395,44.106409,44.108132,44.110428,44.11205,44.115245,44.118178,44.123916,44.125254,44.12676,44.131314,44.133307,44.134981,44.137039,44.139831,44.145276,44.14625,44.148462,44.151746,44.154322,44.155202,44.158315,44.159765,44.160744,44.159933,44.16353,44.164798,44.167583,44.169488,44.171595,44.173127,44.17565,44.178687,44.181082,44.183762,44.185623,44.187627,44.190156,44.190792,44.192042,44.194255,44.194809,44.196545,44.198499,44.199392,44.201958,44.203014,44.205326,44.20542,44.207811,44.208394,44.209599,44.212595,44.215751,44.216985,44.218877,44.221483,44.224606,44.225653,44.229239,44.230903,44.233215,44.234981,44.240762,44.243505,44.245463,44.247071,44.249326,44.25152,44.252707,44.254613,44.25828,44.25955,44.259495,44.260147,44.260656,44.260241,44.26195,44.263933,44.267804,44.26845,44.271389,44.273641,44.274814,44.280192,44.282624,44.283437,44.28498,44.285323,44.286844,44.285652,44.287955,44.289461,44.291095,44.293641,44.29663,44.299044,44.300168,44.303011,44.307229,44.308217,44.310141,44.312483,44.31418,44.318174,44.320984,44.322279,44.325139,44.327522,44.329789,44.331492,44.334022,44.336549,44.33971,44.340291,44.342144,44.346432,44.351721,44.35436,44.355981,44.357319,44.358276,44.359568,44.361769,44.365129,44.366867,44.370509,44.372037,44.372889,44.37563,44.376556,44.380153,44.383067,44.385609,44.387299,44.389094,44.390962,44.39263,44.392829,44.393402,44.393387,44.393383,44.392413,44.392578,44.392612,44.393184,44.393464,44.393153,44.392893,44.392954,44.393036,44.390646,44.390631,44.390621,44.390647,44.390635,44.3906,44.32718,44.26204,44.218519,44.218487,44.20241,44.17139,44.169238,44.138125,44.137751,44.135452,44.134026,44.076292,44.047637,43.960852,43.959365,43.95731,43.871331,43.872362,43.785429,43.785545,43.785297,43.698762,43.697376,43.6982,43.611164,43.611656,43.611489,43.615946,43.615538,43.615535,43.615384,43.617437,43.616645,43.616295,43.616218,43.616607,43.616497,43.616443,43.616648,43.615498,43.616414]}]],[[{"lng":[-123.485441,-123.463883,-123.461962,-123.461849,-123.461575,-123.461181,-123.441119,-123.440737,-123.442721,-123.421968,-123.421935,-123.402146,-123.40205,-123.361147,-123.361194,-123.361131,-123.319997,-123.320211,-123.299258,-123.299438,-123.340332,-123.340499,-123.360373,-123.376916,-123.380663,-123.380216,-123.400895,-123.423273,-123.423002,-123.443849,-123.443752,-123.464087,-123.464329,-123.464357,-123.485124,-123.484725,-123.484726,-123.361028,-123.36141,-123.361046,-123.361657,-123.361225,-123.361622,-123.34041,-123.215543,-123.195899,-123.122083,-123.115179,-123.051181,-123.050674,-123.030873,-123.0317,-123.031837,-123.011137,-122.990344,-122.990368,-122.928901,-122.929146,-122.929122,-122.929145,-122.928956,-122.929193,-122.929128,-122.918725,-122.909078,-122.908992,-122.887837,-122.887963,-122.868303,-122.867495,-122.867592,-122.866745,-122.846849,-122.846905,-122.846978,-122.826342,-122.826222,-122.826005,-122.805481,-122.805432,-122.804585,-122.803132,-122.796057,-122.795914,-122.792699,-122.795111,-122.784771,-122.78477,-122.784769,-122.784768,-122.784864,-122.784232,-122.783624,-122.78234,-122.779838,-122.774659,-122.77215,-122.76609,-122.765076,-122.764412,-122.764436,-122.764439,-122.764458,-122.764459,-122.764472,-122.764486,-122.764464,-122.743862,-122.743859,-122.743859,-122.743856,-122.743847,-122.743828,-122.743815,-122.743813,-122.743805,-122.743803,-122.743785,-122.743809,-122.743799,-122.743798,-122.743758,-122.743746,-122.743745,-122.743711,-122.743681,-122.743671,-122.743626,-122.743654,-122.743663,-122.743672,-122.743667,-122.743659,-122.743649,-122.743668,-122.743673,-122.743691,-122.743703,-122.743718,-122.743721,-122.743991,-122.744006,-122.74406,-122.744029,-122.743974,-122.743963,-122.743956,-122.743942,-122.743941,-122.743848,-122.743939,-122.743942,-122.743926,-122.743921,-122.743919,-122.743915,-122.743922,-122.743933,-122.743923,-122.743923,-122.743856,-122.743798,-122.743811,-122.743868,-122.743741,-122.746817,-122.75407,-122.764942,-122.769123,-122.784896,-122.786266,-122.787507,-122.80547,-122.805556,-122.807188,-122.82066,-122.825967,-122.842499,-122.843407,-122.846494,-122.846485,-122.846503,-122.851912,-122.857175,-122.867891,-122.904945,-122.908867,-122.908861,-122.908796,-122.92113,-122.928873,-122.939204,-122.962566,-122.970229,-122.97024,-122.970294,-122.970523,-122.970332,-122.9703,-122.976592,-122.979806,-122.991396,-122.99139,-122.991393,-122.991388,-123.011653,-123.011645,-123.01129,-123.014476,-123.027879,-123.032294,-123.032161,-123.05267,-123.062894,-123.063593,-123.072998,-123.083758,-123.103125,-123.112032,-123.114641,-123.114696,-123.134658,-123.135231,-123.135427,-123.137607,-123.138987,-123.142683,-123.151954,-123.156018,-123.176888,-123.180951,-123.196977,-123.209265,-123.46488,-123.48608,-123.485441],"lat":[45.447136,45.44726,45.462109,45.466555,45.47729,45.49156,45.491273,45.50533,45.521115,45.521408,45.535376,45.535646,45.550068,45.549902,45.558462,45.578779,45.578684,45.592984,45.593017,45.607247,45.607455,45.622201,45.622502,45.622077,45.621985,45.635752,45.636083,45.636176,45.65062,45.650678,45.665126,45.66514,45.669573,45.679274,45.67925,45.694472,45.708764,45.708696,45.737128,45.743418,45.757741,45.76493,45.779579,45.779849,45.77994,45.779909,45.780154,45.780131,45.779371,45.779362,45.779159,45.765779,45.75142,45.751458,45.750835,45.736459,45.735688,45.721482,45.698697,45.69381,45.67835,45.671015,45.635313,45.635399,45.635228,45.620763,45.620466,45.606352,45.606223,45.606226,45.591878,45.591881,45.591836,45.581018,45.577516,45.577521,45.568063,45.563041,45.562911,45.555687,45.556182,45.555689,45.555695,45.552082,45.54935,45.548433,45.5484,45.545158,45.543979,45.54232,45.533994,45.533982,45.533971,45.533946,45.533897,45.533809,45.533815,45.533852,45.533858,45.533822,45.531344,45.531184,45.529727,45.529634,45.528166,45.526737,45.519562,45.519509,45.516665,45.515754,45.5144,45.512509,45.509582,45.508181,45.507886,45.507374,45.506834,45.505017,45.497618,45.494665,45.494401,45.488258,45.48725,45.487084,45.484201,45.477961,45.476442,45.476439,45.469466,45.467532,45.465576,45.458486,45.456685,45.454892,45.447693,45.447284,45.444663,45.442944,45.435079,45.433294,45.426072,45.421046,45.418855,45.415311,45.407918,45.406149,45.404972,45.402702,45.402592,45.396544,45.393033,45.391704,45.387483,45.386845,45.386122,45.381513,45.377431,45.375538,45.372181,45.371751,45.359577,45.355871,45.353992,45.346587,45.332067,45.332045,45.331994,45.331928,45.331909,45.331825,45.33182,45.33182,45.331772,45.34566,45.346276,45.346233,45.346249,45.346133,45.346154,45.34595,45.328151,45.317192,45.317228,45.317273,45.317345,45.317457,45.317476,45.338071,45.346185,45.346241,45.34628,45.346332,45.346415,45.346454,45.346919,45.348862,45.353193,45.353774,45.36077,45.360932,45.361013,45.361096,45.364991,45.368009,45.375468,45.376348,45.382183,45.390905,45.390993,45.390902,45.390891,45.404962,45.404727,45.404898,45.404896,45.405082,45.404517,45.404421,45.404393,45.404383,45.418957,45.418937,45.424348,45.433459,45.433468,45.433473,45.433489,45.433528,45.433541,45.433584,45.433599,45.433667,45.433707,45.433332,45.433199,45.447136]}]],[[{"lng":[-123.785332,-123.784207,-123.784134,-123.784497,-123.78454,-123.761994,-123.741719,-123.65482,-123.644356,-123.613925,-123.606416,-123.507617,-123.483026,-123.463518,-123.463051,-123.463132,-123.463101,-123.462321,-123.463692,-123.464112,-123.465734,-123.46488,-123.209265,-123.196977,-123.180951,-123.176888,-123.156018,-123.151954,-123.142683,-123.138987,-123.137607,-123.135427,-123.135231,-123.134658,-123.114696,-123.114641,-123.112032,-123.103125,-123.083758,-123.072998,-123.063593,-123.062894,-123.05267,-123.032161,-123.032294,-123.027879,-123.014476,-123.01129,-123.011645,-123.011653,-122.991388,-122.991393,-122.99139,-122.991396,-122.979806,-122.976592,-122.9703,-122.970332,-122.970523,-122.970294,-122.97024,-122.970229,-122.962566,-122.939204,-122.928873,-122.92113,-122.908796,-122.908861,-122.908867,-122.904945,-122.867891,-122.868073,-122.849925,-122.854691,-122.858823,-122.86352,-122.867179,-122.872906,-122.879136,-122.881015,-122.882494,-122.886812,-122.889006,-122.893198,-122.898048,-122.899528,-122.904219,-122.908708,-122.912621,-122.916561,-122.919112,-122.922836,-122.92513,-122.928984,-122.932081,-122.943419,-122.947317,-122.949691,-122.952144,-122.954429,-122.957273,-122.958818,-122.959922,-122.961195,-122.9623,-122.964021,-122.967579,-122.971659,-122.974699,-122.974911,-122.974957,-122.974937,-122.975052,-122.977037,-122.981086,-122.98831,-122.99097,-122.996046,-122.999265,-122.999811,-123.000788,-123.001497,-123.001527,-122.998984,-122.998455,-122.997702,-122.996469,-122.996087,-122.995576,-122.995366,-122.996221,-122.997737,-122.999659,-123.003867,-123.007632,-123.02609,-123.035667,-123.038475,-123.04117,-123.044146,-123.046867,-123.049012,-123.051106,-123.050918,-123.049662,-123.047009,-123.045896,-123.043892,-123.041321,-123.036649,-123.028675,-123.024949,-123.022219,-123.020521,-123.018777,-123.019124,-123.018862,-123.01624,-123.015382,-123.014505,-123.011189,-123.007746,-123.001883,-123.000726,-123.003569,-123.007346,-123.011513,-123.01801,-123.023019,-123.02705,-123.028875,-123.031407,-123.033173,-123.033292,-123.032467,-123.032027,-123.031676,-123.031177,-123.028136,-123.025303,-123.022368,-123.020187,-123.015037,-123.012235,-123.009878,-123.007494,-123.001054,-122.998002,-122.996444,-122.999042,-123.002309,-123.005564,-123.008255,-123.009998,-123.014574,-123.018118,-123.027643,-123.033439,-123.036121,-123.041478,-123.044916,-123.046115,-123.051936,-123.059397,-123.062251,-123.067619,-123.068627,-123.068271,-123.068667,-123.092128,-123.186276,-123.209454,-123.249322,-123.321413,-123.339945,-123.396679,-123.412698,-123.448934,-123.468746,-123.477905,-123.478264,-123.49442,-123.495414,-123.50222,-123.550602,-123.551215,-123.561352,-123.568496,-123.57142,-123.576563,-123.599208,-123.601657,-123.622159,-123.627081,-123.657202,-123.724368,-123.724362,-123.784016,-123.784135,-123.784487,-123.784259,-123.784192,-123.784157,-123.785567,-123.785332],"lat":[45.166922,45.173379,45.202101,45.202095,45.216294,45.216283,45.216266,45.216607,45.2171,45.217103,45.216555,45.216264,45.216134,45.216312,45.259918,45.274549,45.280192,45.338244,45.367548,45.374535,45.417388,45.433332,45.433707,45.433667,45.433599,45.433584,45.433541,45.433528,45.433489,45.433473,45.433468,45.433459,45.424348,45.418937,45.418957,45.404383,45.404393,45.404421,45.404517,45.405082,45.404896,45.404898,45.404727,45.404962,45.390891,45.390902,45.390993,45.390905,45.382183,45.376348,45.375468,45.368009,45.364991,45.361096,45.361013,45.360932,45.36077,45.353774,45.353193,45.348862,45.346919,45.346454,45.346415,45.346332,45.34628,45.346241,45.346185,45.338071,45.317476,45.317457,45.317345,45.259695,45.259697,45.257252,45.254719,45.253084,45.252972,45.253827,45.254425,45.254827,45.255211,45.256531,45.257491,45.257798,45.256622,45.256719,45.259435,45.262835,45.266203,45.267445,45.268065,45.268509,45.268635,45.268621,45.268499,45.267586,45.267485,45.26826,45.270488,45.273639,45.278695,45.280509,45.281837,45.282982,45.28388,45.284894,45.285083,45.283041,45.279979,45.279143,45.278081,45.276928,45.276226,45.273321,45.271011,45.268761,45.267714,45.264811,45.261554,45.26085,45.259347,45.257284,45.254877,45.242731,45.241311,45.239953,45.238752,45.238305,45.237426,45.233981,45.230698,45.226947,45.223696,45.22217,45.222137,45.223224,45.222789,45.222272,45.220788,45.21828,45.216583,45.214705,45.211305,45.209391,45.207266,45.204744,45.201105,45.199481,45.198918,45.199434,45.201943,45.202051,45.201121,45.199841,45.19584,45.191003,45.189247,45.181566,45.177017,45.175796,45.173053,45.170955,45.167365,45.16452,45.161321,45.159498,45.160252,45.162765,45.162905,45.161894,45.160852,45.15794,45.153831,45.150825,45.146614,45.145564,45.144999,45.144303,45.141313,45.140185,45.139431,45.138747,45.136757,45.133769,45.129273,45.127319,45.123249,45.120604,45.117631,45.114694,45.11311,45.111091,45.107235,45.105444,45.101967,45.100961,45.100555,45.098953,45.097729,45.094073,45.090273,45.089197,45.086332,45.083942,45.082673,45.078925,45.076586,45.074864,45.07486,45.074932,45.075013,45.074982,45.075073,45.075527,45.075495,45.075389,45.075365,45.075293,45.0752,45.075176,45.075175,45.075138,45.07513,45.075115,45.075553,45.075568,45.075733,45.075848,45.075899,45.075976,45.076016,45.07602,45.076056,45.076067,45.076118,45.076226,45.076777,45.076657,45.087581,45.08866,45.104049,45.130885,45.144694,45.159712,45.166922]}]],[[{"lng":[-117.977663335055,-117.717852,-117.62359560026,-117.60342451872,-117.603163,-117.504833,-117.480103,-117.479935132756,-117.47536,-117.475148,-117.439943,-117.390738,-117.382131203034,-117.353928,-117.337668,-117.280513327856,-117.216731,-117.214534,-117.212616,-117.090186778506,-117.070047,-117.051304,-116.985882,-116.940681,-116.915989,-116.911409,-116.900497,-116.892861,-116.894652,-116.89091,-116.886843,-116.880506,-116.87598,-116.874869,-116.875706,-116.873933,-116.870484,-116.869655,-116.866544,-116.859795,-116.857254,-116.84355,-116.830003,-116.819182,-116.814142,-116.796555004061,-116.796051,-116.794454975327,-116.790151,-116.787792,-116.78752,-116.788923,-116.789066,-116.788329,-116.782676,-116.7634,-116.759787,-116.755288,-116.750978,-116.745219,-116.740486,-116.736268,-116.715527,-116.711822,-116.70845,-116.698079,-116.697192,-116.687007,-116.680139,-116.665344,-116.659629,-116.646342,-116.639641,-116.635814,-116.632032,-116.60504,-116.593004,-116.577422,-116.559444,-116.553548,-116.549085,-116.546643,-116.543862684798,-116.537173,-116.535698,-116.538014,-116.536395,-116.535396,-116.528272,-116.523961,-116.512326,-116.49451,-116.487894,-116.487274,-116.487835,-116.487447,-116.484219,-116.483286,-116.482495,-116.48282653917,-116.482899,-116.482806,-116.481018,-116.475803,-116.472346,-116.471241,-116.472882,-116.469813,-116.46517,-116.463504,-116.463635,-116.471646,-116.474702,-116.476521,-116.480788,-116.483105,-116.483412,-116.481208,-116.481943,-116.48297,-116.490279,-116.502756,-116.503728,-116.503156,-116.503957,-116.506967,-116.510342,-116.513931,-116.517468,-116.522233,-116.525888,-116.527723,-116.528558,-116.52828,-116.526201,-116.523947,-116.523638,-116.527492979455,-116.535482,-116.543837,-116.548676,-116.5525,-116.554634,-116.556587,-116.557587,-116.556575,-116.554549,-116.553473,-116.553171,-116.558804,-116.558803,-116.55498,-116.554829,-116.561744,-116.563985,-116.575949,-116.581382,-116.588195,-116.592416,-116.597447,-116.619057,-116.626633,-116.653252,-116.673793,-116.674648,-116.672594,-116.672163,-116.672733,-116.674493,-116.675587,-116.681013,-116.687027,-116.687174152113,-116.695619,-116.698661,-116.703181,-116.704217,-116.708003,-116.70975,-116.708546,-116.709536,-116.724205,-116.724192007616,-116.724188,-116.725137,-116.727452,-116.728757,-116.729607,-116.731216,-116.734021,-116.742962,-116.745535,-116.746607,-116.748564,-116.752839,-116.754643,-116.774847,-116.782492,-116.783537,-116.784244,-116.783771926572,-117.022673,-117.022673,-117.091719,-117.266005,-117.266006,-117.266006,-117.320193,-117.373361,-117.476684,-117.476762,-117.496311,-117.501432,-117.520941,-117.520674,-117.522313,-117.522249,-117.542216,-117.542058,-117.561969,-117.562208,-117.582166,-117.582674,-117.582344,-117.622801,-117.622777,-117.643494,-117.643485,-117.663391,-117.664146,-117.68379,-117.683951,-117.683794,-117.683986,-117.727235,-117.727225,-117.730633,-117.745959,-117.746137,-117.767063,-117.766865,-117.787623,-117.788395,-117.74765,-117.747464,-117.747405,-117.747327,-117.97298,-117.977639,-117.977663335055],"lat":[46.0007234754428,45.999866,45.999061415294,45.9988892323573,45.998887,45.998317,45.99787,45.9978694691105,45.997855,45.997893,45.998633,45.998598,45.9980721459827,45.996349,45.998662,45.9985173847898,45.998356,45.99832,45.998321,45.9976245645994,45.99751,45.996849,45.996974,45.996274,45.995413,45.988912,45.982801,45.976373,45.969686,45.96001,45.958617,45.958508,45.95441,45.950253,45.945008,45.939894,45.932408,45.923799,45.916958,45.907264,45.904159,45.892273,45.886405,45.880938,45.877551,45.8590045012698,45.858473,45.8561406398762,45.849851,45.844267,45.840204,45.836741,45.833471,45.831928,45.825376,45.81658,45.816167,45.817061,45.818537,45.821394,45.82446,45.826179,45.826773,45.826267,45.825117,45.820852,45.820135,45.806319,45.79359,45.781998,45.780016,45.779815,45.781274,45.783642,45.784979,45.781018,45.778541,45.76753,45.755189,45.753388,45.752735,45.750972,45.7469544885719,45.737288,45.734231,45.714929,45.69665,45.691734,45.681473,45.677639,45.670224,45.655679,45.649769,45.647675,45.644302,45.643682,45.642322,45.641529,45.639916,45.6367721223766,45.636085,45.633595,45.632152,45.6317,45.629409,45.627669,45.624884,45.620604,45.617986,45.615785,45.602785,45.593647,45.59179,45.589673,45.587942,45.58516,45.582615,45.580597,45.577898,45.577008,45.574499,45.566608,45.565102,45.562754,45.560953,45.558427,45.556809,45.556281,45.55679,45.555626,45.553734,45.551818,45.551078,45.54989,45.549482,45.548234,45.54661,45.539602100419,45.525079,45.514193,45.510385,45.508311,45.507856,45.506232,45.503217,45.501388,45.500154,45.499107,45.495932,45.481188,45.480076,45.472801,45.46293,45.461213,45.460169,45.452522,45.448984,45.44292,45.427356,45.41277,45.39821,45.388037,45.351084,45.321511,45.314342,45.298023,45.288938,45.283183,45.276349,45.274867,45.27072,45.267857,45.2676428484611,45.255353,45.245552,45.2408,45.227972,45.222317,45.217243,45.207356,45.203015,45.171501,45.164945960344,45.162924,45.159072,45.156023,45.144381,45.142091,45.139934,45.138289,45.134898,45.133038,45.124878,45.122945,45.121768,45.113972,45.105536,45.09579,45.093605,45.088128,45.078265731912,45.079167,45.079734,45.080158,45.08057,45.152442,45.166539,45.166537,45.16654,45.166539,45.209973,45.209977,45.210148,45.209768,45.223598,45.253458,45.267731,45.267424,45.295956,45.295879,45.310219,45.310184,45.324359,45.338096,45.338171,45.336789,45.33687,45.365322,45.365749,45.428344,45.428365,45.441917,45.506771,45.51523,45.51478,45.61699,45.61692,45.616635,45.660736,45.660227,45.689605,45.689567,45.773515,45.773625,45.833238,45.850523,45.861072,45.860595,45.860602,46.0007234754428]}]],[[{"lng":[-120.005565,-120.005124,-120.004752,-120.004859,-120.004783,-119.999242,-119.998172,-119.998161,-119.999501176112,-119.965744,-119.908917240841,-119.907461,-119.876144,-119.868272037091,-119.868135,-119.802655,-119.772927,-119.729909361077,-119.672199870904,-119.669877,-119.623393,-119.600549,-119.571584,-119.536946521092,-119.524632,-119.487829,-119.456238441501,-119.450256,-119.432149953782,-119.432128,-119.432181,-119.432054,-119.434665,-119.434772,-119.435024,-119.434695,-119.434788,-119.434603,-119.434622,-119.43455,-119.434644,-119.434606,-119.43464,-119.248547,-119.248444,-119.248214,-119.145144,-119.14561,-119.148243,-119.147264,-119.146789,-119.146424,-119.163037,-119.162966,-119.306043,-119.306611,-119.544565,-119.552894,-119.593374,-119.603647,-119.667065,-119.672228,-119.770244,-119.781719,-119.791162,-119.790961,-119.790699,-119.790831,-119.760731,-119.759759,-119.883914,-119.882356,-119.882346,-119.897751,-120.006555,-120.005565],"lat":[45.350553,45.385771,45.501959,45.502468,45.517157,45.517539,45.68439,45.687968,45.8124817188485,45.824365,45.8280408039571,45.828135,45.834718,45.8359407146783,45.835962,45.84753,45.845578,45.8502905291199,45.8566125323665,45.856867,45.905639,45.919581,45.925456,45.913024662526,45.908605,45.906307,45.9155950765374,45.917354,45.918250445405,45.90729,45.879312,45.865421,45.864893,45.828536,45.826207,45.805961,45.802167,45.756429,45.746143,45.704977,45.704411,45.621409,45.602985,45.601935,45.573187,45.516076,45.515909,45.428579,45.255939,45.255936,45.171034,45.08294,45.082943,44.996241,44.995696,44.995993,44.995689,44.995311,44.99531,44.994539,44.994664,44.995117,44.995193,44.994816,44.994755,45.023517,45.067823,45.081253,45.081278,45.169211,45.169152,45.25596,45.256916,45.257017,45.257706,45.350553]}]],[[{"lng":[-121.3513,-121.349315,-121.349247,-121.348471,-121.332413,-121.332609,-121.332969,-120.974975,-120.974959,-120.87349,-120.871802,-120.377752,-120.37771,-120.225273,-119.896581,-119.895163,-119.895056,-119.896465,-119.896969,-119.932611,-119.931944,-119.931595,-119.943504,-119.943441,-119.943779,-119.706005,-119.705858,-119.365337,-119.365156,-119.363896,-119.363648,-119.363579,-119.359446,-119.360121480893,-119.360177,-119.444598,-119.72573,-119.790087,-119.848907,-119.872929,-119.876054,-119.986801,-119.999234,-120.046745935305,-120.088176,-120.159409852771,-120.160711,-120.188026,-120.272095999129,-120.276920753459,-120.284045,-120.325751,-120.326387,-120.328538964699,-120.328540043301,-120.413985011427,-120.489013,-120.508434445763,-120.564863,-120.61589,-120.680984,-120.786166,-120.819216277206,-120.878231,-120.879925977229,-120.879805,-120.880501,-120.880436,-120.882106,-120.882106,-120.883327,-120.899236,-120.996696,-120.996685,-121.131887,-121.349679,-121.350007,-121.35053,-121.35055,-121.3513],"lat":[42.919989,43.089928,43.111683,43.356753,43.356663,43.473058,43.616645,43.617437,43.615384,43.615535,43.615538,43.615946,43.611489,43.611656,43.611164,43.592745,43.568127,43.353816,43.179017,43.178963,42.976439,42.917005,42.917079,42.753671,42.746371,42.746605,42.748791,42.748958,42.661822,42.487079,42.220094,42.137231,42.13723,41.9943837248054,41.994384,41.995478,41.996296,41.997544,41.997281,41.997641,41.997199,41.995709,41.994944,41.9948937861312,41.99485,41.994566063361,41.9945608770155,41.994452,41.9929801905817,41.9928957238404,41.992771,41.993143,41.992586,41.9925995898795,41.992599596691,41.9931391904968,41.993613,41.9935136523275,41.993225,41.993029,41.99357,41.993809,41.9937957174251,41.993772,41.9937643415584,41.996882,42.428587,42.483263,42.483262,42.486559,42.744214,42.743806,42.743688,42.746349,42.746775,42.746644,42.833905,42.91669,42.919989,42.919989]}]],[[{"lng":[-124.015851,-124.012163,-124.006057,-124.004863,-123.996836,-123.989529,-123.987671142877,-123.97734943563,-123.976188590439,-123.975425,-123.972855462376,-123.970461,-123.968660474861,-123.968232789041,-123.968187,-123.968560618402,-123.972529,-123.976507,-123.971328,-123.970173135164,-123.964276,-123.958061,-123.962607,-123.963217724763,-123.964127353106,-123.964169,-123.964380552095,-123.968982320543,-123.972899,-123.978671,-124.007756,-124.007494,-123.979715,-123.978955013993,-123.973398,-123.965728,-123.960557,-123.961131916315,-123.962035,-123.962528536153,-123.964074,-123.974665,-123.974302867085,-123.971997014932,-123.971892,-123.970804752809,-123.970154,-123.970139671867,-123.970121,-123.973381,-123.97409492245,-123.976647761464,-123.97865,-123.978534795427,-123.976544,-123.970794,-123.96634,-123.962095,-123.957568,-123.94944,-123.949468,-123.951155,-123.951567332492,-123.95319628028,-123.956711,-123.952264,-123.949998649289,-123.949787395219,-123.947632127365,-123.944234559771,-123.942805782962,-123.941981614177,-123.941433103909,-123.939964,-123.937358469373,-123.937272,-123.940394,-123.939653,-123.940874071402,-123.941568,-123.942219645651,-123.942937192789,-123.943121,-123.943567208808,-123.946027,-123.952045022158,-123.954899774688,-123.957689,-123.962908,-123.967425,-123.967841,-123.964335,-123.965567651763,-123.970272,-123.978679,-123.981732,-123.983029,-123.979597,-123.978804,-123.974456,-123.973555,-123.969302,-123.969078621366,-123.957356,-123.86475,-123.84338,-123.71984,-123.720001,-123.703567,-123.682896,-123.662297,-123.653642,-123.644355,-123.56717,-123.54582,-123.485086,-123.48513,-123.361622,-123.361225,-123.361657,-123.361046,-123.36141,-123.361028,-123.484726,-123.484725,-123.485124,-123.464357,-123.464329,-123.464087,-123.443752,-123.443849,-123.423002,-123.423273,-123.400895,-123.380216,-123.380663,-123.376916,-123.360373,-123.340499,-123.340332,-123.299438,-123.299258,-123.320211,-123.319997,-123.361131,-123.361194,-123.361147,-123.40205,-123.402146,-123.421935,-123.421968,-123.442721,-123.440737,-123.441119,-123.461181,-123.461575,-123.461849,-123.461962,-123.463883,-123.485441,-123.48608,-123.46488,-123.465734,-123.464112,-123.463692,-123.462321,-123.463101,-123.463132,-123.463051,-123.463518,-123.483026,-123.507617,-123.606416,-123.613925,-123.644356,-123.65482,-123.741719,-123.761994,-123.78454,-123.784497,-123.784134,-123.784207,-123.785332,-123.785567,-123.784157,-123.784192,-123.784259,-123.784487,-123.784135,-123.784016,-123.724362,-123.724368,-123.724663,-123.784759,-123.801472,-123.895988,-123.911026,-123.955007,-123.967184,-123.967191,-123.986688,-124.008880714497,-124.009069,-124.00977,-124.015011,-124.017991,-124.015851],"lat":[45.064759,45.076921,45.084736,45.084232,45.090167,45.094045,45.1008197766356,45.1384584412288,45.1426915261005,45.145476,45.159582575209,45.172728,45.1952852386477,45.2006433482882,45.201217,45.2025015176212,45.216145,45.21933,45.226849,45.2341520625869,45.271444,45.278013,45.281073,45.2951302262423,45.3160674015395,45.317026,45.3175073597732,45.3279780961366,45.33689,45.338854,45.336813,45.33974,45.347724,45.3485742170505,45.354791,45.386242,45.430778,45.4356126650042,45.443207,45.4446362942545,45.449112,45.467333,45.4678668620106,45.4712661853439,45.471421,45.4724857265356,45.473123,45.476818355795,45.481634,45.482538,45.4831227958426,45.4852139048169,45.486854,45.4870114900121,45.489733,45.493507,45.493417,45.497175,45.510399,45.545389,45.564829,45.565544,45.5659713979159,45.5676598626949,45.571303,45.586296,45.5986233755376,45.5997729583602,45.6115012952122,45.6299898636449,45.6377648488614,45.6422497341726,45.6452345665112,45.653229,45.6562826586659,45.656384,45.662926,45.688975,45.7035959750661,45.711905,45.7182519363268,45.7252407438024,45.727031,45.7279857578689,45.733249,45.737627056936,45.7397038636989,45.741733,45.74362,45.751041,45.755753,45.758296,45.7595095505395,45.764141,45.762156,45.76251,45.768044,45.768968,45.772913,45.774836,45.777508,45.779837,45.7830789476988,45.783121,45.782754,45.783518,45.783218,45.77308,45.773735,45.77367,45.774656,45.77503,45.774548,45.775411,45.775055,45.775657,45.780021,45.779579,45.76493,45.757741,45.743418,45.737128,45.708696,45.708764,45.694472,45.67925,45.679274,45.669573,45.66514,45.665126,45.650678,45.65062,45.636176,45.636083,45.635752,45.621985,45.622077,45.622502,45.622201,45.607455,45.607247,45.593017,45.592984,45.578684,45.578779,45.558462,45.549902,45.550068,45.535646,45.535376,45.521408,45.521115,45.50533,45.491273,45.49156,45.47729,45.466555,45.462109,45.44726,45.447136,45.433199,45.433332,45.417388,45.374535,45.367548,45.338244,45.280192,45.274549,45.259918,45.216312,45.216134,45.216264,45.216555,45.217103,45.2171,45.216607,45.216266,45.216283,45.216294,45.202095,45.202101,45.173379,45.166922,45.159712,45.144694,45.130885,45.104049,45.08866,45.087581,45.076657,45.076777,45.076226,45.044432,45.04473,45.044913,45.045552,45.045679,45.04572,45.045727,45.044843,45.044634,45.0449987048377,45.045114,45.047266,45.047969,45.049808,45.064759]}]],[[{"lng":[-121.919685,-121.911695,-121.908793,-121.901879,-121.902678,-121.903291,-121.902915,-121.906325,-121.907176,-121.908329,-121.907326,-121.910309,-121.912619,-121.913911,-121.913019,-121.911443,-121.910516,-121.910547,-121.91549,-121.918386,-121.918095,-121.915803,-121.915913,-121.914551,-121.915527,-121.915184,-121.913115,-121.915478,-121.916509,-121.918698,-121.922051,-121.922028852172,-121.908267,-121.904448014441,-121.900858,-121.900897392331,-121.901855,-121.877908566384,-121.875695401271,-121.867167,-121.858205244407,-121.838112759325,-121.811304,-121.735104,-121.711711588727,-121.707358,-121.675958711965,-121.668362,-121.638119011462,-121.631167,-121.609320387848,-121.562727136099,-121.534252432855,-121.533106,-121.531983021128,-121.523685853632,-121.522392,-121.511087960406,-121.499153,-121.494687797672,-121.494686798243,-121.483672986716,-121.481489451388,-121.467065281238,-121.462849,-121.441224595532,-121.440551,-121.440646,-121.482168,-121.481753,-121.481813,-121.482056,-121.481719,-121.481798,-121.481441,-121.480159,-121.480879,-121.480361,-121.480617,-121.481888,-121.614577,-121.635917,-121.696479,-121.695032,-121.692134,-121.690732,-121.690481,-121.689008,-121.687532,-121.685033,-121.68505,-121.684562,-121.681973,-121.68,-121.679888,-121.680813,-121.679232,-121.679081,-121.68159,-121.683547,-121.685262,-121.687945,-121.687276,-121.688772,-121.689975,-121.691752,-121.693809,-121.697615,-121.698691,-121.700932,-121.702476,-121.70326,-121.702846,-121.703592,-121.704567,-121.704223,-121.70326,-121.703546,-121.701957,-121.70123,-121.702141,-121.700918,-121.700709,-121.699231,-121.700209,-121.69756,-121.696925,-121.698113,-121.699988,-121.700473,-121.704123,-121.705532,-121.708575,-121.714579,-121.716979,-121.720904,-121.723201,-121.72419,-121.726508,-121.730946,-121.732298,-121.735074,-121.738405,-121.744622,-121.756938,-121.762165,-121.766144,-121.773181,-121.776204,-121.780122,-121.783928,-121.785633,-121.790802,-121.792696,-121.793651,-121.794539,-121.796434,-121.799679,-121.802589,-121.80456,-121.806916,-121.806939,-121.807908,-121.805791,-121.80559,-121.807583,-121.807559,-121.805977,-121.806845,-121.810726,-121.814319,-121.815501,-121.819587,-121.821485,-121.824922,-121.828898,-121.831765,-121.83527,-121.836809,-121.842521,-121.844301,-121.846764,-121.846821,-121.847872,-121.850403,-121.854653,-121.85882,-121.860323,-121.86337,-121.861111,-121.860137,-121.859828,-121.860873,-121.864656,-121.866919,-121.868187,-121.869342,-121.870166,-121.874665,-121.878538,-121.881862,-121.885605,-121.888674,-121.891749,-121.89392,-121.895902,-121.902817,-121.906688,-121.906924,-121.909746,-121.911443,-121.911614,-121.913087,-121.913761,-121.913216,-121.91644,-121.922136,-121.919685],"lat":[45.547614,45.548941,45.549992,45.55619,45.55686,45.559517,45.561121,45.561935,45.56255,45.564983,45.566723,45.566826,45.568211,45.571163,45.575168,45.576484,45.579733,45.581241,45.582447,45.585484,45.587287,45.589685,45.591609,45.593684,45.597109,45.598698,45.601297,45.605163,45.607635,45.608288,45.610761,45.6491618990508,45.654399,45.6583215914573,45.662009,45.662353021086,45.670716,45.6862907085108,45.6877301463022,45.693277,45.6954401547252,45.7002900029046,45.706761,45.694039,45.6946881803028,45.694809,45.7030807428963,45.705082,45.7047364355389,45.704657,45.7095324475309,45.7199305336331,45.7262851537756,45.726541,45.7263456264124,45.7249021020319,45.724677,45.7228135043382,45.720846,45.7184501847691,45.718449648523,45.7125401610082,45.7113685797871,45.7036292560113,45.701367,45.6973034385521,45.53276,45.519394,45.519604,45.505055,45.490679,45.482753,45.435496,45.403625,45.34583,45.315542,45.294275,45.286679,45.272711,45.258128,45.257377,45.258059,45.25792,45.263859,45.268412,45.271641,45.275625,45.276153,45.279234,45.281798,45.283681,45.286259,45.287942,45.290025,45.292672,45.294816,45.295895,45.297177,45.299775,45.300714,45.30306,45.30503,45.306251,45.309477,45.316379,45.319453,45.321348,45.322947,45.323929,45.327889,45.329188,45.331267,45.334258,45.338957,45.339223,45.344448,45.346629,45.349016,45.35187,45.356172,45.363389,45.364545,45.366277,45.368338,45.369899,45.371963,45.373564,45.373838,45.376309,45.378531,45.381733,45.383545,45.383619,45.386754,45.387131,45.3894,45.39177,45.393648,45.393784,45.394798,45.395593,45.395664,45.397131,45.397261,45.401105,45.402844,45.403433,45.402457,45.402672,45.407275,45.4101,45.412164,45.415202,45.415174,45.418572,45.424228,45.427171,45.427854,45.431927,45.432929,45.435494,45.440485,45.442561,45.443096,45.444307,45.448983,45.450143,45.451832,45.454649,45.455518,45.457968,45.459678,45.461675,45.46333,45.465469,45.467466,45.470184,45.472492,45.474619,45.476109,45.476188,45.47907,45.481329,45.483377,45.486502,45.486638,45.489006,45.489377,45.492844,45.495096,45.496923,45.499168,45.501814,45.504495,45.506786,45.508715,45.514103,45.514598,45.515751,45.514295,45.513125,45.512408,45.512252,45.512631,45.513388,45.514896,45.51853,45.520828,45.524655,45.526749,45.529082,45.530303,45.532567,45.535329,45.537275,45.543205,45.546673,45.547614]}]],[[{"lng":[-119.434772,-119.434665,-119.432054,-119.432181,-119.432128,-119.432149953782,-119.364396,-119.356927874882,-119.322509,-119.312779611952,-119.265781460289,-119.25715,-119.225745,-119.204349373269,-119.19553,-119.169496,-119.141390171444,-119.12612,-119.093221,-119.061462,-119.027056,-119.008558,-118.987196090377,-118.987129,-118.977787096598,-118.941242,-118.86812798659,-118.788694725992,-118.785765634062,-118.725242193351,-118.67787,-118.658717,-118.639332,-118.637725,-118.606789334728,-118.590497392025,-118.579906,-118.57571,-118.569392,-118.554902302619,-118.537119,-118.497027,-118.470756,-118.424027212824,-118.415326658626,-118.403817114887,-118.387301768013,-118.387293095034,-118.37836,-118.36779,-118.36716827519,-118.340494051998,-118.314982,-118.283526,-118.256368,-118.25253,-118.23666752911,-118.236584,-118.228941,-118.146028,-118.131019,-118.126197,-117.99694971271,-117.996911,-117.977663335055,-117.977639,-117.97298,-117.972948,-118.045003,-118.045102,-118.054666,-118.066506,-118.066465,-118.066513,-118.066383,-118.117194,-118.117121,-118.116844,-118.11836,-118.116309,-118.116355,-118.116362,-118.116461,-118.117464,-118.197955,-118.197876,-118.241668,-118.241665,-118.267614,-118.366326,-118.366522,-118.384117,-118.38422,-118.392817,-118.404849,-118.404806,-118.428539,-118.428539,-118.428329,-118.469471,-118.506172,-118.506296,-118.536194,-118.572271,-118.577354,-118.613107,-118.613254,-118.613243,-118.633925,-118.656266,-118.656251,-118.697766,-118.697013,-118.696986,-118.656102,-118.655992,-118.546632,-118.547652,-118.518687,-118.519022,-118.518689,-118.675353,-118.946612,-119.002263,-119.162966,-119.163037,-119.146424,-119.146789,-119.147264,-119.148243,-119.14561,-119.145144,-119.248214,-119.248444,-119.248547,-119.43464,-119.434606,-119.434644,-119.43455,-119.434622,-119.434603,-119.434788,-119.434695,-119.435024,-119.434772],"lat":[45.828536,45.864893,45.865421,45.879312,45.90729,45.918250445405,45.921605,45.9236692670188,45.933183,45.9341867678607,45.9390355038675,45.939926,45.932725,45.9292871126004,45.92787,45.927603,45.9310086675325,45.932859,45.942745,45.958527,45.969134,45.97927,45.9997905520367,45.999855,46.0000013775916,46.000574,46.0006742162676,46.0007830942314,46.0007871090932,46.0008700676541,46.000935,46.000955,46.000994,46.00097,46.0008886734271,46.0008458436429,46.000818,46.000718,46.000773,46.0008030811739,46.00084,46.00062,46.000632,46.0006026668075,46.0005972051842,46.0005899802661,46.0005796130411,46.0005796075968,46.000574,46.000622,46.0006200103111,46.0005346455232,46.000453,46.000787,46.000439,46.000459,46.0004182147682,46.000418,46.000421,46.000701,46.00028,46.000282,46.0007868487855,46.000787,46.0007234754428,45.860602,45.860595,45.816896,45.817073,45.773538,45.773563,45.77346,45.769522,45.737574,45.688395,45.688607,45.673797,45.600729,45.514664,45.514652,45.498842,45.49282,45.470732,45.470702,45.4704,45.427204,45.427391,45.428841,45.429103,45.428951,45.43531,45.435246,45.44258,45.442554,45.44255,45.429013,45.429076,45.428951,45.35519,45.355164,45.354867,45.354632,45.354518,45.354767,45.354773,45.354951,45.345788,45.339884,45.340006,45.340337,45.345146,45.345647,45.259928,45.257715,45.257729,45.196928,45.196898,45.080753,45.08069,45.010173,44.995877,44.997662,44.997439,44.996558,44.996241,45.082943,45.08294,45.171034,45.255936,45.255939,45.428579,45.515909,45.516076,45.573187,45.601935,45.602985,45.621409,45.704411,45.704977,45.746143,45.756429,45.802167,45.805961,45.826207,45.828536]}]],[[{"lng":[-124.1152,-124.110793224148,-124.10907,-124.109042455264,-124.108102657969,-124.108088,-124.109556,-124.109059,-124.106518,-124.104537939304,-124.100587,-124.098696003703,-124.092633,-124.09257772478,-124.092463110466,-124.086872,-124.084686,-124.084403674725,-124.0837,-124.083714,-124.083554722423,-124.083475419185,-124.08331,-124.084429,-124.083601,-124.077996,-124.077599366608,-124.076387,-124.075399,-124.071469543556,-124.070986189155,-124.070659499243,-124.069662181446,-124.067223499261,-124.06635,-124.066510728242,-124.066565382567,-124.067251,-124.06914,-124.068732391746,-124.068382456744,-124.068251,-124.066393894948,-124.06635,-124.067045,-124.065008,-124.063293560589,-124.062121498473,-124.058312330843,-124.058281,-124.060043,-124.063498,-124.066467,-124.07409,-124.078026,-124.079249,-124.072012,-124.068445,-124.065315427968,-124.063406,-124.059857,-124.057901,-124.058181453278,-124.058539,-124.06017,-124.064816,-124.064279,-124.06429,-124.068112,-124.066325,-124.069158,-124.075473,-124.074586244664,-124.073235024702,-124.073012,-124.073077,-124.074049344185,-124.074066,-124.067760724008,-124.067437,-124.063735,-124.063592299854,-124.063589011661,-124.063498,-124.063770144253,-124.067883,-124.067772,-124.067730713109,-124.067712670147,-124.06756,-124.067345158107,-124.066622,-124.061048,-124.059095250869,-124.054151,-124.053756784081,-124.048814,-124.045903377286,-124.037694989725,-124.032296,-124.025447618374,-124.025427720548,-124.025136,-124.025416882061,-124.025678,-124.024993086351,-124.024981927707,-124.024189142756,-124.023943285941,-124.023834,-124.02050369952,-124.017168554748,-124.017091597529,-124.016595443995,-124.016305243106,-124.015243,-124.014452951513,-124.013141309957,-124.012547595484,-124.012053555073,-124.011979123524,-124.0105900194,-124.009462791521,-124.009179,-124.010183,-124.012184,-124.011662,-124.00627,-124.005504,-124.008880714497,-123.986688,-123.967191,-123.967184,-123.955007,-123.911026,-123.895988,-123.801472,-123.784759,-123.724663,-123.725337,-123.725396,-123.725771,-123.724599,-123.724659,-123.724782,-123.724231,-123.724858,-123.724842,-123.725394,-123.725188,-123.725079,-123.725001,-123.716062,-123.704578,-123.704467,-123.602609,-123.603143,-123.602794,-123.602817,-123.596929,-123.596919,-123.596674,-123.596134,-123.597233,-123.59763,-123.597677,-123.608115,-123.648669,-123.66875,-123.679097,-123.68952,-123.699976,-123.720071,-123.720065,-123.72014,-123.715866,-123.715675,-123.715538,-123.735153,-123.734996,-123.816709,-123.816525,-123.775789,-123.775598,-123.798955,-123.941075,-123.941072,-124.063259,-124.063303,-124.083717,-124.114043752426,-124.113261,-124.113139093471,-124.111747,-124.1152],"lat":[44.286486,44.2988659489304,44.303707,44.3038814406453,44.3098331711722,44.309926,44.314545,44.318391,44.321848,44.3252125340905,44.331926,44.3411180393286,44.37059,44.3709219295689,44.371610192405,44.405185,44.420221,44.423136738616,44.430404,44.440011,44.4549692934339,44.4624169275216,44.477952,44.486927,44.501123,44.521985,44.5242600339205,44.531214,44.531606,44.5596389307304,44.5630872042146,44.5654178257118,44.5725327387105,44.589930414375,44.596162,44.59828090129,44.599001416354,44.60804,44.612979,44.615277011887,44.6172498737895,44.617991,44.6221223504817,44.62222,44.627851,44.632504,44.6392226043931,44.6438157219045,44.658743219609,44.658866,44.669361,44.672442,44.673061,44.673183,44.67565,44.6772,44.677917,44.683094,44.6955669500131,44.703177,44.716027,44.735163,44.7377481813923,44.741044,44.745076,44.746081,44.748465,44.753678,44.760618,44.762671,44.767806,44.771403,44.778483350406,44.7892722460794,44.791053,44.794318,44.7980431891997,44.798107,44.8043190617745,44.804638,44.80531,44.8094729907543,44.8095689172014,44.812224,44.8123385053927,44.814069,44.817815,44.8191507867329,44.8197345446305,44.824674,44.8260228314602,44.830563,44.834438,44.8355124791867,44.838233,44.839102683012,44.850007,44.8589587771585,44.8842041158734,44.900809,44.9269839736841,44.9270600245102,44.928175,44.9325110520331,44.936542,44.9414756811252,44.9415560608816,44.9472667780803,44.9490377737797,44.949825,44.9626480717717,44.9754897961224,44.9757861141132,44.977696516016,44.9788139127335,44.982904,44.9873098492237,44.9946244571541,44.9979354140053,45.0006905203016,45.0011056013856,45.0088521934298,45.0151383849173,45.016721,45.023823,45.026111,45.033485,45.038214,45.042931,45.0449987048377,45.044634,45.044843,45.045727,45.04572,45.045679,45.045552,45.044913,45.04473,45.044432,45.025068,45.023601,45.000746,45.00076,44.984273,44.962958,44.955493,44.94753,44.911745,44.88599,44.764328,44.753939,44.739046,44.739018,44.73898,44.721154,44.721154,44.709242,44.702125,44.651159,44.651139,44.545624,44.541804,44.477454,44.477454,44.46932,44.433109,44.433671,44.43342,44.432935,44.433928,44.433582,44.433788,44.433374,44.432329,44.389506,44.389495,44.379969,44.360458,44.36035,44.345778,44.344622,44.315303,44.316167,44.283547,44.283304,44.282951,44.277375,44.277178,44.275094,44.276117,44.2769899702691,44.277953,44.2783783845383,44.283236,44.286486]}]],[[{"lng":[-123.366516,-123.365968,-123.365373,-123.365677,-123.365152,-123.364652,-123.364329,-123.364023,-123.36375,-123.363743140809,-123.360561,-123.346252,-123.340655,-123.332335,-123.302588994244,-123.301034,-123.280166,-123.251233,-123.242026,-123.230813,-123.22243,-123.213054,-123.166414,-123.119730298412,-123.115904,-123.105021,-123.072955001104,-123.051064,-123.041297,-123.03382,-123.022885224802,-123.022147,-123.009436,-123.004233,-122.966694913215,-122.962681,-122.939676274918,-122.937415175285,-122.930461538264,-122.904119,-122.902954826569,-122.885933339972,-122.884478,-122.88307501286,-122.881327583221,-122.878092,-122.87766154657,-122.864284541462,-122.856158,-122.850300357308,-122.845875047125,-122.838578021636,-122.837638,-122.833420843631,-122.813998,-122.812215297032,-122.811841461838,-122.806193,-122.811204257205,-122.81151,-122.81006272961,-122.808350897773,-122.799082951662,-122.798091,-122.796820712691,-122.794675088814,-122.785026,-122.785121333263,-122.785299579417,-122.785515,-122.785696,-122.795963,-122.79572928967,-122.795605,-122.778983853061,-122.77064606136,-122.769532,-122.761451,-122.760974137953,-122.760108,-122.762189526428,-122.762437,-122.784663,-122.784735,-122.863423,-122.87539,-122.885463,-122.929146,-122.928901,-122.990368,-122.990344,-123.011137,-123.031837,-123.0317,-123.030873,-123.050674,-123.051181,-123.115179,-123.122083,-123.195899,-123.215543,-123.34041,-123.361622,-123.361003,-123.360794,-123.358826,-123.360627,-123.360365,-123.360427,-123.360564,-123.360303,-123.359489,-123.359614,-123.367438,-123.366516],"lat":[46.058442,46.069546,46.08312,46.099071,46.111274,46.120724,46.125069,46.127255,46.135489,46.1463246103232,46.146305,46.145065,46.146183,46.146132,46.1447065181102,46.144632,46.144843,46.156452,46.160968,46.164287,46.167682,46.172541,46.188973,46.1855486659199,46.185268,46.177676,46.1633673272527,46.153599,46.146351,46.144336,46.1394405031111,46.13911,46.136043,46.133823,46.1076189726297,46.104817,46.0965350318481,46.0957210097251,46.0932176196546,46.083734,46.0823438200884,46.0620178719878,46.06028,46.0539089971682,46.0459738715663,46.031281,46.0309510655119,46.0206978417551,46.014469,46.0038262451976,45.9957858962594,45.9825279259201,45.98082,45.9772814418892,45.960984,45.9544589188486,45.9530906006144,45.932416,45.9138572891451,45.912725,45.9096628567015,45.9060409527215,45.8864317772246,45.884333,45.8827157050054,45.8799839554795,45.867699,45.8643529779321,45.8580968659956,45.850536,45.844216,45.825024,45.815216,45.81,45.7912471031523,45.7818399456152,45.780583,45.759163,45.7503749615244,45.734413,45.7285767375573,45.728665,45.72865,45.720946,45.721416,45.721418,45.721378,45.721482,45.735688,45.736459,45.750835,45.751458,45.75142,45.765779,45.779159,45.779362,45.779371,45.780131,45.780154,45.779909,45.77994,45.779849,45.779579,45.786853,45.808172,45.836657,45.866592,45.874827,45.879307,45.953402,45.953538,46.011211,46.039372,46.039528,46.058442]}]],[[{"lng":[-120.49516,-120.309328,-120.131926,-120.128661,-120.086479,-120.028785,-120.005372,-120.000045,-119.91054,-119.910536,-119.876525,-119.850941,-119.790699,-119.790961,-119.791162,-119.781719,-119.770244,-119.672228,-119.671532,-119.652431,-119.653184,-119.653347,-119.653476,-119.653538,-119.653885,-119.653673,-119.653832,-119.653696,-119.655108,-119.655248,-119.655517,-119.899002,-119.899283,-119.960375,-119.970532,-120.000617,-120.010547,-120.020708,-120.021621,-120.101166,-120.143544,-120.36646,-120.386074,-120.385775,-120.387186,-120.386561,-120.385768,-120.386378,-120.385687,-120.387642,-120.388118,-120.387452,-120.387782,-120.389667,-120.393046,-120.398603,-120.399248,-120.397984,-120.394825,-120.394254,-120.394668,-120.39737,-120.400743,-120.404685,-120.404676,-120.401654,-120.399226,-120.398292,-120.395872,-120.394109,-120.393173,-120.390987,-120.385062,-120.385877,-120.381376,-120.379794,-120.379005,-120.380814,-120.384813,-120.385489,-120.386498,-120.386035,-120.38353,-120.377797,-120.377062,-120.380711,-120.379053,-120.372635,-120.371441,-120.372173,-120.376617,-120.378686,-120.380249,-120.387086,-120.390315,-120.394199,-120.397282,-120.400495,-120.401587,-120.405023,-120.405045,-120.405558,-120.40829,-120.410061,-120.410794,-120.411979,-120.41258,-120.413864,-120.41846,-120.424464,-120.427549,-120.433469,-120.435567,-120.43628,-120.439561,-120.443361,-120.445746,-120.452471,-120.455204,-120.454163,-120.454706,-120.456202,-120.459592,-120.460353,-120.460126,-120.458764,-120.455737,-120.451259,-120.446918,-120.440553,-120.438784,-120.436139,-120.436328,-120.43946,-120.444521,-120.450991,-120.453485,-120.454775,-120.455771,-120.458259,-120.460798,-120.462494,-120.467323,-120.469777,-120.473566,-120.474136,-120.468899,-120.468709,-120.471074,-120.471271,-120.470127,-120.470495,-120.472776,-120.476621,-120.47708,-120.474898,-120.472884,-120.476528,-120.478641,-120.480293,-120.481685,-120.479385,-120.482655,-120.488231,-120.489133,-120.487029,-120.486572,-120.485083,-120.484919,-120.485821,-120.485982,-120.482025,-120.479707,-120.477292,-120.476778,-120.476773,-120.477712,-120.47929,-120.48367,-120.483766,-120.480902,-120.47751,-120.477168,-120.479487,-120.478688,-120.480046,-120.481248,-120.482877,-120.483767,-120.487246,-120.487646,-120.486545,-120.482573,-120.480864,-120.481745,-120.479645,-120.479545,-120.480945,-120.488946,-120.488946,-120.485646,-120.483446,-120.481346,-120.481046,-120.488046,-120.489747,-120.489047,-120.484947,-120.483647,-120.482647,-120.483347,-120.488547,-120.489347,-120.489647,-120.490647,-120.494048,-120.495548,-120.49516],"lat":[45.068279,45.06779,45.067354,45.065453,45.065398,45.065224,45.065582,45.065591,45.066927,45.067928,45.067866,45.067783,45.067823,45.023517,44.994755,44.994816,44.995193,44.995117,44.823343,44.823299,44.762701,44.652252,44.652251,44.621785,44.534131,44.461288,44.454961,44.38917,44.389206,44.34547,44.307045,44.30662,44.389575,44.389457,44.388968,44.389104,44.389727,44.389687,44.438793,44.43821,44.437751,44.437015,44.436083,44.476624,44.476624,44.564009,44.578606,44.653068,44.761175,44.761979,44.763229,44.767886,44.769866,44.771638,44.773307,44.776973,44.778767,44.78073,44.782665,44.784272,44.786038,44.788414,44.789951,44.792695,44.794719,44.797861,44.799835,44.802357,44.803969,44.802712,44.797013,44.795784,44.796406,44.798474,44.800721,44.80298,44.806314,44.807352,44.807041,44.809674,44.809966,44.810985,44.8119,44.812034,44.814826,44.817938,44.819357,44.82037,44.821769,44.822846,44.825007,44.826877,44.826872,44.829257,44.829733,44.829201,44.829377,44.830109,44.830843,44.833779,44.838678,44.839274,44.839552,44.840381,44.845693,44.848417,44.852174,44.852907,44.853762,44.853468,44.853686,44.85675,44.860148,44.862316,44.863607,44.863812,44.863058,44.8644,44.865607,44.869667,44.872612,44.873867,44.874285,44.876113,44.878216,44.881199,44.88281,44.884215,44.884591,44.886701,44.888013,44.894064,44.894791,44.899629,44.904258,44.908663,44.908317,44.907264,44.905132,44.903736,44.903973,44.905528,44.907439,44.907436,44.908162,44.909661,44.913388,44.913847,44.916909,44.919343,44.922126,44.924502,44.927367,44.929493,44.932197,44.933343,44.935458,44.940262,44.942458,44.943142,44.945507,44.947337,44.949244,44.950682,44.951299,44.954047,44.955769,44.956472,44.959686,44.960692,44.962749,44.965194,44.965188,44.966344,44.967456,44.970088,44.972278,44.972941,44.972849,44.975432,44.978676,44.980374,44.981876,44.984596,44.988537,44.989763,44.992758,44.998224,45.000113,45.00165,45.002949,45.00615,45.007686,45.009024,45.01105,45.01525,45.01895,45.02115,45.02705,45.02915,45.03255,45.03415,45.03705,45.03895,45.04315,45.04715,45.04855,45.05195,45.05345,45.05635,45.05695,45.05785,45.05855,45.06095,45.06315,45.06295,45.06355,45.068279]}]],[[{"lng":[-123.231001,-123.230969,-123.230951,-123.231093,-123.229167,-123.229851,-123.2299,-123.229901,-123.229761,-123.229402,-123.229284,-123.229271,-123.229545,-123.229676,-123.229526,-123.229581,-123.229619,-123.229635,-123.210392,-123.209912,-123.200424,-123.200419,-123.190504,-123.190456,-123.180551,-123.180512,-123.152023,-123.152233,-123.112652,-123.112688,-123.009765,-123.009744,-122.990728,-122.990035,-122.970492,-122.970829,-122.95119,-122.951199,-122.9451,-122.93175,-122.9178,-122.911925,-122.868692,-122.852943,-122.853707,-122.833971,-122.814413,-122.794776,-122.794811,-122.785493,-122.784914,-122.775044,-122.775223,-122.756079,-122.756033,-122.736367,-122.736329,-122.716699,-122.716657,-122.69701,-122.697017,-122.677198,-122.677181,-122.637695,-122.637812,-122.621665,-122.600251,-122.600202,-122.580094,-122.580049,-122.560299,-122.560273,-122.520741,-122.520525,-122.460224,-122.46021,-122.440505,-122.440535,-122.420863,-122.420844,-122.401077,-122.401041,-122.401025,-122.40031,-122.385922,-122.28273,-122.282708,-122.283792,-122.283778,-122.283449,-122.284689,-122.287818,-122.287686,-122.28769,-122.287177,-122.287458,-122.28747,-122.289972,-122.289748006076,-122.320293,-122.368051522242,-122.378511,-122.403459336051,-122.416638,-122.493322,-122.548911,-122.61541287471,-122.634696,-122.672521,-122.713058,-122.75363522358,-122.813845,-122.867298,-122.870830789468,-122.875515469317,-122.884017334375,-122.889935,-122.893590970866,-122.961670756599,-122.963801,-122.988318483577,-123.043997,-123.062882,-123.080938,-123.102698940572,-123.125165,-123.145735,-123.183923,-123.23111258448,-123.231001],"lat":[42.004931,42.082066,42.098876,42.128069,42.128331,42.280466,42.287434,42.290816,42.312847,42.355665,42.420299,42.429362,42.495623,42.551766,42.626212,42.668065,42.70261,42.709956,42.709983,42.717161,42.717236,42.724474,42.724495,42.731703,42.731655,42.737765,42.737721,42.755835,42.75575,42.752218,42.752144,42.75941,42.759538,42.76095,42.760945,42.768116,42.767555,42.774773,42.774805,42.774874,42.774753,42.774704,42.774541,42.774603,42.781766,42.780653,42.780511,42.778221,42.792721,42.792712,42.806845,42.806831,42.8288,42.828689,42.823195,42.823496,42.837661,42.837671,42.85211,42.852099,42.866572,42.866603,42.88108,42.881141,42.89699,42.896812,42.895693,42.911073,42.9108,42.924651,42.92469,42.939185,42.939077,42.93976,42.939873,42.954373,42.95442,42.968923,42.968927,42.983439,42.983458,42.993456,42.996632,42.996632,42.996644,42.996499,42.910928,42.910926,42.901702,42.707455,42.4745,42.4745,42.395348,42.392086,42.288838,42.202994,42.127168,42.127156,42.0081011637255,42.008609,42.0093276173603,42.009485,42.0087619451744,42.00838,42.008121,42.007518,42.0055939147516,42.005036,42.004687,42.004211,42.0041828177379,42.004141,42.003945,42.0039200299812,42.0038869183156,42.0038268265009,42.003785,42.0037712404909,42.0035150173241,42.003507,42.003377680638,42.003084,42.00482,42.005064,42.0065873199631,42.00816,42.008761,42.005789,42.0039324384249,42.004931]}]],[[{"lng":[-123.725396,-123.725337,-123.724663,-123.724368,-123.657202,-123.627081,-123.622159,-123.601657,-123.599208,-123.576563,-123.57142,-123.568496,-123.561352,-123.551215,-123.550602,-123.50222,-123.495414,-123.49442,-123.478264,-123.477905,-123.468746,-123.448934,-123.412698,-123.396679,-123.339945,-123.321413,-123.249322,-123.209454,-123.186276,-123.092128,-123.068667,-123.068271,-123.068079,-123.066732,-123.06603,-123.065974,-123.067043,-123.067835,-123.068849,-123.068975,-123.070654,-123.072732,-123.073539,-123.074284,-123.075113,-123.075174,-123.075577,-123.074723,-123.071977,-123.069219,-123.068685,-123.066938,-123.065415,-123.064261,-123.058089,-123.055299,-123.05465,-123.053762,-123.051824,-123.047081,-123.042938,-123.041717,-123.040853,-123.040529,-123.040164,-123.037897,-123.037374,-123.037594,-123.037779,-123.037807,-123.037316,-123.036985,-123.037566,-123.038923,-123.037897,-123.038095,-123.039822,-123.04148,-123.042127,-123.042906,-123.043631,-123.044433,-123.0496,-123.054933,-123.060074,-123.062005,-123.067478,-123.06993,-123.071687,-123.072813,-123.076574,-123.081694,-123.082998,-123.091347,-123.093008,-123.105091,-123.109725,-123.111472,-123.112769,-123.1123,-123.110396,-123.108165,-123.107108,-123.108792,-123.11321,-123.116542,-123.120462,-123.123769,-123.125287,-123.128245,-123.13017,-123.132383,-123.13309,-123.134498,-123.13733,-123.141485,-123.144973,-123.146617,-123.147995,-123.147924,-123.149402,-123.152597,-123.155436,-123.1616,-123.16781,-123.170891,-123.174215,-123.178468,-123.180532,-123.180908,-123.180944,-123.180122,-123.179857,-123.179881,-123.180117,-123.18001,-123.179829,-123.179758,-123.179677,-123.179555,-123.179387,-123.17778,-123.173863,-123.169856,-123.166472,-123.158928,-123.154541,-123.152849,-123.151364,-123.149254,-123.143754,-123.140136,-123.131734,-123.126252,-123.118528,-123.1114,-123.109462,-123.103566,-123.101167,-123.093335,-123.091479,-123.091349,-123.09199,-123.095698,-123.097713,-123.102131,-123.110229,-123.117983,-123.122064,-123.124779,-123.125807,-123.126787,-123.128571,-123.129627,-123.131328,-123.132924,-123.133628,-123.137656,-123.140101,-123.144012,-123.145812,-123.14752,-123.148333,-123.148411,-123.147833,-123.145463,-123.143843,-123.140884,-123.137757,-123.135106,-123.1327,-123.132445,-123.133529,-123.137819,-123.146582,-123.150429,-123.150763,-123.150297,-123.149025,-123.182025,-123.201917,-123.221593,-123.23521,-123.240276,-123.301882,-123.316612,-123.339138,-123.409764,-123.414116,-123.438419,-123.47056,-123.54132,-123.580966,-123.602609,-123.704467,-123.704578,-123.716062,-123.725001,-123.725079,-123.725188,-123.725394,-123.724842,-123.724858,-123.724231,-123.724782,-123.724659,-123.724599,-123.725771,-123.725396],"lat":[45.023601,45.025068,45.044432,45.076226,45.076118,45.076067,45.076056,45.07602,45.076016,45.075976,45.075899,45.075848,45.075733,45.075568,45.075553,45.075115,45.07513,45.075138,45.075175,45.075176,45.0752,45.075293,45.075365,45.075389,45.075495,45.075527,45.075073,45.074982,45.075013,45.074932,45.07486,45.074864,45.074288,45.071438,45.069102,45.068042,45.060738,45.054188,45.046709,45.041493,45.036599,45.033397,45.031314,45.02584,45.021657,45.017489,45.014513,45.012533,45.008897,45.000505,44.998378,44.995005,44.990718,44.989778,44.989368,44.989826,44.989868,44.989928,44.990302,44.991041,44.990026,44.989381,44.98877,44.988502,44.988153,44.984421,44.981139,44.979621,44.977463,44.975841,44.972795,44.967428,44.965581,44.961154,44.958779,44.95657,44.95165,44.948114,44.947098,44.945975,44.94495,44.944231,44.942701,44.940694,44.937885,44.936207,44.932214,44.92905,44.928107,44.927686,44.926914,44.926878,44.927167,44.930297,44.930541,44.93044,44.930863,44.930161,44.928728,44.926012,44.923826,44.92249,44.920337,44.917505,44.914782,44.913242,44.912185,44.910536,44.909273,44.904764,44.90073,44.894683,44.891904,44.889368,44.887259,44.88374,44.877305,44.870722,44.866795,44.863181,44.861254,44.860059,44.860009,44.861579,44.864022,44.864462,44.863534,44.861006,44.858765,44.857553,44.855601,44.851647,44.845611,44.844667,44.841506,44.839568,44.837984,44.837131,44.836601,44.83612,44.835729,44.833332,44.83042,44.829041,44.828733,44.830236,44.830219,44.829536,44.827607,44.826506,44.825398,44.825503,44.826479,44.826079,44.822803,44.821691,44.82098,44.818847,44.817768,44.814044,44.811523,44.80953,44.806642,44.800848,44.799099,44.797542,44.796516,44.794537,44.793774,44.792666,44.791961,44.79117,44.789249,44.787897,44.785587,44.779867,44.778736,44.775272,44.773729,44.771832,44.770231,44.765404,44.760578,44.755137,44.751446,44.749516,44.748914,44.747632,44.747062,44.745741,44.743363,44.741157,44.738662,44.736145,44.731585,44.727611,44.72578,44.722689,44.720225,44.720085,44.720099,44.720125,44.720146,44.719914,44.719835,44.719994,44.720059,44.720531,44.720552,44.720622,44.720722,44.72127,44.719415,44.721154,44.721154,44.73898,44.739018,44.739046,44.753939,44.764328,44.88599,44.911745,44.94753,44.955493,44.962958,44.984273,45.00076,45.000746,45.023601]}]],[[{"lng":[-124.462619,-124.455669,-124.448625230642,-124.446875,-124.436198,-124.434655,-124.436655,-124.434312105988,-124.434213,-124.433542433297,-124.432236,-124.435157,-124.433357,-124.433641,-124.434527236125,-124.43785,-124.437373631068,-124.434451,-124.434419666916,-124.429253343926,-124.427595577081,-124.425024028606,-124.424113,-124.401726,-124.395302,-124.395338287504,-124.397382,-124.395607,-124.38246,-124.384117648066,-124.38708,-124.388891,-124.393988,-124.395536,-124.400404,-124.402814,-124.394143,-124.38972,-124.387642,-124.385296,-124.384603,-124.376997,-124.373037,-124.353332,-124.343247,-124.330671,-124.315012,-124.286896,-124.279473391428,-124.2782229273,-124.255609,-124.232025,-124.231975100174,-124.218966377223,-124.183435,-124.180894,-124.146347,-124.100765,-124.062969,-123.979004,-123.949565,-123.949573,-123.875698,-123.875628,-123.816657,-123.817154,-123.817614,-123.769016,-123.764884,-123.761528,-123.762801,-123.761983,-123.762289,-123.764496,-123.763917,-123.764339,-123.764356,-123.704752,-123.704456,-123.703862,-123.703568,-123.703417,-123.703655,-123.702167,-123.702131,-123.702139,-123.702144,-123.707059,-123.707057,-123.761333,-123.761384,-123.761594,-123.821118,-123.821121,-123.821513,-123.820515,-123.819496,-123.81915,-123.819144,-123.820439,-123.811789,-123.811553,-123.849858,-123.84989,-123.868282,-123.868491,-123.925717,-123.925942,-123.937268,-123.937288,-123.957026,-123.956985,-123.976631,-123.976677,-123.996296,-123.996291,-124.070314,-124.089872,-124.089872,-124.1192,-124.119228,-124.128073,-124.128049,-124.132918,-124.132926,-124.138748,-124.138686,-124.138655,-124.159966,-124.159895,-124.160163,-124.164887,-124.164225,-124.164889,-124.160149,-124.160658,-124.141185,-124.141475,-124.146344,-124.146377,-124.151235,-124.151209,-124.156491,-124.156629,-124.162074,-124.161288,-124.160976,-124.161308,-124.180704,-124.180706,-124.18531,-124.185291,-124.189907,-124.189984,-124.199692,-124.199717,-124.204529,-124.204851,-124.214201,-124.214393,-124.209522,-124.209708,-124.219416,-124.219623,-124.239394,-124.239129,-124.24387,-124.243779,-124.253317,-124.253467,-124.258274,-124.258388,-124.269254,-124.296347,-124.41539,-124.415423,-124.434245,-124.438676,-124.479636362958,-124.462619],"lat":[42.99143,43.008349,43.0271390597407,43.031808,43.071312,43.081469,43.085816,43.0895749921129,43.089734,43.0923284181646,43.097383,43.104678,43.108563,43.111397,43.111948449848,43.114016,43.114292094968,43.115986,43.1160189545965,43.1214526390494,43.123196196692,43.1259008249145,43.126859,43.184896,43.211101,43.2112497264283,43.219626,43.223908,43.270167,43.2727944798235,43.27749,43.290523,43.29926,43.30224,43.302121,43.305872,43.315651,43.323216,43.325968,43.32773,43.332848,43.334231,43.338953,43.342667,43.351517,43.366559,43.388389,43.436296,43.4519245921396,43.454557493182,43.502172,43.562393,43.5625784778939,43.6109319633736,43.610925,43.611445,43.611216,43.611244,43.609641,43.609363,43.609265,43.608472,43.608407,43.515947,43.516449,43.459594,43.431306,43.431695,43.431548,43.422294,43.387997,43.358748,43.351419,43.344799,43.287099,43.2636,43.258054,43.257741,43.243253,43.214139,43.186134,43.177696,43.170579,43.17059,43.113946,43.112458,43.087083,43.087067,43.083457,43.08316,43.054511,42.996318,42.996291,42.965284,42.924483,42.909675,42.909661,42.885135,42.884356,42.824112,42.824101,42.788837,42.788994,42.781821,42.781921,42.77484,42.774514,42.73971,42.739666,42.729097,42.729051,42.714569,42.714558,42.700118,42.7001,42.685651,42.685327,42.685454,42.678208,42.678339,42.671129,42.671123,42.666684,42.666697,42.671119,42.671115,42.729928,42.739956,42.739947,42.768326,42.790087,42.790006,42.804038,42.817825,42.817761,42.828288,42.828475,42.850586,42.850511,42.862081,42.862067,42.86581,42.8658,42.869642,42.86973,42.874824,42.876642,42.883499,42.88245,42.885998,42.885919,42.893047,42.893032,42.896696,42.896656,42.900275,42.900327,42.90391,42.904006,42.911141,42.911125,42.918227,42.918156,42.933782,42.933751,42.940948,42.940652,42.9443,42.943809,42.951314,42.951152,42.954946,42.954877,42.954621,42.955232,42.953769,42.95369,42.953817,42.9543325389089,42.99143]}]]],null,"cnty - estimate",{"crs":{"crsClass":"L.CRS.EPSG3857","code":null,"proj4def":null,"projectedBounds":null,"options":{}},"pane":"polygon","stroke":true,"color":"#333333","weight":0.5,"opacity":[0.9,0.9,0.9,0.9,0.9,0.9,0.9,0.9,0.9,0.9,0.9,0.9,0.9,0.9,0.9,0.9,0.9,0.9,0.9,0.9,0.9,0.9,0.9,0.9,0.9,0.9,0.9,0.9,0.9,0.9,0.9,0.9,0.9,0.9,0.9,0.9],"fill":true,"fillColor":["#3C3777","#46236A","#491763","#491763","#46236A","#009197","#491763","#009F94","#008298","#46236A","#422D71","#46236A","#46236A","#33407D","#DDE12C","#491763","#3C3777","#491763","#33407D","#46236A","#46236A","#005A8C","#00C278","#33407D","#491763","#491763","#491763","#46236A","#46236A","#422D71","#422D71","#422D71","#491763","#006290","#3C3777","#422D71"],"fillOpacity":[0.6,0.6,0.6,0.6,0.6,0.6,0.6,0.6,0.6,0.6,0.6,0.6,0.6,0.6,0.6,0.6,0.6,0.6,0.6,0.6,0.6,0.6,0.6,0.6,0.6,0.6,0.6,0.6,0.6,0.6,0.6,0.6,0.6,0.6,0.6,0.6],"smoothFactor":1,"noClip":false},["<div class='scrollableContainer'><table class=mapview-popup id='popup'><tr class='coord'><td><\/td><th><b>Feature ID <\/b><\/th><td>1 <\/td><\/tr><tr><td>1<\/td><th>GEOID <\/th><td>41033 <\/td><\/tr><tr><td>2<\/td><th>NAME <\/th><td>Josephine County, Oregon <\/td><\/tr><tr><td>3<\/td><th>variable <\/th><td>ed_attain <\/td><\/tr><tr><td>4<\/td><th>estimate <\/th><td> 65703 <\/td><\/tr><tr><td>5<\/td><th>moe <\/th><td>186 <\/td><\/tr><tr><td>6<\/td><th>geometry <\/th><td>sfc_MULTIPOLYGON <\/td><\/tr><\/table><\/div>","<div class='scrollableContainer'><table class=mapview-popup id='popup'><tr class='coord'><td><\/td><th><b>Feature ID <\/b><\/th><td>2 <\/td><\/tr><tr><td>1<\/td><th>GEOID <\/th><td>41045 <\/td><\/tr><tr><td>2<\/td><th>NAME <\/th><td>Malheur County, Oregon <\/td><\/tr><tr><td>3<\/td><th>variable <\/th><td>ed_attain <\/td><\/tr><tr><td>4<\/td><th>estimate <\/th><td> 20497 <\/td><\/tr><tr><td>5<\/td><th>moe <\/th><td>127 <\/td><\/tr><tr><td>6<\/td><th>geometry <\/th><td>sfc_MULTIPOLYGON <\/td><\/tr><\/table><\/div>","<div class='scrollableContainer'><table class=mapview-popup id='popup'><tr class='coord'><td><\/td><th><b>Feature ID <\/b><\/th><td>3 <\/td><\/tr><tr><td>1<\/td><th>GEOID <\/th><td>41001 <\/td><\/tr><tr><td>2<\/td><th>NAME <\/th><td>Baker County, Oregon <\/td><\/tr><tr><td>3<\/td><th>variable <\/th><td>ed_attain <\/td><\/tr><tr><td>4<\/td><th>estimate <\/th><td> 12415 <\/td><\/tr><tr><td>5<\/td><th>moe <\/th><td>104 <\/td><\/tr><tr><td>6<\/td><th>geometry <\/th><td>sfc_MULTIPOLYGON <\/td><\/tr><\/table><\/div>","<div class='scrollableContainer'><table class=mapview-popup id='popup'><tr class='coord'><td><\/td><th><b>Feature ID <\/b><\/th><td>4 <\/td><\/tr><tr><td>1<\/td><th>GEOID <\/th><td>41021 <\/td><\/tr><tr><td>2<\/td><th>NAME <\/th><td>Gilliam County, Oregon <\/td><\/tr><tr><td>3<\/td><th>variable <\/th><td>ed_attain <\/td><\/tr><tr><td>4<\/td><th>estimate <\/th><td> 1477 <\/td><\/tr><tr><td>5<\/td><th>moe <\/th><td> 68 <\/td><\/tr><tr><td>6<\/td><th>geometry <\/th><td>sfc_MULTIPOLYGON <\/td><\/tr><\/table><\/div>","<div class='scrollableContainer'><table class=mapview-popup id='popup'><tr class='coord'><td><\/td><th><b>Feature ID <\/b><\/th><td>5 <\/td><\/tr><tr><td>1<\/td><th>GEOID <\/th><td>41015 <\/td><\/tr><tr><td>2<\/td><th>NAME <\/th><td>Curry County, Oregon <\/td><\/tr><tr><td>3<\/td><th>variable <\/th><td>ed_attain <\/td><\/tr><tr><td>4<\/td><th>estimate <\/th><td> 19116 <\/td><\/tr><tr><td>5<\/td><th>moe <\/th><td>120 <\/td><\/tr><tr><td>6<\/td><th>geometry <\/th><td>sfc_MULTIPOLYGON <\/td><\/tr><\/table><\/div>","<div class='scrollableContainer'><table class=mapview-popup id='popup'><tr class='coord'><td><\/td><th><b>Feature ID <\/b><\/th><td>6 <\/td><\/tr><tr><td>1<\/td><th>GEOID <\/th><td>41039 <\/td><\/tr><tr><td>2<\/td><th>NAME <\/th><td>Lane County, Oregon <\/td><\/tr><tr><td>3<\/td><th>variable <\/th><td>ed_attain <\/td><\/tr><tr><td>4<\/td><th>estimate <\/th><td>264813 <\/td><\/tr><tr><td>5<\/td><th>moe <\/th><td> 66 <\/td><\/tr><tr><td>6<\/td><th>geometry <\/th><td>sfc_MULTIPOLYGON <\/td><\/tr><\/table><\/div>","<div class='scrollableContainer'><table class=mapview-popup id='popup'><tr class='coord'><td><\/td><th><b>Feature ID <\/b><\/th><td>7 <\/td><\/tr><tr><td>1<\/td><th>GEOID <\/th><td>41025 <\/td><\/tr><tr><td>2<\/td><th>NAME <\/th><td>Harney County, Oregon <\/td><\/tr><tr><td>3<\/td><th>variable <\/th><td>ed_attain <\/td><\/tr><tr><td>4<\/td><th>estimate <\/th><td> 5499 <\/td><\/tr><tr><td>5<\/td><th>moe <\/th><td> 89 <\/td><\/tr><tr><td>6<\/td><th>geometry <\/th><td>sfc_MULTIPOLYGON <\/td><\/tr><\/table><\/div>","<div class='scrollableContainer'><table class=mapview-popup id='popup'><tr class='coord'><td><\/td><th><b>Feature ID <\/b><\/th><td>8 <\/td><\/tr><tr><td>1<\/td><th>GEOID <\/th><td>41005 <\/td><\/tr><tr><td>2<\/td><th>NAME <\/th><td>Clackamas County, Oregon <\/td><\/tr><tr><td>3<\/td><th>variable <\/th><td>ed_attain <\/td><\/tr><tr><td>4<\/td><th>estimate <\/th><td>300373 <\/td><\/tr><tr><td>5<\/td><th>moe <\/th><td> 58 <\/td><\/tr><tr><td>6<\/td><th>geometry <\/th><td>sfc_MULTIPOLYGON <\/td><\/tr><\/table><\/div>","<div class='scrollableContainer'><table class=mapview-popup id='popup'><tr class='coord'><td><\/td><th><b>Feature ID <\/b><\/th><td>9 <\/td><\/tr><tr><td>1<\/td><th>GEOID <\/th><td>41047 <\/td><\/tr><tr><td>2<\/td><th>NAME <\/th><td>Marion County, Oregon <\/td><\/tr><tr><td>3<\/td><th>variable <\/th><td>ed_attain <\/td><\/tr><tr><td>4<\/td><th>estimate <\/th><td>230076 <\/td><\/tr><tr><td>5<\/td><th>moe <\/th><td>209 <\/td><\/tr><tr><td>6<\/td><th>geometry <\/th><td>sfc_MULTIPOLYGON <\/td><\/tr><\/table><\/div>","<div class='scrollableContainer'><table class=mapview-popup id='popup'><tr class='coord'><td><\/td><th><b>Feature ID <\/b><\/th><td>10 <\/td><\/tr><tr><td>1<\/td><th>GEOID <\/th><td>41031 <\/td><\/tr><tr><td>2<\/td><th>NAME <\/th><td>Jefferson County, Oregon <\/td><\/tr><tr><td>3<\/td><th>variable <\/th><td>ed_attain <\/td><\/tr><tr><td>4<\/td><th>estimate <\/th><td> 17060 <\/td><\/tr><tr><td>5<\/td><th>moe <\/th><td> 76 <\/td><\/tr><tr><td>6<\/td><th>geometry <\/th><td>sfc_MULTIPOLYGON <\/td><\/tr><\/table><\/div>","<div class='scrollableContainer'><table class=mapview-popup id='popup'><tr class='coord'><td><\/td><th><b>Feature ID <\/b><\/th><td>11 <\/td><\/tr><tr><td>1<\/td><th>GEOID <\/th><td>41035 <\/td><\/tr><tr><td>2<\/td><th>NAME <\/th><td>Klamath County, Oregon <\/td><\/tr><tr><td>3<\/td><th>variable <\/th><td>ed_attain <\/td><\/tr><tr><td>4<\/td><th>estimate <\/th><td> 48771 <\/td><\/tr><tr><td>5<\/td><th>moe <\/th><td>140 <\/td><\/tr><tr><td>6<\/td><th>geometry <\/th><td>sfc_MULTIPOLYGON <\/td><\/tr><\/table><\/div>","<div class='scrollableContainer'><table class=mapview-popup id='popup'><tr class='coord'><td><\/td><th><b>Feature ID <\/b><\/th><td>12 <\/td><\/tr><tr><td>1<\/td><th>GEOID <\/th><td>41013 <\/td><\/tr><tr><td>2<\/td><th>NAME <\/th><td>Crook County, Oregon <\/td><\/tr><tr><td>3<\/td><th>variable <\/th><td>ed_attain <\/td><\/tr><tr><td>4<\/td><th>estimate <\/th><td> 18626 <\/td><\/tr><tr><td>5<\/td><th>moe <\/th><td>171 <\/td><\/tr><tr><td>6<\/td><th>geometry <\/th><td>sfc_MULTIPOLYGON <\/td><\/tr><\/table><\/div>","<div class='scrollableContainer'><table class=mapview-popup id='popup'><tr class='coord'><td><\/td><th><b>Feature ID <\/b><\/th><td>13 <\/td><\/tr><tr><td>1<\/td><th>GEOID <\/th><td>41061 <\/td><\/tr><tr><td>2<\/td><th>NAME <\/th><td>Union County, Oregon <\/td><\/tr><tr><td>3<\/td><th>variable <\/th><td>ed_attain <\/td><\/tr><tr><td>4<\/td><th>estimate <\/th><td> 17596 <\/td><\/tr><tr><td>5<\/td><th>moe <\/th><td> 60 <\/td><\/tr><tr><td>6<\/td><th>geometry <\/th><td>sfc_MULTIPOLYGON <\/td><\/tr><\/table><\/div>","<div class='scrollableContainer'><table class=mapview-popup id='popup'><tr class='coord'><td><\/td><th><b>Feature ID <\/b><\/th><td>14 <\/td><\/tr><tr><td>1<\/td><th>GEOID <\/th><td>41019 <\/td><\/tr><tr><td>2<\/td><th>NAME <\/th><td>Douglas County, Oregon <\/td><\/tr><tr><td>3<\/td><th>variable <\/th><td>ed_attain <\/td><\/tr><tr><td>4<\/td><th>estimate <\/th><td> 82360 <\/td><\/tr><tr><td>5<\/td><th>moe <\/th><td> 82 <\/td><\/tr><tr><td>6<\/td><th>geometry <\/th><td>sfc_MULTIPOLYGON <\/td><\/tr><\/table><\/div>","<div class='scrollableContainer'><table class=mapview-popup id='popup'><tr class='coord'><td><\/td><th><b>Feature ID <\/b><\/th><td>15 <\/td><\/tr><tr><td>1<\/td><th>GEOID <\/th><td>41051 <\/td><\/tr><tr><td>2<\/td><th>NAME <\/th><td>Multnomah County, Oregon <\/td><\/tr><tr><td>3<\/td><th>variable <\/th><td>ed_attain <\/td><\/tr><tr><td>4<\/td><th>estimate <\/th><td>598188 <\/td><\/tr><tr><td>5<\/td><th>moe <\/th><td>NA <\/td><\/tr><tr><td>6<\/td><th>geometry <\/th><td>sfc_MULTIPOLYGON <\/td><\/tr><\/table><\/div>","<div class='scrollableContainer'><table class=mapview-popup id='popup'><tr class='coord'><td><\/td><th><b>Feature ID <\/b><\/th><td>16 <\/td><\/tr><tr><td>1<\/td><th>GEOID <\/th><td>41023 <\/td><\/tr><tr><td>2<\/td><th>NAME <\/th><td>Grant County, Oregon <\/td><\/tr><tr><td>3<\/td><th>variable <\/th><td>ed_attain <\/td><\/tr><tr><td>4<\/td><th>estimate <\/th><td> 5609 <\/td><\/tr><tr><td>5<\/td><th>moe <\/th><td> 52 <\/td><\/tr><tr><td>6<\/td><th>geometry <\/th><td>sfc_MULTIPOLYGON <\/td><\/tr><\/table><\/div>","<div class='scrollableContainer'><table class=mapview-popup id='popup'><tr class='coord'><td><\/td><th><b>Feature ID <\/b><\/th><td>17 <\/td><\/tr><tr><td>1<\/td><th>GEOID <\/th><td>41003 <\/td><\/tr><tr><td>2<\/td><th>NAME <\/th><td>Benton County, Oregon <\/td><\/tr><tr><td>3<\/td><th>variable <\/th><td>ed_attain <\/td><\/tr><tr><td>4<\/td><th>estimate <\/th><td> 58369 <\/td><\/tr><tr><td>5<\/td><th>moe <\/th><td>183 <\/td><\/tr><tr><td>6<\/td><th>geometry <\/th><td>sfc_MULTIPOLYGON <\/td><\/tr><\/table><\/div>","<div class='scrollableContainer'><table class=mapview-popup id='popup'><tr class='coord'><td><\/td><th><b>Feature ID <\/b><\/th><td>18 <\/td><\/tr><tr><td>1<\/td><th>GEOID <\/th><td>41055 <\/td><\/tr><tr><td>2<\/td><th>NAME <\/th><td>Sherman County, Oregon <\/td><\/tr><tr><td>3<\/td><th>variable <\/th><td>ed_attain <\/td><\/tr><tr><td>4<\/td><th>estimate <\/th><td> 1368 <\/td><\/tr><tr><td>5<\/td><th>moe <\/th><td> 98 <\/td><\/tr><tr><td>6<\/td><th>geometry <\/th><td>sfc_MULTIPOLYGON <\/td><\/tr><\/table><\/div>","<div class='scrollableContainer'><table class=mapview-popup id='popup'><tr class='coord'><td><\/td><th><b>Feature ID <\/b><\/th><td>19 <\/td><\/tr><tr><td>1<\/td><th>GEOID <\/th><td>41043 <\/td><\/tr><tr><td>2<\/td><th>NAME <\/th><td>Linn County, Oregon <\/td><\/tr><tr><td>3<\/td><th>variable <\/th><td>ed_attain <\/td><\/tr><tr><td>4<\/td><th>estimate <\/th><td> 89890 <\/td><\/tr><tr><td>5<\/td><th>moe <\/th><td>128 <\/td><\/tr><tr><td>6<\/td><th>geometry <\/th><td>sfc_MULTIPOLYGON <\/td><\/tr><\/table><\/div>","<div class='scrollableContainer'><table class=mapview-popup id='popup'><tr class='coord'><td><\/td><th><b>Feature ID <\/b><\/th><td>20 <\/td><\/tr><tr><td>1<\/td><th>GEOID <\/th><td>41007 <\/td><\/tr><tr><td>2<\/td><th>NAME <\/th><td>Clatsop County, Oregon <\/td><\/tr><tr><td>3<\/td><th>variable <\/th><td>ed_attain <\/td><\/tr><tr><td>4<\/td><th>estimate <\/th><td> 30595 <\/td><\/tr><tr><td>5<\/td><th>moe <\/th><td>234 <\/td><\/tr><tr><td>6<\/td><th>geometry <\/th><td>sfc_MULTIPOLYGON <\/td><\/tr><\/table><\/div>","<div class='scrollableContainer'><table class=mapview-popup id='popup'><tr class='coord'><td><\/td><th><b>Feature ID <\/b><\/th><td>21 <\/td><\/tr><tr><td>1<\/td><th>GEOID <\/th><td>41065 <\/td><\/tr><tr><td>2<\/td><th>NAME <\/th><td>Wasco County, Oregon <\/td><\/tr><tr><td>3<\/td><th>variable <\/th><td>ed_attain <\/td><\/tr><tr><td>4<\/td><th>estimate <\/th><td> 18770 <\/td><\/tr><tr><td>5<\/td><th>moe <\/th><td>169 <\/td><\/tr><tr><td>6<\/td><th>geometry <\/th><td>sfc_MULTIPOLYGON <\/td><\/tr><\/table><\/div>","<div class='scrollableContainer'><table class=mapview-popup id='popup'><tr class='coord'><td><\/td><th><b>Feature ID <\/b><\/th><td>22 <\/td><\/tr><tr><td>1<\/td><th>GEOID <\/th><td>41017 <\/td><\/tr><tr><td>2<\/td><th>NAME <\/th><td>Deschutes County, Oregon <\/td><\/tr><tr><td>3<\/td><th>variable <\/th><td>ed_attain <\/td><\/tr><tr><td>4<\/td><th>estimate <\/th><td>147063 <\/td><\/tr><tr><td>5<\/td><th>moe <\/th><td>295 <\/td><\/tr><tr><td>6<\/td><th>geometry <\/th><td>sfc_MULTIPOLYGON <\/td><\/tr><\/table><\/div>","<div class='scrollableContainer'><table class=mapview-popup id='popup'><tr class='coord'><td><\/td><th><b>Feature ID <\/b><\/th><td>23 <\/td><\/tr><tr><td>1<\/td><th>GEOID <\/th><td>41067 <\/td><\/tr><tr><td>2<\/td><th>NAME <\/th><td>Washington County, Oregon <\/td><\/tr><tr><td>3<\/td><th>variable <\/th><td>ed_attain <\/td><\/tr><tr><td>4<\/td><th>estimate <\/th><td>417204 <\/td><\/tr><tr><td>5<\/td><th>moe <\/th><td>123 <\/td><\/tr><tr><td>6<\/td><th>geometry <\/th><td>sfc_MULTIPOLYGON <\/td><\/tr><\/table><\/div>","<div class='scrollableContainer'><table class=mapview-popup id='popup'><tr class='coord'><td><\/td><th><b>Feature ID <\/b><\/th><td>24 <\/td><\/tr><tr><td>1<\/td><th>GEOID <\/th><td>41071 <\/td><\/tr><tr><td>2<\/td><th>NAME <\/th><td>Yamhill County, Oregon <\/td><\/tr><tr><td>3<\/td><th>variable <\/th><td>ed_attain <\/td><\/tr><tr><td>4<\/td><th>estimate <\/th><td> 73347 <\/td><\/tr><tr><td>5<\/td><th>moe <\/th><td>272 <\/td><\/tr><tr><td>6<\/td><th>geometry <\/th><td>sfc_MULTIPOLYGON <\/td><\/tr><\/table><\/div>","<div class='scrollableContainer'><table class=mapview-popup id='popup'><tr class='coord'><td><\/td><th><b>Feature ID <\/b><\/th><td>25 <\/td><\/tr><tr><td>1<\/td><th>GEOID <\/th><td>41063 <\/td><\/tr><tr><td>2<\/td><th>NAME <\/th><td>Wallowa County, Oregon <\/td><\/tr><tr><td>3<\/td><th>variable <\/th><td>ed_attain <\/td><\/tr><tr><td>4<\/td><th>estimate <\/th><td> 5608 <\/td><\/tr><tr><td>5<\/td><th>moe <\/th><td> 60 <\/td><\/tr><tr><td>6<\/td><th>geometry <\/th><td>sfc_MULTIPOLYGON <\/td><\/tr><\/table><\/div>","<div class='scrollableContainer'><table class=mapview-popup id='popup'><tr class='coord'><td><\/td><th><b>Feature ID <\/b><\/th><td>26 <\/td><\/tr><tr><td>1<\/td><th>GEOID <\/th><td>41049 <\/td><\/tr><tr><td>2<\/td><th>NAME <\/th><td>Morrow County, Oregon <\/td><\/tr><tr><td>3<\/td><th>variable <\/th><td>ed_attain <\/td><\/tr><tr><td>4<\/td><th>estimate <\/th><td> 7712 <\/td><\/tr><tr><td>5<\/td><th>moe <\/th><td> 45 <\/td><\/tr><tr><td>6<\/td><th>geometry <\/th><td>sfc_MULTIPOLYGON <\/td><\/tr><\/table><\/div>","<div class='scrollableContainer'><table class=mapview-popup id='popup'><tr class='coord'><td><\/td><th><b>Feature ID <\/b><\/th><td>27 <\/td><\/tr><tr><td>1<\/td><th>GEOID <\/th><td>41037 <\/td><\/tr><tr><td>2<\/td><th>NAME <\/th><td>Lake County, Oregon <\/td><\/tr><tr><td>3<\/td><th>variable <\/th><td>ed_attain <\/td><\/tr><tr><td>4<\/td><th>estimate <\/th><td> 6130 <\/td><\/tr><tr><td>5<\/td><th>moe <\/th><td>108 <\/td><\/tr><tr><td>6<\/td><th>geometry <\/th><td>sfc_MULTIPOLYGON <\/td><\/tr><\/table><\/div>","<div class='scrollableContainer'><table class=mapview-popup id='popup'><tr class='coord'><td><\/td><th><b>Feature ID <\/b><\/th><td>28 <\/td><\/tr><tr><td>1<\/td><th>GEOID <\/th><td>41057 <\/td><\/tr><tr><td>2<\/td><th>NAME <\/th><td>Tillamook County, Oregon <\/td><\/tr><tr><td>3<\/td><th>variable <\/th><td>ed_attain <\/td><\/tr><tr><td>4<\/td><th>estimate <\/th><td> 20699 <\/td><\/tr><tr><td>5<\/td><th>moe <\/th><td>136 <\/td><\/tr><tr><td>6<\/td><th>geometry <\/th><td>sfc_MULTIPOLYGON <\/td><\/tr><\/table><\/div>","<div class='scrollableContainer'><table class=mapview-popup id='popup'><tr class='coord'><td><\/td><th><b>Feature ID <\/b><\/th><td>29 <\/td><\/tr><tr><td>1<\/td><th>GEOID <\/th><td>41027 <\/td><\/tr><tr><td>2<\/td><th>NAME <\/th><td>Hood River County, Oregon <\/td><\/tr><tr><td>3<\/td><th>variable <\/th><td>ed_attain <\/td><\/tr><tr><td>4<\/td><th>estimate <\/th><td> 16735 <\/td><\/tr><tr><td>5<\/td><th>moe <\/th><td>127 <\/td><\/tr><tr><td>6<\/td><th>geometry <\/th><td>sfc_MULTIPOLYGON <\/td><\/tr><\/table><\/div>","<div class='scrollableContainer'><table class=mapview-popup id='popup'><tr class='coord'><td><\/td><th><b>Feature ID <\/b><\/th><td>30 <\/td><\/tr><tr><td>1<\/td><th>GEOID <\/th><td>41059 <\/td><\/tr><tr><td>2<\/td><th>NAME <\/th><td>Umatilla County, Oregon <\/td><\/tr><tr><td>3<\/td><th>variable <\/th><td>ed_attain <\/td><\/tr><tr><td>4<\/td><th>estimate <\/th><td> 52883 <\/td><\/tr><tr><td>5<\/td><th>moe <\/th><td> 93 <\/td><\/tr><tr><td>6<\/td><th>geometry <\/th><td>sfc_MULTIPOLYGON <\/td><\/tr><\/table><\/div>","<div class='scrollableContainer'><table class=mapview-popup id='popup'><tr class='coord'><td><\/td><th><b>Feature ID <\/b><\/th><td>31 <\/td><\/tr><tr><td>1<\/td><th>GEOID <\/th><td>41041 <\/td><\/tr><tr><td>2<\/td><th>NAME <\/th><td>Lincoln County, Oregon <\/td><\/tr><tr><td>3<\/td><th>variable <\/th><td>ed_attain <\/td><\/tr><tr><td>4<\/td><th>estimate <\/th><td> 39183 <\/td><\/tr><tr><td>5<\/td><th>moe <\/th><td>147 <\/td><\/tr><tr><td>6<\/td><th>geometry <\/th><td>sfc_MULTIPOLYGON <\/td><\/tr><\/table><\/div>","<div class='scrollableContainer'><table class=mapview-popup id='popup'><tr class='coord'><td><\/td><th><b>Feature ID <\/b><\/th><td>32 <\/td><\/tr><tr><td>1<\/td><th>GEOID <\/th><td>41009 <\/td><\/tr><tr><td>2<\/td><th>NAME <\/th><td>Columbia County, Oregon <\/td><\/tr><tr><td>3<\/td><th>variable <\/th><td>ed_attain <\/td><\/tr><tr><td>4<\/td><th>estimate <\/th><td> 38085 <\/td><\/tr><tr><td>5<\/td><th>moe <\/th><td>175 <\/td><\/tr><tr><td>6<\/td><th>geometry <\/th><td>sfc_MULTIPOLYGON <\/td><\/tr><\/table><\/div>","<div class='scrollableContainer'><table class=mapview-popup id='popup'><tr class='coord'><td><\/td><th><b>Feature ID <\/b><\/th><td>33 <\/td><\/tr><tr><td>1<\/td><th>GEOID <\/th><td>41069 <\/td><\/tr><tr><td>2<\/td><th>NAME <\/th><td>Wheeler County, Oregon <\/td><\/tr><tr><td>3<\/td><th>variable <\/th><td>ed_attain <\/td><\/tr><tr><td>4<\/td><th>estimate <\/th><td> 1101 <\/td><\/tr><tr><td>5<\/td><th>moe <\/th><td>100 <\/td><\/tr><tr><td>6<\/td><th>geometry <\/th><td>sfc_MULTIPOLYGON <\/td><\/tr><\/table><\/div>","<div class='scrollableContainer'><table class=mapview-popup id='popup'><tr class='coord'><td><\/td><th><b>Feature ID <\/b><\/th><td>34 <\/td><\/tr><tr><td>1<\/td><th>GEOID <\/th><td>41029 <\/td><\/tr><tr><td>2<\/td><th>NAME <\/th><td>Jackson County, Oregon <\/td><\/tr><tr><td>3<\/td><th>variable <\/th><td>ed_attain <\/td><\/tr><tr><td>4<\/td><th>estimate <\/th><td>160008 <\/td><\/tr><tr><td>5<\/td><th>moe <\/th><td>224 <\/td><\/tr><tr><td>6<\/td><th>geometry <\/th><td>sfc_MULTIPOLYGON <\/td><\/tr><\/table><\/div>","<div class='scrollableContainer'><table class=mapview-popup id='popup'><tr class='coord'><td><\/td><th><b>Feature ID <\/b><\/th><td>35 <\/td><\/tr><tr><td>1<\/td><th>GEOID <\/th><td>41053 <\/td><\/tr><tr><td>2<\/td><th>NAME <\/th><td>Polk County, Oregon <\/td><\/tr><tr><td>3<\/td><th>variable <\/th><td>ed_attain <\/td><\/tr><tr><td>4<\/td><th>estimate <\/th><td> 57222 <\/td><\/tr><tr><td>5<\/td><th>moe <\/th><td>237 <\/td><\/tr><tr><td>6<\/td><th>geometry <\/th><td>sfc_MULTIPOLYGON <\/td><\/tr><\/table><\/div>","<div class='scrollableContainer'><table class=mapview-popup id='popup'><tr class='coord'><td><\/td><th><b>Feature ID <\/b><\/th><td>36 <\/td><\/tr><tr><td>1<\/td><th>GEOID <\/th><td>41011 <\/td><\/tr><tr><td>2<\/td><th>NAME <\/th><td>Coos County, Oregon <\/td><\/tr><tr><td>3<\/td><th>variable <\/th><td>ed_attain <\/td><\/tr><tr><td>4<\/td><th>estimate <\/th><td> 48945 <\/td><\/tr><tr><td>5<\/td><th>moe <\/th><td>172 <\/td><\/tr><tr><td>6<\/td><th>geometry <\/th><td>sfc_MULTIPOLYGON <\/td><\/tr><\/table><\/div>"],{"maxWidth":800,"minWidth":50,"autoPan":true,"keepInView":false,"closeButton":true,"closeOnClick":true,"className":""},["65703","20497","12415","1477","19116","264813","5499","300373","230076","17060","48771","18626","17596","82360","598188","5609","58369","1368","89890","30595","18770","147063","417204","73347","5608","7712","6130","20699","16735","52883","39183","38085","1101","160008","57222","48945"],{"interactive":false,"permanent":false,"direction":"auto","opacity":1,"offset":[0,0],"textsize":"10px","textOnly":false,"className":"","sticky":true},{"stroke":true,"weight":1,"opacity":0.9,"fillOpacity":0.84,"bringToFront":false,"sendToBack":false}]},{"method":"addScaleBar","args":[{"maxWidth":100,"metric":true,"imperial":true,"updateWhenIdle":true,"position":"bottomleft"}]},{"method":"addHomeButton","args":[-124.566244,41.991794,-116.463504,46.290834,true,"cnty___estimate","Zoom to cnty___estimate","<strong> cnty___estimate <\/strong>","bottomright"]},{"method":"addLayersControl","args":[["CartoDB.Positron","CartoDB.DarkMatter","OpenStreetMap","Esri.WorldImagery","OpenTopoMap"],"cnty - estimate",{"collapsed":true,"autoZIndex":true,"position":"topleft"}]},{"method":"addLegend","args":[{"colors":["#4B0055 , #353E7C 16.5635828614591%, #007094 33.3115609618029%, #009C95 50.0595390621467%, #00BF7C 66.8075171624906%, #98D84A 83.5554952628344%, #FDE333 "],"labels":["100,000","200,000","300,000","400,000","500,000"],"na_color":null,"na_label":"NA","opacity":1,"position":"topright","type":"numeric","title":"cnty - estimate","extra":{"p_1":0.1656358286145905,"p_n":0.8355549526283439},"layerId":null,"className":"info legend","group":"cnty - estimate"}]}],"limits":{"lat":[41.991794,46.290834],"lng":[-124.566244,-116.463504]},"fitBounds":[41.991794,-124.566244,46.290834,-116.463504,[]]},"evals":[],"jsHooks":{"render":[{"code":"function(el, x, data) {\n return (\n function(el, x, data) {\n // get the leaflet map\n var map = this; //HTMLWidgets.find('#' + el.id);\n // we need a new div element because we have to handle\n // the mouseover output separately\n // debugger;\n function addElement () {\n // generate new div Element\n var newDiv = $(document.createElement('div'));\n // append at end of leaflet htmlwidget container\n $(el).append(newDiv);\n //provide ID and style\n newDiv.addClass('lnlt');\n newDiv.css({\"position\":\"relative\",\"bottomleft\":\"0px\",\"background-color\":\"rgba(255, 255, 255, 0.7)\",\"box-shadow\":\"0 0 2px #bbb\",\"background-clip\":\"padding-box\",\"margin\":\"0\",\"padding-left\":\"5px\",\"padding-right\":\"5px\",\"color\":\"#333\",\"font-size\":\"9px\",\"font-family\":\"\\\"Helvetica Neue\\\", Arial, Helvetica, sans-serif\",\"text-align\":\"left\",\"z-index\":\"700\"});\n return newDiv;\n }\n\n\n // check for already existing lnlt class to not duplicate\n var lnlt = $(el).find('.lnlt');\n\n if(!lnlt.length) {\n lnlt = addElement();\n\n // grab the special div we generated in the beginning\n // and put the mousmove output there\n\n map.on('mousemove', function (e) {\n if (e.originalEvent.ctrlKey) {\n if (document.querySelector('.lnlt') === null) lnlt = addElement();\n lnlt.text(\n ' lon: ' + (e.latlng.lng).toFixed(5) +\n ' | lat: ' + (e.latlng.lat).toFixed(5) +\n ' | zoom: ' + map.getZoom() +\n ' | x: ' + L.CRS.EPSG3857.project(e.latlng).x.toFixed(0) +\n ' | y: ' + L.CRS.EPSG3857.project(e.latlng).y.toFixed(0) +\n ' | epsg: 3857 ' +\n ' | proj4: +proj=merc +a=6378137 +b=6378137 +lat_ts=0.0 +lon_0=0.0 +x_0=0.0 +y_0=0 +k=1.0 +units=m +nadgrids=@null +no_defs ');\n } else {\n if (document.querySelector('.lnlt') === null) lnlt = addElement();\n lnlt.text(\n ' lon: ' + (e.latlng.lng).toFixed(5) +\n ' | lat: ' + (e.latlng.lat).toFixed(5) +\n ' | zoom: ' + map.getZoom() + ' ');\n }\n });\n\n // remove the lnlt div when mouse leaves map\n map.on('mouseout', function (e) {\n var strip = document.querySelector('.lnlt');\n if( strip !==null) strip.remove();\n });\n\n };\n\n //$(el).keypress(67, function(e) {\n map.on('preclick', function(e) {\n if (e.originalEvent.ctrlKey) {\n if (document.querySelector('.lnlt') === null) lnlt = addElement();\n lnlt.text(\n ' lon: ' + (e.latlng.lng).toFixed(5) +\n ' | lat: ' + (e.latlng.lat).toFixed(5) +\n ' | zoom: ' + map.getZoom() + ' ');\n var txt = document.querySelector('.lnlt').textContent;\n console.log(txt);\n //txt.innerText.focus();\n //txt.select();\n setClipboardText('\"' + txt + '\"');\n }\n });\n\n }\n ).call(this.getMap(), el, x, data);\n}","data":null},{"code":"function(el, x, data) {\n return (function(el,x,data){\n var map = this;\n\n map.on('keypress', function(e) {\n console.log(e.originalEvent.code);\n var key = e.originalEvent.code;\n if (key === 'KeyE') {\n var bb = this.getBounds();\n var txt = JSON.stringify(bb);\n console.log(txt);\n\n setClipboardText('\\'' + txt + '\\'');\n }\n })\n }).call(this.getMap(), el, x, data);\n}","data":null}]}}</script> --- ``` r mapview(cnty, zcol = "estimate", popup = leafpop::popupTable(cnty, zcol = c("NAME", "estimate"))) ``` <div class="leaflet html-widget html-fill-item" id="htmlwidget-3c9a6efaf75af0cdd812" style="width:576px;height:504px;"></div> <script type="application/json" data-for="htmlwidget-3c9a6efaf75af0cdd812">{"x":{"options":{"minZoom":1,"maxZoom":52,"crs":{"crsClass":"L.CRS.EPSG3857","code":null,"proj4def":null,"projectedBounds":null,"options":{}},"preferCanvas":false,"bounceAtZoomLimits":false,"maxBounds":[[[-90,-370]],[[90,370]]]},"calls":[{"method":"addProviderTiles","args":["CartoDB.Positron","CartoDB.Positron","CartoDB.Positron",{"errorTileUrl":"","noWrap":false,"detectRetina":false,"pane":"tilePane"}]},{"method":"addProviderTiles","args":["CartoDB.DarkMatter","CartoDB.DarkMatter","CartoDB.DarkMatter",{"errorTileUrl":"","noWrap":false,"detectRetina":false,"pane":"tilePane"}]},{"method":"addProviderTiles","args":["OpenStreetMap","OpenStreetMap","OpenStreetMap",{"errorTileUrl":"","noWrap":false,"detectRetina":false,"pane":"tilePane"}]},{"method":"addProviderTiles","args":["Esri.WorldImagery","Esri.WorldImagery","Esri.WorldImagery",{"errorTileUrl":"","noWrap":false,"detectRetina":false,"pane":"tilePane"}]},{"method":"addProviderTiles","args":["OpenTopoMap","OpenTopoMap","OpenTopoMap",{"errorTileUrl":"","noWrap":false,"detectRetina":false,"pane":"tilePane"}]},{"method":"createMapPane","args":["polygon",420]},{"method":"addPolygons","args":[[[[{"lng":[-124.041983,-124.038842,-124.036998,-124.037333,-124.036177,-124.037047,-124.035796,-124.036828,-124.035718,-124.032309,-124.030212,-124.028557,-124.026168,-124.02306,-124.021521,-124.02036,-124.017488,-124.016251,-124.013345,-124.013057,-124.011666,-124.009651,-124.00863,-124.008668,-124.009216,-124.010968,-124.012825,-124.009457,-124.009174,-124.009677,-124.011005,-124.011699,-124.013664,-124.014611,-124.014517,-124.013606,-124.012236,-124.010703,-124.008608,-124.002891,-124.002003,-124.001625,-124.001851,-124.003591,-124.004475,-124.003935,-124.003052,-124.001535,-124.001159,-124.001334,-124.005436,-124.005753,-124.005121,-124.002827,-124.002402,-124.001225,-124.001127,-124.002893,-124.002819,-124.001629,-124.00144,-124.002248,-124.003139,-124.004173,-124.005541,-124.006863,-124.009244,-124.011544,-124.010456,-124.008695,-124.005475,-124.001195,-123.99878,-123.997493,-123.995531,-123.993419,-123.990256,-123.988482,-123.986415,-123.981442,-123.978035,-123.972758,-123.969199,-123.967916,-123.964007,-123.961176,-123.958133,-123.952541,-123.949711,-123.947539,-123.945943,-123.941841,-123.938921,-123.93669,-123.934826,-123.932984,-123.929368,-123.928109,-123.92617,-123.923228,-123.919321,-123.917355,-123.915768,-123.913158,-123.910798,-123.908023,-123.904993,-123.902759,-123.900611,-123.897998,-123.89549,-123.894213,-123.890657,-123.888662,-123.885746,-123.886257,-123.884898,-123.885552,-123.884731,-123.879821,-123.880309,-123.875256,-123.876929,-123.876055,-123.878426,-123.879224,-123.878488,-123.875677,-123.875902,-123.874554,-123.875128,-123.87338,-123.872161,-123.870714,-123.871196,-123.868406,-123.865843,-123.865356,-123.863521,-123.861708,-123.854798,-123.855219,-123.856672,-123.859311,-123.860844,-123.859671,-123.860305,-123.858754,-123.857235,-123.855639,-123.853474,-123.853456,-123.850036,-123.850134,-123.849517,-123.850178,-123.849663,-123.846549,-123.841223,-123.840861,-123.835668,-123.830315,-123.830469,-123.82926,-123.829275,-123.828393,-123.828618,-123.827067,-123.824234,-123.821583,-123.82086,-123.819403,-123.818972,-123.81985,-123.821526,-123.824264,-123.828568,-123.831689,-123.831264,-123.779962,-123.774581,-123.773716,-123.773833,-123.772341,-123.770488,-123.768483,-123.769127,-123.766875,-123.765268,-123.764535,-123.762886,-123.761074,-123.760665,-123.759135,-123.758186,-123.757263,-123.754795,-123.756231,-123.75543,-123.7545,-123.749533,-123.747579,-123.744373,-123.741852,-123.739398,-123.737502,-123.737944,-123.736506,-123.735183,-123.735421,-123.734322,-123.733021,-123.730022,-123.729321,-123.727794,-123.725276,-123.72218,-123.720119,-123.72034,-123.718719,-123.716492,-123.716505,-123.701384,-123.696843,-123.697,-123.687089,-123.687082,-123.677206,-123.677275,-123.581699,-123.581862,-123.571814,-123.571728,-123.566777,-123.567036,-123.562086,-123.562168,-123.542433,-123.542539,-123.523444,-123.494414,-123.494304,-123.484693,-123.465261,-123.465271,-123.455304,-123.455213,-123.445456,-123.444922,-123.431052,-123.425687,-123.425721,-123.406299,-123.406341,-123.4014,-123.401297,-123.400242,-123.371999,-123.371581,-123.36665,-123.366666,-123.347048,-123.328588,-123.328626,-123.309162,-123.309197,-123.274283,-123.27426,-123.249328,-123.249209,-123.229619,-123.229581,-123.229526,-123.229676,-123.229545,-123.229271,-123.229284,-123.229402,-123.229761,-123.229901,-123.2299,-123.229851,-123.229167,-123.231093,-123.230951,-123.230969,-123.231001,-123.23111258448,-123.245561,-123.344311064432,-123.346955,-123.44467,-123.474991,-123.517910995163,-123.518734,-123.530013873107,-123.569305,-123.624022,-123.631514798612,-123.657212,-123.728169,-123.787501,-123.811708,-123.822037891998,-123.820663,-123.818981,-123.818161,-123.821615,-123.824441,-123.826343,-123.828843,-123.829295,-123.827502,-123.827325,-123.830213,-123.832066,-123.833287,-123.834613,-123.83615,-123.83774,-123.838592,-123.838849,-123.839529,-123.839963,-123.840068,-123.840103,-123.837541,-123.83653,-123.837496,-123.837574,-123.836151,-123.841723,-123.844471,-123.845386,-123.845611,-123.847758,-123.848952,-123.84909,-123.848497,-123.846851,-123.843151,-123.840693,-123.840683,-123.840118,-123.838574,-123.838755,-123.840893,-123.841559,-123.840227,-123.834601,-123.834302,-123.834173,-123.830968,-123.829397,-123.827264,-123.828112,-123.826921,-123.8271,-123.825624,-123.824877,-123.82251,-123.821973,-123.82572,-123.829528,-123.829967,-123.830979,-123.831124,-123.832155,-123.835422,-123.836688,-123.838249,-123.840156,-123.840149,-123.83883,-123.839241,-123.842828,-123.846258,-123.850176,-123.854857,-123.856075,-123.858549,-123.857192,-123.85591,-123.855572,-123.853382,-123.85081,-123.849528,-123.844724,-123.842871,-123.840232,-123.836854,-123.827684,-123.826311,-123.823911,-123.822386,-123.821199,-123.820841,-123.817915,-123.815726,-123.812603,-123.814793,-123.814536,-123.815092,-123.813199,-123.813505,-123.816316,-123.81719,-123.821288,-123.820857,-123.821531,-123.820407,-123.820471,-123.818915,-123.816794,-123.813891,-123.812417,-123.811361,-123.808307,-123.805991,-123.802202,-123.799931,-123.797063,-123.796702,-123.793144,-123.790462,-123.791154,-123.792834,-123.793288,-123.793075,-123.794003,-123.79252,-123.7922,-123.796383,-123.798159,-123.79962,-123.803515,-123.805938,-123.809421,-123.812203,-123.810017,-123.811604,-123.811992,-123.813816,-123.815251,-123.814997,-123.817359,-123.820847,-123.822177,-123.823743,-123.82382,-123.826159,-123.825742,-123.825321,-123.828031,-123.829732,-123.830947,-123.832684,-123.832956,-123.835287,-123.838419,-123.836606,-123.837879,-123.83972,-123.843007,-123.843557,-123.847315,-123.847595,-123.847483,-123.845404,-123.844167,-123.841454,-123.839496,-123.8417,-123.845982,-123.84557,-123.849054,-123.851287,-123.853846,-123.856118,-123.857646,-123.859863,-123.863558,-123.864168,-123.866394,-123.869582,-123.871462,-123.871837,-123.87318,-123.875264,-123.87675,-123.876337,-123.878927,-123.878522,-123.877858,-123.877852,-123.878816,-123.884467,-123.884354,-123.888026,-123.891321,-123.892651,-123.895094,-123.897208,-123.900219,-123.903527,-123.907007,-123.910437,-123.915017,-123.916606,-123.920408,-123.923302,-123.924437,-123.925893,-123.928303,-123.930195,-123.933213,-123.93467,-123.935313,-123.936538,-123.940407,-123.944632,-123.94959,-123.953011,-123.956029,-123.962628,-123.966661,-123.970015,-123.972898,-123.978917,-123.984686,-123.986317,-123.990456,-123.992913,-123.995141,-123.998549,-124.008637,-124.010986,-124.017452,-124.01908,-124.021961,-124.026947,-124.028712,-124.030141,-124.032262,-124.033565,-124.036265,-124.036171,-124.035001,-124.035489,-124.037266,-124.03726,-124.038584,-124.039586,-124.041579,-124.041983],"lat":[42.387656,42.388837,42.392623,42.393818,42.394949,42.395766,42.396407,42.398726,42.401762,42.403283,42.402883,42.403308,42.407409,42.407621,42.408194,42.410041,42.410959,42.412176,42.412677,42.413114,42.416175,42.418034,42.419622,42.420822,42.421399,42.421801,42.423994,42.426465,42.427216,42.427851,42.428504,42.429269,42.430707,42.432342,42.434189,42.435068,42.437069,42.439908,42.441928,42.443527,42.444308,42.445291,42.44602,42.447785,42.451153,42.451543,42.451972,42.453402,42.453976,42.455054,42.458572,42.461239,42.462041,42.462667,42.46302,42.464829,42.467382,42.47166,42.473912,42.477902,42.480858,42.48466,42.485828,42.486682,42.487376,42.488828,42.489421,42.489628,42.494019,42.496147,42.496918,42.496875,42.499962,42.500694,42.500832,42.499599,42.501621,42.501979,42.498353,42.497167,42.49761,42.49535,42.496028,42.497228,42.49732,42.498816,42.498238,42.499311,42.500487,42.500474,42.501334,42.500867,42.50113,42.500293,42.497079,42.496023,42.496048,42.494563,42.494335,42.495021,42.494737,42.495798,42.495396,42.496146,42.497435,42.496903,42.499165,42.499584,42.498416,42.499058,42.498997,42.499925,42.500538,42.502978,42.504233,42.505436,42.506279,42.507625,42.508401,42.509885,42.511588,42.51372,42.516203,42.516799,42.519959,42.522047,42.524647,42.526195,42.527805,42.528675,42.530067,42.531188,42.533372,42.534203,42.535158,42.536341,42.539031,42.541989,42.542232,42.544375,42.549736,42.551791,42.553775,42.556281,42.559989,42.562393,42.563091,42.564143,42.566509,42.567228,42.569663,42.570941,42.574579,42.57809,42.579542,42.581966,42.583353,42.586258,42.587864,42.588961,42.591633,42.595067,42.598106,42.599452,42.601793,42.604497,42.606107,42.607046,42.607575,42.60913,42.611139,42.612446,42.614786,42.615779,42.619743,42.622398,42.625339,42.625798,42.632313,42.694025,42.700429,42.700834,42.702858,42.704493,42.704685,42.705989,42.708063,42.709109,42.711145,42.713543,42.715028,42.715876,42.717138,42.717906,42.720093,42.720584,42.72596,42.728067,42.731791,42.732339,42.742038,42.742576,42.746335,42.747987,42.751499,42.753118,42.757294,42.760655,42.762842,42.764575,42.765701,42.768945,42.771115,42.773041,42.773809,42.774115,42.775435,42.77747,42.780911,42.782694,42.784061,42.739658,42.739703,42.739593,42.753907,42.753789,42.750274,42.750145,42.739682,42.73992,42.732149,42.732098,42.735716,42.735693,42.72483,42.724796,42.717574,42.717122,42.709832,42.709186,42.70918,42.702248,42.702168,42.702942,42.699297,42.699406,42.702982,42.703025,42.711122,42.710928,42.711039,42.714483,42.713966,42.710288,42.710297,42.724958,42.724951,42.724955,42.739484,42.739471,42.732194,42.732226,42.73175,42.728247,42.728412,42.732055,42.73203,42.724712,42.724404,42.702421,42.70261,42.668065,42.626212,42.551766,42.495623,42.429362,42.420299,42.355665,42.312847,42.290816,42.287434,42.280466,42.128331,42.128069,42.098876,42.082066,42.004931,42.0039324384249,42.003364,41.9993825981084,41.999276,42.000608,42.000661,42.0007581373596,42.00076,42.0007301112694,42.000626,41.99977,41.998714371006,41.995094,41.997056,41.995834,41.995194,41.9956172960188,41.996727,41.998563,41.998791,41.999935,42.000564,42.00188,42.002504,42.004951,42.006535,42.008438,42.011552,42.011666,42.012042,42.012811,42.013911,42.01489,42.015304,42.016469,42.01704,42.017586,42.018098,42.018736,42.020306,42.024006,42.025558,42.02734,42.029292,42.031385,42.03336,42.036426,42.03699,42.040136,42.043009,42.045069,42.046646,42.047798,42.048965,42.051934,42.05248,42.055504,42.057618,42.057965,42.058515,42.059225,42.060507,42.063187,42.063791,42.066002,42.068955,42.069596,42.072475,42.073675,42.074796,42.077493,42.080498,42.084441,42.085321,42.086567,42.093188,42.097285,42.100377,42.101345,42.103609,42.107914,42.10885,42.109619,42.113334,42.116779,42.119291,42.122593,42.124671,42.125599,42.125204,42.126945,42.130628,42.133224,42.135116,42.137426,42.138323,42.141392,42.143597,42.144503,42.145819,42.146369,42.149668,42.152913,42.154378,42.155855,42.157509,42.157656,42.159333,42.161167,42.163027,42.16438,42.166047,42.169651,42.170464,42.172501,42.174122,42.178235,42.183987,42.185435,42.188225,42.189849,42.190924,42.193959,42.195498,42.198974,42.2036,42.203769,42.20573,42.212667,42.214644,42.217284,42.216849,42.215738,42.216388,42.218962,42.219878,42.22111,42.220457,42.222173,42.224314,42.22781,42.230098,42.231155,42.233619,42.237623,42.237497,42.238232,42.240204,42.239436,42.241176,42.241494,42.24399,42.24779,42.251246,42.253495,42.254797,42.259439,42.262603,42.264096,42.264665,42.264365,42.266983,42.268693,42.270973,42.271824,42.276123,42.279255,42.279859,42.281652,42.282991,42.285622,42.286277,42.288537,42.290556,42.294693,42.296282,42.297656,42.298507,42.299219,42.301983,42.303538,42.305638,42.307854,42.310752,42.312202,42.313281,42.316923,42.318327,42.319125,42.320577,42.320742,42.319933,42.318688,42.31854,42.32046,42.321478,42.322362,42.322796,42.324799,42.327455,42.327633,42.330071,42.330669,42.333167,42.335279,42.341049,42.342428,42.344851,42.345667,42.346072,42.347602,42.351454,42.353095,42.353293,42.351422,42.350937,42.349234,42.349314,42.347644,42.347884,42.346709,42.346592,42.346469,42.348835,42.351045,42.352008,42.352612,42.353759,42.354338,42.355761,42.35983,42.361625,42.360604,42.358058,42.356544,42.356991,42.357866,42.356714,42.35774,42.357324,42.357979,42.358505,42.358449,42.359409,42.357941,42.357659,42.358487,42.358488,42.359016,42.358541,42.35977,42.361384,42.36166,42.359199,42.361049,42.363636,42.365481,42.367455,42.3702,42.374389,42.375876,42.377858,42.380525,42.382673,42.383094,42.384751,42.385912,42.387656]}]],[[{"lng":[-118.232214,-118.193345,-118.193405,-118.152945,-118.152456,-118.132141,-118.132347,-118.112092,-118.112068,-118.092122,-118.092087,-118.087036,-118.087016,-118.071877,-118.071916,-118.051902,-118.051956,-118.031808,-118.031671,-118.011485,-118.011402,-117.971947,-117.971787,-117.87228,-117.851163,-117.749535,-117.631491,-117.608707,-117.590849,-117.590858,-117.56962,-117.569664,-117.52936,-117.529408,-117.509202,-117.509214,-117.486744,-117.487014,-117.405264,-117.30419,-117.220060553639,-117.220069,-117.222451,-117.222647,-117.216974,-117.198559149539,-117.198147,-117.193129,-117.170342,-117.15706,-117.143394,-117.138523,-117.133984,-117.133104,-117.13253,-117.130904,-117.121037,-117.118018,-117.111617,-117.107673,-117.104208,-117.102242,-117.098531,-117.09457,-117.093578,-117.090933,-117.089503,-117.07835,-117.074191882813,-117.067284,-117.059352,-117.05651,-117.05303,-117.050057,-117.047399154136,-117.047062,-117.045513,-117.042283,-117.03585,-117.031862,-117.027558,-117.025277,-117.020231,-117.016921,-117.015868756715,-117.008000996386,-117.003682330068,-117.001,-116.98687,-116.983658939347,-116.981825336926,-116.981589778363,-116.978570032446,-116.975905,-116.973542,-116.972828624351,-116.971958,-116.972110100178,-116.972537,-116.973991,-116.973945,-116.970365,-116.970219,-116.9726,-116.973701,-116.971675,-116.967259,-116.965498,-116.949516444006,-116.947591,-116.945256,-116.940534,-116.939296726739,-116.935443,-116.925392,-116.924028,-116.915738,-116.902752,-116.900103,-116.895757,-116.895028421445,-116.894083,-116.894309,-116.895931,-116.897846346997,-116.900834,-116.901737,-116.901922,-116.903327,-116.911218,-116.913239,-116.91376,-116.914236,-116.916410383599,-116.918991,-116.925642,-116.929069,-116.929442,-116.927688,-116.928306,-116.933704,-116.937750474425,-116.937835,-116.940005494001,-116.940274509534,-116.943132,-116.957009,-116.967203,-116.974253,-116.977351,-116.976979427494,-116.9745725227,-116.974016,-116.973185,-116.972504,-116.972045557891,-116.956246,-116.955741432932,-116.955694238564,-116.950573662942,-116.943361,-116.937342,-116.937261403083,-116.935696297006,-116.935592015008,-116.934719940664,-116.934485,-116.935911,-116.941458,-116.941734972941,-116.943742,-116.94321505163,-116.94242,-116.935847,-116.935584,-116.938195,-116.942757,-116.959871,-116.968743,-116.973435,-116.97618,-116.975525,-116.973807,-116.971556,-116.97088,-116.968634,-116.966314,-116.961683,-116.959206,-116.959808,-116.97049,-116.972331,-116.971574,-116.964915,-116.961264,-116.960415,-116.96177,-116.962251,-116.964292,-116.968214,-116.969028,-116.968955773782,-116.968931,-116.967641,-116.961806,-116.959993,-116.959363,-116.958752,-116.962615,-116.972362,-116.97958,-116.981919,-116.980250760831,-116.979961,-116.978564231043,-116.977332,-116.976429,-116.976694,-116.9765,-116.976114,-116.97617647824,-116.98384,-116.98371442608,-116.983199584669,-116.982214,-116.982347,-116.98294,-116.984152,-116.991415,-116.999061,-117.008691316809,-117.01077,-117.020035,-117.021604961574,-117.021721,-117.019853,-117.014828,-117.010701,-117.010383,-117.012831,-117.016826,-117.021461,-117.025156,-117.031887,-117.032881,-117.027931,-117.023577,-117.02155,-117.022110809539,-117.023049,-117.024020777413,-117.026634,-117.026651,-117.026841,-117.026725,-117.026825,-117.026696659314,-117.026586,-117.026624495654,-117.026717,-117.026661,-117.026705,-117.026905,-117.027001,-117.026937,-117.026789,-117.02676,-117.026824,-117.026889,-117.026922,-117.026774,-117.026746,-117.026745350468,-117.026743821013,-117.02674059016,-117.026719331236,-117.026701376309,-117.026652,-117.026683,-117.026253,-117.026303,-117.026331,-117.026665,-117.026631374451,-117.026575021601,-117.026551,-117.026129,-117.026195,-117.02659,-117.026098,-117.026197,-117.040906,-117.04891,-117.055402,-117.068613,-117.197798,-117.217551,-117.403613,-117.443062,-117.506681810353,-117.530197396566,-117.613207836252,-117.6171880341,-117.623731,-117.625973,-117.705780984811,-117.737792142868,-117.873467,-118.123944939374,-118.197189,-118.197369215928,-118.196857,-118.195281,-118.214698,-118.216384,-118.216832,-118.228793,-118.228673,-118.228683,-118.228618,-118.228069,-118.232011,-118.232178,-118.232171,-118.232392,-118.231731,-118.230291,-118.228107,-118.227645,-118.228541,-118.228843,-118.233908,-118.232214],"lat":[44.256129,44.2562,44.270708,44.270684,44.299509,44.299483,44.31431,44.314271,44.328754,44.328734,44.343208,44.343184,44.357646,44.357562,44.372009,44.372004,44.390032,44.389953,44.415192,44.415169,44.429615,44.429296,44.443849,44.443511,44.444045,44.444136,44.444427,44.444661,44.444573,44.43013,44.430062,44.415678,44.415722,44.401329,44.401461,44.387143,44.387246,44.300317,44.301044,44.301462,44.3014040000001,44.301382,44.298963,44.297578,44.288357,44.2741460602673,44.273828,44.270963,44.25889,44.25749,44.258262,44.25937,44.262972,44.264236,44.267045,44.269453,44.277585,44.278945,44.280667,44.280763,44.27994,44.278799,44.275533,44.270978,44.269383,44.260311,44.258234,44.249885,44.2476774328148,44.24401,44.237244,44.230874,44.229076,44.22883,44.2296393340327,44.229742,44.232005,44.242775,44.246805,44.248635,44.248881,44.248505,44.246063,44.245391,44.2453906695423,44.2453881986673,44.2453868423874,44.245386,44.245477,44.2447059354583,44.2442656367649,44.244209072634,44.2434839480557,44.242844,44.23998,44.2380420862255,44.235677,44.2349306846191,44.232836,44.229821,44.225932,44.221221,44.217493,44.2132,44.208017,44.197256,44.194581,44.194126,44.191571735564,44.191264,44.191677,44.19371,44.1937712439328,44.193962,44.191544,44.18844,44.183152,44.179467,44.176851,44.171267,44.1664463691315,44.160191,44.158114,44.154295,44.1526558411174,44.150099,44.14862,44.145931,44.144422,44.139992,44.132929,44.128381,44.127304,44.125462976158,44.123278,44.118929,44.113972,44.112621,44.109438,44.107326,44.100039,44.0970063481431,44.096943,44.0957616644886,44.0956152473123,44.09406,44.091743,44.090936,44.088295,44.085364,44.081832,44.0589530528064,44.053663,44.049425,44.048771,44.0486051115188,44.042888,44.0426043694783,44.0425778402732,44.0396994290017,44.035645,44.029376,44.0291467346366,44.0246946460507,44.0243980062902,44.0219173103878,44.021249,44.012652,44.007431,44.0069165870337,44.003189,44.0016934551559,43.999437,43.990875,43.986874,43.98459,43.984043,43.982925,43.977477,43.977085,43.974719,43.973091,43.972187,43.970112,43.968302,43.968412,43.968884,43.968168,43.96636,43.963815,43.959764,43.958357,43.956964,43.956301,43.956,43.954564,43.952149,43.948097,43.944286,43.941881,43.939921,43.9377512350526,43.937007,43.934792,43.932797,43.93065,43.927739,43.923246,43.91748,43.916453,43.915253,43.912478,43.9094192775191,43.908888,43.9072537431298,43.905812,43.901293,43.900361,43.897128,43.894759,43.8946464890304,43.880846,43.8801032140428,43.8770578606079,43.871228,43.86884,43.86771,43.866794,43.863864,43.864637,43.8626893878893,43.862269,43.858956,43.8563729196878,43.856182,43.853833,43.852172,43.849754,43.844803,43.840001,43.839962,43.841694,43.841334,43.834156,43.830025,43.826286,43.823811,43.819402,43.8173218792265,43.813842,43.8122882404094,43.80811,43.733935,43.732905,43.714815,43.706193,43.6937391205206,43.683001,43.6808035152354,43.675523,43.664385,43.631659,43.62488,43.621032,43.617614,43.610669,43.601912,43.600357,43.596033,43.593632,43.578674,43.577526,43.5737089790098,43.5647210211312,43.5457346710279,43.420805024449,43.3152915591549,43.025128,43.024876,42.807447,42.80717,42.807015,42.624878,42.5522229216117,42.4304607260049,42.378557,42.357193,42.166404,42.133258,42.117647,41.99989,41.99989,41.998983,41.99989,42.000035,42.00038,41.999887,41.99929,41.999659,41.9992392555284,41.9990841067272,41.9985364286855,41.9985101685311,41.998467,41.998102,41.9981771341869,41.9982072706744,41.998335,41.9972981831054,41.996995,41.9969940811635,42.135279,42.275813,42.275891,42.805902,42.914703,42.914625,43.042817,43.086086,43.096791,43.348964,43.348959,43.43565,43.436775,43.612266,43.779216,43.779207,43.779195,44.039862,44.183239,44.21255,44.212548,44.256129]}]],[[{"lng":[-118.51944,-118.518181,-118.516539,-118.513679,-118.509705,-118.507765,-118.505765,-118.501794,-118.499774,-118.498457,-118.498373,-118.498161,-118.497865,-118.497422,-118.496787,-118.496583,-118.496169,-118.495729,-118.495257,-118.492404,-118.491292,-118.488174,-118.483704,-118.480904,-118.476922,-118.473427,-118.470581,-118.468284,-118.464244,-118.461528,-118.460802,-118.461866,-118.460487,-118.459157,-118.45227,-118.445862,-118.443456,-118.440003,-118.437712,-118.435673,-118.433707,-118.432064,-118.43182,-118.425086,-118.422747,-118.419381,-118.419907,-118.418247,-118.418867,-118.417419,-118.413647,-118.403611,-118.40025,-118.395839,-118.393659,-118.394052,-118.391656,-118.391704,-118.387177,-118.387277,-118.385176,-118.383321,-118.383411,-118.381491,-118.379786,-118.376666,-118.372775,-118.367621,-118.365587,-118.361673,-118.358121,-118.35243,-118.350798,-118.346502,-118.343374,-118.339207,-118.336355,-118.332304,-118.329785,-118.325783,-118.321741,-118.319306,-118.316347,-118.311639,-118.306628,-118.305462,-118.302565,-118.300094,-118.29877,-118.296443,-118.294194,-118.292079,-118.289862,-118.285439,-118.286743,-118.286281,-118.286739,-118.288299,-118.289351,-118.28984,-118.287422,-118.286294,-118.28311,-118.283385,-118.284994,-118.290151,-118.292122,-118.294094,-118.294019,-118.293393,-118.294383,-118.299459,-118.298355,-118.296578,-118.2978,-118.298077,-118.296548,-118.294827,-118.295068,-118.296269,-118.300975,-118.303366,-118.304572,-118.307522,-118.307233,-118.308837,-118.311173,-118.310056,-118.30847,-118.308421,-118.313907,-118.317934,-118.3187,-118.314454,-118.312281,-118.309246,-118.306817,-118.306764,-118.302862,-118.29906,-118.293566,-118.294909,-118.294716,-118.296234,-118.295659,-118.289794,-118.2872,-118.283489,-118.279179,-118.2759,-118.267786,-118.264012,-118.261829,-118.258237,-118.253802,-118.246533,-118.242499,-118.24055,-118.236861,-118.23518,-118.228076,-118.227459,-118.22816,-118.228056,-118.224904,-118.226627,-118.229972,-118.230979,-118.232402,-118.231462,-118.235329,-118.236369,-118.235589,-118.235656,-118.234808,-118.236831,-118.237399,-118.235115,-118.232795,-118.229421,-118.227791,-118.231634,-118.232128,-118.231337,-118.22828,-118.226561,-118.226727,-118.225709,-118.223449,-118.226449,-118.227547,-118.229663,-118.233636,-118.23623,-118.237322,-118.24161,-118.244382,-118.245043,-118.24364,-118.244533,-118.243553,-118.244662,-118.245136,-118.232197,-118.232165,-118.232658,-118.231806,-118.229691,-118.228047,-118.227421,-118.225462,-118.223739,-118.223192,-118.220371,-118.220763,-118.219197,-118.217081,-118.213869,-118.213634,-118.214731,-118.212772,-118.213478,-118.213556,-118.212459,-118.21246,-118.214497,-118.214184,-118.211519,-118.209168,-118.206973,-118.203838,-118.201486,-118.200232,-118.197174,-118.194901,-118.192549,-118.184709,-118.178908,-118.17687,-118.175223,-118.172167,-118.169815,-118.166758,-118.164484,-118.161036,-118.156488,-118.155076,-118.15578,-118.154916,-118.148405,-118.142367,-118.140876,-118.140482,-118.141185,-118.139929,-118.138203,-118.137729,-118.136551,-118.130351,-118.128407,-118.126328,-118.11925,-118.115495,-118.110422,-118.108962,-118.10804,-118.102659,-118.100661,-118.098817,-118.096972,-118.094052,-118.09213,-118.091286,-118.089673,-118.088982,-118.086523,-118.080456,-118.077997,-118.074772,-118.0717,-118.06955,-118.064404,-118.063637,-118.060105,-118.057584,-118.051814,-118.046279,-118.044232,-118.041949,-118.037125,-118.032237,-118.028283,-118.022745,-118.016228,-118.009949,-118.007344,-118.006843,-118.00333,-118.000318,-117.998992,-117.993112,-117.990182,-117.985755,-117.982631,-117.977728,-117.975378,-117.97216,-117.968688,-117.965211,-117.958124,-117.956183,-117.952633,-117.950925,-117.9477,-117.946243,-117.944977,-117.942835,-117.940522,-117.937296,-117.93636,-117.933931,-117.931873,-117.928321,-117.92723,-117.925714,-117.921696,-117.922093,-117.920378,-117.918603,-117.917634,-117.917055,-117.915266,-117.914198,-117.913393,-117.912473,-117.911901,-117.906142,-117.903603,-117.901443,-117.900497,-117.896386,-117.897252,-117.894074,-117.894708,-117.890515,-117.890152,-117.886506,-117.885732,-117.888408,-117.885361,-117.88527,-117.884041,-117.881163,-117.873396,-117.873734,-117.871887,-117.870438,-117.868648,-117.862058,-117.859832,-117.858127,-117.853788,-117.850462,-117.850204,-117.84343,-117.842069,-117.84433,-117.844909,-117.841727,-117.83989,-117.83775,-117.837244,-117.840601,-117.840934,-117.838224,-117.834022,-117.828819,-117.827377,-117.827784,-117.818062,-117.814507,-117.81202,-117.810347,-117.810499,-117.812384,-117.810901,-117.813232,-117.812501,-117.809642,-117.807106,-117.805679,-117.80439,-117.803943,-117.805343,-117.803614,-117.802486,-117.804671,-117.803038,-117.801591,-117.799102,-117.798106,-117.799062,-117.797076,-117.796519,-117.795212,-117.793418,-117.794612,-117.797179,-117.795811,-117.793905,-117.793626,-117.795624,-117.794825,-117.795976,-117.793112,-117.794182,-117.791738,-117.790617,-117.786109,-117.784715,-117.781825,-117.77942,-117.778664,-117.778261,-117.780449,-117.784287,-117.784223,-117.784917,-117.78438,-117.779549,-117.777504,-117.747664,-117.564033,-117.563402,-117.563486,-117.381873,-117.379472,-117.368183,-117.313239,-117.266005,-117.091719,-117.022673,-117.022673,-116.783771926572,-116.78371,-116.797329,-116.808576,-116.814589,-116.826133,-116.842731,-116.847944,-116.845847,-116.844796,-116.844625,-116.846103,-116.856754,-116.858313,-116.856964,-116.85226,-116.848093,-116.844323,-116.841971,-116.839031,-116.834915,-116.830505,-116.826271,-116.829329,-116.836449,-116.847888,-116.850737,-116.846461,-116.835702,-116.832176,-116.833632,-116.838467,-116.842108,-116.846061,-116.850512,-116.852427,-116.857038,-116.865338,-116.871701,-116.876001,-116.878183,-116.879375,-116.883598,-116.887748,-116.889882,-116.892361,-116.895805,-116.898153,-116.898609,-116.896424,-116.896249,-116.898388,-116.899640878328,-116.900069,-116.900146,-116.901051,-116.905771,-116.920498,-116.928099,-116.931099,-116.933699,-116.933799,-116.933099,-116.9308,-116.9307,-116.9318,-116.9347,-116.9368,-116.949001,-116.966801,-116.970902,-116.972902,-116.977802,-116.986502,-116.992003,-116.998903,-117.006045,-117.013802,-117.016216,-117.018418,-117.021398,-117.02942,-117.031738,-117.03827,-117.039549,-117.044217,-117.046250547549,-117.04782,-117.048178,-117.050495,-117.05856,-117.062273,-117.060454,-117.061799,-117.063824,-117.072221,-117.074137,-117.07912,-117.07871,-117.079483004572,-117.080555,-117.080772,-117.079835603761,-117.078574,-117.079031,-117.081022,-117.081286739531,-117.086075,-117.091223,-117.095868,-117.096791,-117.094968,-117.098221,-117.108231,-117.114754,-117.117809,-117.120522,-117.125267,-117.124754,-117.126009,-117.133963,-117.138066,-117.14248,-117.146032,-117.148255,-117.147934,-117.14293,-117.144161,-117.149242,-117.152406,-117.161033,-117.167187,-117.181583,-117.185386,-117.189759,-117.19163,-117.191329,-117.192494,-117.194317,-117.200237,-117.208936,-117.211148,-117.216372,-117.221479026379,-117.224104,-117.225076,-117.225932,-117.225758,-117.224445,-117.221548,-117.217015,-117.215573,-117.214637,-117.215072,-117.218285,-117.225461,-117.22698,-117.234835,-117.242675,-117.243027,-117.235117,-117.227938,-117.216911,-117.210587,-117.206962,-117.197339,-117.196149,-117.189769,-117.189842,-117.191546,-117.192203,-117.203323,-117.2055,-117.21521,-117.216795,-117.217843,-117.220060553639,-117.30419,-117.405264,-117.487014,-117.486744,-117.509214,-117.509202,-117.529408,-117.52936,-117.569664,-117.56962,-117.590858,-117.590849,-117.608707,-117.631491,-117.749535,-117.851163,-117.87228,-117.971787,-117.971947,-118.011402,-118.011485,-118.031671,-118.031808,-118.051956,-118.051902,-118.071916,-118.071877,-118.087016,-118.087036,-118.092087,-118.092122,-118.112068,-118.112092,-118.132347,-118.132141,-118.152456,-118.152945,-118.193405,-118.193345,-118.232214,-118.23217,-118.354122,-118.354145,-118.447185,-118.497499,-118.49732,-118.500117,-118.498411,-118.497321,-118.496152,-118.49507,-118.490468,-118.488681,-118.486512,-118.484647,-118.482345,-118.481412,-118.48124,-118.478727,-118.478595,-118.474848,-118.47266,-118.467883,-118.469096,-118.46887,-118.461061,-118.458579,-118.457563,-118.456729,-118.452455,-118.447799,-118.440356,-118.436986,-118.43437,-118.435357,-118.433621,-118.432384,-118.433579,-118.433813,-118.432812,-118.430374,-118.420455,-118.413314,-118.410955,-118.407612,-118.40889,-118.409774,-118.413703,-118.417555,-118.421329,-118.422586,-118.424394,-118.428326,-118.428483,-118.427067,-118.425493,-118.431707,-118.43501,-118.434932,-118.435954,-118.434853,-118.434066,-118.431147,-118.430919,-118.428322,-118.429108,-118.42895,-118.422418,-118.422102,-118.423597,-118.420684,-118.418457,-118.420366,-118.420601,-118.421545,-118.422173,-118.421542,-118.420911,-118.419336,-118.418155,-118.41351,-118.411069,-118.408786,-118.405392,-118.402845,-118.398703,-118.394593,-118.39201,-118.388293,-118.386097,-118.383108,-118.380034,-118.378302,-118.376741,-118.375367,-118.372852,-118.36939,-118.367973,-118.36514,-118.360732,-118.36231,-118.36365,-118.367042,-118.362312,-118.357986,-118.360667,-118.363427,-118.365086,-118.364615,-118.366115,-118.367772,-118.370202,-118.372863,-118.373195,-118.374563,-118.373523,-118.374509,-118.374236,-118.371346,-118.368806,-118.371036,-118.370803,-118.372225,-118.37153,-118.369628,-118.365535,-118.364066,-118.359224,-118.358417,-118.356315,-118.354205,-118.354821,-118.352379,-118.351025,-118.349305,-118.346739,-118.347966,-118.347614,-118.346234,-118.346866,-118.345607,-118.343872,-118.343274,-118.337886,-118.337408,-118.334252,-118.332254,-118.328495,-118.327739,-118.32617,-118.323526,-118.322737,-118.31982,-118.317296,-118.31769,-118.315482,-118.316873,-118.314069,-118.315622,-118.310984,-118.311222,-118.308934,-118.306961,-118.305777,-118.305778,-118.309328,-118.311696,-118.311853,-118.309704,-118.312564,-118.314537,-118.316589,-118.319431,-118.329297,-118.333246,-118.336404,-118.337588,-118.338852,-118.338063,-118.341934,-118.342567,-118.341699,-118.341779,-118.344374,-118.342194,-118.342172,-118.343208,-118.343684,-118.353557,-118.354824,-118.355851,-118.360273,-118.362249,-118.36454,-118.368572,-118.3711,-118.372365,-118.375037,-118.377906,-118.379855,-118.386038,-118.38634,-118.388087,-118.391024,-118.393181,-118.399942,-118.402581,-118.403639,-118.404947,-118.410214,-118.41088,-118.412928,-118.414113,-118.417036,-118.41909,-118.422329,-118.425197,-118.429638,-118.432342,-118.433626,-118.436806,-118.438184,-118.441788,-118.446702,-118.451401,-118.453139,-118.456063,-118.460962,-118.463113,-118.472734,-118.473527,-118.47732,-118.48214,-118.485639,-118.488713,-118.493278,-118.497947,-118.500889,-118.504435,-118.504437,-118.507257,-118.507077,-118.50892,-118.510957,-118.511088,-118.512691,-118.513986,-118.517591,-118.518688,-118.51765,-118.51749,-118.516452,-118.519174,-118.51944],"lat":[44.705886,44.706081,44.704765,44.7061,44.706237,44.708903,44.709331,44.708664,44.709055,44.710619,44.710678,44.710958,44.711163,44.711339,44.711606,44.711729,44.712027,44.712425,44.712865,44.713621,44.712393,44.710944,44.71003,44.710035,44.709199,44.705289,44.704,44.705666,44.706374,44.707521,44.708948,44.710861,44.712657,44.715774,44.719166,44.723436,44.724173,44.722886,44.721547,44.721555,44.720729,44.721091,44.719766,44.718554,44.719488,44.718693,44.721846,44.722776,44.724884,44.726986,44.727122,44.724808,44.72647,44.726005,44.727872,44.728998,44.731398,44.734328,44.735949,44.737389,44.739093,44.738868,44.740717,44.742041,44.744357,44.745249,44.745628,44.747213,44.747126,44.745474,44.745573,44.744738,44.743996,44.743912,44.744444,44.743944,44.742609,44.742467,44.74358,44.74162,44.74151,44.742082,44.743986,44.744241,44.74528,44.746949,44.747643,44.746025,44.746248,44.74698,44.746564,44.747389,44.749868,44.750975,44.754323,44.757123,44.759278,44.762708,44.763371,44.765439,44.767165,44.767331,44.77072,44.772211,44.773003,44.77925,44.780412,44.784664,44.787259,44.787936,44.790167,44.796442,44.798705,44.799211,44.800259,44.802979,44.807807,44.809344,44.813191,44.816164,44.816426,44.81733,44.818712,44.819407,44.821148,44.821229,44.823236,44.824802,44.828794,44.830613,44.832422,44.834937,44.836274,44.838066,44.840039,44.841107,44.843855,44.846614,44.848153,44.850451,44.853018,44.856606,44.859376,44.862086,44.863043,44.866421,44.865367,44.865007,44.866271,44.866573,44.869386,44.866412,44.866013,44.863351,44.864851,44.864071,44.863165,44.862344,44.86166,44.862587,44.865544,44.867783,44.870332,44.872332,44.875568,44.878634,44.882349,44.887149,44.891028,44.894063,44.897046,44.898643,44.901367,44.902902,44.904173,44.906927,44.908385,44.91053,44.911514,44.913854,44.918361,44.921531,44.923482,44.924687,44.926032,44.930012,44.931409,44.933778,44.93691,44.939575,44.939778,44.941695,44.940104,44.941213,44.942695,44.943198,44.94431,44.945198,44.950096,44.951086,44.956525,44.958396,44.960686,44.960686,44.963285,44.966976,44.969921,44.97237,44.973481,44.976652,44.977488,44.979158,44.981549,44.983722,44.984888,44.987447,44.988505,44.989174,44.990567,44.991343,44.995073,44.996519,44.999353,45.00108,45.005306,45.006585,45.007421,45.008201,45.010094,45.010203,45.01232,45.013155,45.015104,45.015325,45.017329,45.017997,45.019389,45.017995,45.019389,45.019388,45.017105,45.017161,45.016103,45.016657,45.015711,45.017883,45.018775,45.020442,45.022278,45.026728,45.027725,45.02945,45.031677,45.033844,45.035513,45.036458,45.040018,45.040799,45.045024,45.045214,45.044444,45.044761,45.045162,45.046962,45.046801,45.046198,45.045602,45.044347,45.044892,45.04233,45.042327,45.041238,45.038568,45.036878,45.033716,45.032029,45.025648,45.024723,45.021068,45.019598,45.016873,45.015179,45.014088,45.012924,45.012569,45.012785,45.00991,45.006868,45.006961,45.004007,45.003881,45.003403,45.001635,45.000595,44.997644,44.997415,44.996376,44.99484,44.994876,44.994348,44.994448,44.99525,44.99459,44.995409,44.994951,44.995873,44.99617,44.995908,44.997626,45.000621,45.000952,45.002967,45.004881,45.006582,45.006698,45.006667,45.008418,45.009324,45.012767,45.0125,45.014081,45.013626,45.015197,45.016787,45.016939,45.019079,45.020889,45.023006,45.024485,45.024736,45.025357,45.026033,45.026847,45.027236,45.028207,45.028008,45.030232,45.033156,45.034604,45.036321,45.037917,45.039581,45.043706,45.04524,45.047569,45.048706,45.049436,45.051089,45.0571,45.056709,45.058249,45.060095,45.059622,45.060713,45.065639,45.064703,45.060146,45.05758,45.054525,45.055712,45.059753,45.060443,45.060351,45.059736,45.058477,45.057026,45.056057,45.054797,45.054096,45.055136,45.055138,45.052819,45.051643,45.050658,45.04804,45.042113,45.037596,45.035472,45.033314,45.025909,45.024491,45.024511,45.025607,45.026711,45.027532,45.028808,45.030655,45.032274,45.032445,45.031655,45.032832,45.032625,45.031851,45.029481,45.030495,45.029705,45.028184,45.02718,45.02915,45.029284,45.028164,45.026766,45.026679,45.025335,45.026273,45.025795,45.023959,45.023925,45.02278,45.023142,45.022058,45.021648,45.020454,45.018489,45.018583,45.016682,45.016317,45.014854,45.013987,45.014289,45.013583,45.01143,45.009631,45.007621,45.005572,45.003714,44.999668,44.998322,44.995675,44.995244,44.992161,44.992426,44.992866,45.036118,45.079446,45.079997,45.079993,45.080569,45.080581,45.08057,45.080158,45.079734,45.079167,45.078265731912,45.076972,45.060267,45.050652,45.048106,45.037285,45.029446,45.022602,45.01847,45.015312,45.001435,44.999878,44.984298,44.978761,44.975173,44.972527,44.971906,44.974879,44.980758,44.983992,44.985756,44.98458,44.982493,44.975173,44.969239,44.964768,44.958113,44.951521,44.940633,44.931373,44.928976,44.923601,44.914922,44.905249,44.893523,44.887577,44.880769,44.870599,44.867613,44.866684,44.864706,44.861793,44.858268,44.855799,44.855171,44.855218,44.855752,44.854319,44.851985,44.849733,44.84833,44.84228,44.8406075080495,44.840036,44.836672,44.83568,44.834794,44.81438,44.808381,44.804781,44.798781,44.796781,44.794481,44.790981,44.789881,44.787181,44.783881,44.782881,44.777981,44.775181,44.773881,44.772581,44.767981,44.762381,44.759182,44.756382,44.756024,44.756841,44.755572,44.751942,44.750785,44.751102,44.74986,44.748179,44.746483,44.74514,44.7431132252987,44.741549,44.735916,44.732477,44.730265,44.727143,44.721668,44.706654,44.703623,44.700517,44.696374,44.692175,44.690084,44.6886720621095,44.686714,44.684161,44.6825280578776,44.680328,44.677676,44.673685,44.6735859256969,44.671794,44.668807,44.664737,44.657385,44.652011,44.640689,44.62711,44.624883,44.620139,44.614658,44.593818,44.583834,44.581553,44.57524,44.572996,44.57143,44.568603,44.564371,44.562143,44.557236,44.545647,44.536151,44.531802,44.525166,44.523431,44.52296,44.519261,44.513385,44.509886,44.506784,44.503272,44.499884,44.492027,44.485661,44.485359,44.48616,44.4845576143306,44.483734,44.482346,44.479389,44.477223,44.473884,44.470146,44.459042,44.453746,44.44803,44.427162,44.420664,44.407729,44.405583,44.399669,44.396548,44.390974,44.373853,44.367975,44.360163,44.357703,44.355206,44.347406,44.346362,44.336585,44.335007,44.329621,44.32863,44.313024,44.311789,44.309116,44.308236,44.30718,44.3014040000001,44.301462,44.301044,44.300317,44.387246,44.387143,44.401461,44.401329,44.415722,44.415678,44.430062,44.43013,44.444573,44.444661,44.444427,44.444136,44.444045,44.443511,44.443849,44.429296,44.429615,44.415169,44.415192,44.389953,44.390032,44.372004,44.372009,44.357562,44.357646,44.343184,44.343208,44.328734,44.328754,44.314271,44.31431,44.299483,44.299509,44.270684,44.270708,44.2562,44.256129,44.257343,44.256824,44.255384,44.255211,44.255248,44.277036,44.277057,44.278536,44.28383,44.287046,44.288546,44.289246,44.294188,44.297932,44.302617,44.304536,44.306626,44.309518,44.313051,44.315917,44.318331,44.319045,44.322048,44.325517,44.334584,44.336551,44.340343,44.344848,44.346428,44.349406,44.350716,44.350936,44.352126,44.353977,44.356125,44.359247,44.362848,44.364889,44.368133,44.36914,44.369882,44.371744,44.373543,44.373036,44.370845,44.372909,44.378619,44.380988,44.383807,44.385782,44.388993,44.391195,44.394126,44.394828,44.397454,44.398748,44.39858,44.397508,44.399426,44.401907,44.403825,44.407153,44.4088,44.40997,44.411717,44.414309,44.416737,44.421752,44.423503,44.426207,44.428179,44.432468,44.438442,44.443008,44.444531,44.448984,44.453439,44.455072,44.456766,44.455921,44.454282,44.452872,44.452648,44.454457,44.456458,44.457777,44.457882,44.456869,44.458337,44.458504,44.45974,44.462276,44.461433,44.45958,44.459231,44.462786,44.466172,44.466621,44.469162,44.471699,44.474066,44.474856,44.478912,44.480101,44.484385,44.485906,44.488219,44.491714,44.493629,44.496334,44.498025,44.502494,44.50479,44.506397,44.507891,44.509207,44.512089,44.514035,44.519056,44.521255,44.523791,44.526215,44.528638,44.531191,44.53281,44.538112,44.537216,44.536041,44.539108,44.541274,44.542545,44.545392,44.54759,44.548037,44.548608,44.550466,44.551086,44.553654,44.554977,44.556217,44.559716,44.560056,44.562544,44.567029,44.565182,44.564453,44.565112,44.563778,44.562207,44.56119,44.562368,44.564173,44.566543,44.567896,44.569192,44.570658,44.572539,44.575043,44.577082,44.581034,44.582581,44.585317,44.58605,44.587851,44.58881,44.589939,44.591181,44.592251,44.595679,44.597549,44.601609,44.603863,44.605442,44.608771,44.608374,44.610007,44.609502,44.61098,44.61249,44.616775,44.617901,44.618969,44.621341,44.625024,44.626656,44.628403,44.631204,44.631821,44.635601,44.639263,44.639377,44.637965,44.639769,44.639823,44.643038,44.643484,44.645121,44.646102,44.645905,44.64645,44.644419,44.642928,44.641555,44.643001,44.642871,44.643539,44.643381,44.641388,44.641444,44.643025,44.644169,44.644739,44.646543,44.647164,44.648687,44.652801,44.654828,44.653966,44.652595,44.652691,44.654376,44.653206,44.652451,44.650017,44.652859,44.653084,44.655396,44.656297,44.65559,44.656632,44.658729,44.66142,44.661871,44.663639,44.664484,44.663566,44.665698,44.665925,44.665556,44.669929,44.67433,44.675417,44.677878,44.679134,44.681049,44.684021,44.688532,44.690074,44.691562,44.692755,44.695931,44.702462,44.704031,44.705886]}]],[[{"lng":[-120.6535343441,-120.634968,-120.591166,-120.559465,-120.553317424253,-120.521964,-120.505863,-120.482362,-120.45309661514,-120.40396,-120.329057,-120.288656,-120.282156,-120.211474211014,-120.210754,-120.191103256744,-120.170453,-120.141352,-120.07015,-120.0550751063,-120.001148,-119.999501176112,-119.998161,-119.998172,-119.999242,-120.004783,-120.004859,-120.004752,-120.005124,-120.005565,-120.006555,-119.897751,-119.882346,-119.882356,-119.883914,-119.759759,-119.760731,-119.790831,-119.790699,-119.850941,-119.876525,-119.910536,-119.91054,-120.000045,-120.005372,-120.028785,-120.086479,-120.128661,-120.131926,-120.309328,-120.49516,-120.495748,-120.494548,-120.503733,-120.504449,-120.508549,-120.512249,-120.51485,-120.51005,-120.506864,-120.50345,-120.50115,-120.498149,-120.494749,-120.491949,-120.486949,-120.482849,-120.479249,-120.476849,-120.470649,-120.468849,-120.468449,-120.467448,-120.464548,-120.462548,-120.463648,-120.463448,-120.461249,-120.460549,-120.461049,-120.458449,-120.458449,-120.460249,-120.463787,-120.465706,-120.46215,-120.46045,-120.45865,-120.45505,-120.453041,-120.450097,-120.44886,-120.45225,-120.457069,-120.46295,-120.464991,-120.466995,-120.475351,-120.476251,-120.476751,-120.476251,-120.474951,-120.471551,-120.468951,-120.468551,-120.469549,-120.472951,-120.476852,-120.480252,-120.483552,-120.484052,-120.482552,-120.480152,-120.476752,-120.473652,-120.472652,-120.474752,-120.480152,-120.483352,-120.485552,-120.487653,-120.487153,-120.482353,-120.481153,-120.480953,-120.481653,-120.484853,-120.48849,-120.493553,-120.497954,-120.502854,-120.506254,-120.509454,-120.516054,-120.519354,-120.521254,-120.520455,-120.521555,-120.524155,-120.529055,-120.531655,-120.532555,-120.534055,-120.536755,-120.540955,-120.541755,-120.543008,-120.542856,-120.540256,-120.537556,-120.533055,-120.529355,-120.527555,-120.524455,-120.523855,-120.524455,-120.525956,-120.528456,-120.530056,-120.534156,-120.540056,-120.541956,-120.544856,-120.545356,-120.543656,-120.541656,-120.542956,-120.544157,-120.546457,-120.550357,-120.551139,-120.550663,-120.552057,-120.556057,-120.554457,-120.550957,-120.542857,-120.540657,-120.535757,-120.534457,-120.533657,-120.535957,-120.538157,-120.541657,-120.544657,-120.547057,-120.546358,-120.545158,-120.541857,-120.540289,-120.540257,-120.541758,-120.542858,-120.547858,-120.549158,-120.553158,-120.555558,-120.553358,-120.547358,-120.544858,-120.543158,-120.542758,-120.544258,-120.546658,-120.547758,-120.548158,-120.545458,-120.542258,-120.540358,-120.538558,-120.537758,-120.536858,-120.534658,-120.531558,-120.527757,-120.524457,-120.524057,-120.524658,-120.525558,-120.531858,-120.538858,-120.540758,-120.540458,-120.538758,-120.530358,-120.527458,-120.528058,-120.527358,-120.529458,-120.535158,-120.539358,-120.541258,-120.539658,-120.534358,-120.531958,-120.530958,-120.530758,-120.531258,-120.530458,-120.531258,-120.532458,-120.533958,-120.541459,-120.543359,-120.543059,-120.540159,-120.535559,-120.533659,-120.533659,-120.530659,-120.531859,-120.534659,-120.534459,-120.532059,-120.527059,-120.524459,-120.523459,-120.524059,-120.521859,-120.516659,-120.514958,-120.513158,-120.512558,-120.513358,-120.515159,-120.522659,-120.529759,-120.532559,-120.532059,-120.530159,-120.528159,-120.525259,-120.523059,-120.518459,-120.519359,-120.528659,-120.527559,-120.525059,-120.519859,-120.514759,-120.509659,-120.507959,-120.506259,-120.502659,-120.501159,-120.498759,-120.495759,-120.492258,-120.489258,-120.484258,-120.482958,-120.484158,-120.489058,-120.494059,-120.502959,-120.506059,-120.506459,-120.505859,-120.501859,-120.501159,-120.493959,-120.492259,-120.486758,-120.483658,-120.482941,-120.484435,-120.487859,-120.492159,-120.496059,-120.496859,-120.495159,-120.493659,-120.489859,-120.483459,-120.481559,-120.482359,-120.486359,-120.489859,-120.491759,-120.493459,-120.495859,-120.490359,-120.483859,-120.481228,-120.477559,-120.472759,-120.46966,-120.462291,-120.459937,-120.45441,-120.449907,-120.446592,-120.441284,-120.438779,-120.43323,-120.429082,-120.422903,-120.421449,-120.416409,-120.409948,-120.407022,-120.407256,-120.411057,-120.412857,-120.417857,-120.420557,-120.423257,-120.424257,-120.423357,-120.426057,-120.426856,-120.422581,-120.414957,-120.409557,-120.405557,-120.399056,-120.394456,-120.386686,-120.382056,-120.377756,-120.373427,-120.367855,-120.365655,-120.364955,-120.363246,-120.360827,-120.359976,-120.360771,-120.364122,-120.365217,-120.367013,-120.370994,-120.376304,-120.377837,-120.379469,-120.380493,-120.380486,-120.376156,-120.375793,-120.372139,-120.369313,-120.365401,-120.359512,-120.357804,-120.35798,-120.359875,-120.365267,-120.372265,-120.377466,-120.381856,-120.384579,-120.385845,-120.386122,-120.388305,-120.390763,-120.392574,-120.401323,-120.402107,-120.405673,-120.407038,-120.407663,-120.407117,-120.404832,-120.402578,-120.402654,-120.404938,-120.40536,-120.408536,-120.409128,-120.408982,-120.409413,-120.410742,-120.411699,-120.416052,-120.421999,-120.426305,-120.428135,-120.432693,-120.438889,-120.444248,-120.446592,-120.446258,-120.444612,-120.439925,-120.438299,-120.440538,-120.44422,-120.449588,-120.452159,-120.453915,-120.45746,-120.459735,-120.464725,-120.46795,-120.46897,-120.47018,-120.469915,-120.472696,-120.477475,-120.478087,-120.477833,-120.479303,-120.481042,-120.484741,-120.486421,-120.485326,-120.482367,-120.480276,-120.479181,-120.47836,-120.478341,-120.479474,-120.479903,-120.48231,-120.48244,-120.485156,-120.489585,-120.491732,-120.492223,-120.492223,-120.489739,-120.488689,-120.488779,-120.490833,-120.493853,-120.496624,-120.498461,-120.499805,-120.506384,-120.508107,-120.510188,-120.513313,-120.515688,-120.517573,-120.520924,-120.524742,-120.528516,-120.531013,-120.535308,-120.539245,-120.544783,-120.547364,-120.549064,-120.551164,-120.552064,-120.553064,-120.556464,-120.558264,-120.560065,-120.566965,-120.567465,-120.569465,-120.572265,-120.574265,-120.577565,-120.583366,-120.587066,-120.593766,-120.600466,-120.602466,-120.603766,-120.603466,-120.604867,-120.606167,-120.609967,-120.612267,-120.618567,-120.624467,-120.629067,-120.631668,-120.635868,-120.638568,-120.640368,-120.643668,-120.646068,-120.646168,-120.649368,-120.649368,-120.6535343441],"lat":[45.7372486812962,45.745847,45.746547,45.738348,45.7336759670199,45.709848,45.700048,45.694449,45.6962407125498,45.699249,45.71105,45.72015,45.72125,45.725903582393,45.725951,45.7435045782538,45.761951,45.773152,45.785152,45.7909960828741,45.811902,45.8124817188485,45.687968,45.68439,45.517539,45.517157,45.502468,45.501959,45.385771,45.350553,45.257706,45.257017,45.256916,45.25596,45.169152,45.169211,45.081278,45.081253,45.067823,45.067783,45.067866,45.067928,45.066927,45.065591,45.065582,45.065224,45.065398,45.065453,45.067354,45.06779,45.068279,45.07005,45.07465,45.083477,45.08565,45.08725,45.09095,45.09465,45.10135,45.102778,45.10265,45.1041,45.10455,45.10575,45.10585,45.10435,45.10505,45.11015,45.11165,45.10855,45.10695,45.10285,45.10155,45.10015,45.10115,45.10375,45.10515,45.10865,45.11165,45.11625,45.11945,45.12065,45.12315,45.125985,45.130127,45.13505,45.13795,45.13885,45.13945,45.139253,45.140883,45.143185,45.14545,45.145483,45.14405,45.144196,45.146686,45.15105,45.15185,45.15415,45.15645,45.15775,45.15955,45.16215,45.16355,45.16494,45.16595,45.16835,45.16895,45.17025,45.17155,45.17235,45.17235,45.17325,45.17565,45.17765,45.17975,45.18015,45.17945,45.17955,45.18075,45.18365,45.18665,45.18895,45.19125,45.19335,45.19485,45.197233,45.19765,45.19575,45.19555,45.19615,45.19785,45.19925,45.20105,45.20265,45.20445,45.20535,45.20445,45.20475,45.20605,45.21065,45.21125,45.21115,45.209949,45.210349,45.212507,45.213649,45.217049,45.21785,45.21665,45.21635,45.21675,45.21885,45.22035,45.22255,45.22385,45.22465,45.22465,45.22325,45.219849,45.220249,45.222449,45.223949,45.228449,45.231949,45.235149,45.236649,45.237249,45.240849,45.242426,45.244146,45.246649,45.250449,45.252749,45.253349,45.253849,45.253255,45.25495,45.25585,45.25905,45.26185,45.262449,45.261649,45.261649,45.262949,45.267249,45.269049,45.271849,45.274864,45.276049,45.279049,45.279649,45.281049,45.281049,45.279649,45.281249,45.283249,45.284449,45.284449,45.285649,45.288049,45.291449,45.295549,45.296449,45.298349,45.302549,45.304549,45.304349,45.302749,45.297849,45.296349,45.295049,45.294749,45.295949,45.29915,45.30015,45.304049,45.305749,45.309049,45.309749,45.311549,45.314749,45.315849,45.317549,45.319149,45.320949,45.324249,45.328149,45.328449,45.327749,45.329349,45.330649,45.331449,45.331449,45.332249,45.335149,45.336549,45.339249,45.342049,45.343649,45.344149,45.345249,45.346049,45.347649,45.349949,45.351749,45.352949,45.358149,45.363849,45.366149,45.368449,45.370249,45.371249,45.371849,45.372549,45.373549,45.376849,45.377849,45.375749,45.375649,45.376849,45.378649,45.380649,45.381149,45.381849,45.380449,45.381549,45.383249,45.385449,45.386549,45.387249,45.388849,45.394649,45.396349,45.400349,45.403449,45.405249,45.405449,45.404349,45.405049,45.405749,45.407749,45.417249,45.418749,45.419049,45.418649,45.417349,45.416849,45.419249,45.420549,45.422849,45.426949,45.428249,45.427949,45.428249,45.430649,45.431749,45.433249,45.433999,45.434549,45.434249,45.434349,45.435549,45.438548,45.440716,45.442549,45.443649,45.444049,45.446949,45.450549,45.451849,45.453649,45.455349,45.456549,45.459549,45.461749,45.462449,45.462049,45.462649,45.465349,45.468949,45.470249,45.471983,45.472649,45.476149,45.476929,45.478808,45.480212,45.485194,45.485275,45.48369,45.478877,45.475768,45.472994,45.471716,45.469243,45.468017,45.468636,45.470332,45.473147,45.47445,45.48185,45.48255,45.48305,45.48285,45.48365,45.48605,45.49195,45.49395,45.49795,45.50051,45.49875,45.49825,45.49745,45.49695,45.49705,45.496787,45.49445,45.49295,45.493714,45.49525,45.49655,45.49725,45.501064,45.505691,45.508034,45.509832,45.51263,45.51424,45.515253,45.516641,45.518095,45.518166,45.519428,45.521584,45.523731,45.527588,45.528385,45.530644,45.531392,45.53113,45.530316,45.531459,45.533713,45.535359,45.537249,45.537733,45.537535,45.538808,45.541528,45.54431,45.546732,45.548723,45.549859,45.551701,45.554154,45.555641,45.556725,45.557779,45.559754,45.563101,45.565666,45.567051,45.569936,45.574605,45.576728,45.581893,45.583655,45.589052,45.592508,45.595318,45.596067,45.597026,45.597602,45.597164,45.597302,45.598438,45.602365,45.607454,45.613944,45.615692,45.618006,45.621291,45.622848,45.626112,45.627031,45.626584,45.62586,45.624286,45.622016,45.621577,45.619673,45.619321,45.620066,45.622829,45.624827,45.626368,45.627752,45.628747,45.630668,45.633047,45.634178,45.635036,45.637158,45.638269,45.639391,45.639181,45.639518,45.640653,45.642019,45.644858,45.645151,45.645166,45.645177,45.645171,45.643312,45.643504,45.648871,45.648977,45.651677,45.654794,45.654991,45.655946,45.656147,45.655522,45.655788,45.656275,45.661515,45.663944,45.665119,45.66596,45.66608,45.666867,45.667379,45.668983,45.671177,45.671899,45.671852,45.671165,45.669195,45.669048,45.670148,45.672548,45.677548,45.678348,45.679448,45.681648,45.682348,45.686048,45.690648,45.693748,45.695448,45.696048,45.698648,45.700048,45.701648,45.701548,45.702247,45.702847,45.704747,45.706647,45.713047,45.714547,45.715847,45.717847,45.721447,45.722047,45.721346,45.720646,45.721546,45.720846,45.721046,45.722346,45.723946,45.726146,45.730246,45.732947,45.7372486812962]}]],[[{"lng":[-124.323889,-124.323214,-124.322417,-124.321769,-124.321536,-124.32138,-124.321173,-124.321095,-124.321432,-124.322087,-124.322719,-124.323287,-124.323765,-124.323739,-124.32405,-124.323889],"lat":[42.066648,42.067318,42.067459,42.067305,42.066766,42.066016,42.065612,42.065034,42.064573,42.064226,42.064104,42.064124,42.064438,42.065188,42.065785,42.066648]}],[{"lng":[-124.427244,-124.426878,-124.426074,-124.425349,-124.424934,-124.42496,-124.424856,-124.425038,-124.425556,-124.426126,-124.42693,-124.427251,-124.427244],"lat":[42.314462,42.315107,42.315529,42.315299,42.314781,42.314091,42.313325,42.312826,42.312673,42.312596,42.312846,42.313704,42.314462]}],[{"lng":[-124.47709,-124.476357,-124.476278,-124.475922,-124.475545,-124.474892,-124.475088,-124.474951,-124.474793,-124.475644,-124.475862,-124.476397,-124.476971,-124.477268,-124.47709],"lat":[42.66717,42.667622,42.667957,42.668452,42.668554,42.668029,42.667505,42.666748,42.666384,42.665743,42.665495,42.665888,42.666151,42.666602,42.66717]}],[{"lng":[-124.564595,-124.560403,-124.556645,-124.552441,-124.549492,-124.548023,-124.544561,-124.545058,-124.54051,-124.53648,-124.534433,-124.536195,-124.534589,-124.530438,-124.528298,-124.525653,-124.500141,-124.480938,-124.479636362958,-124.438676,-124.434245,-124.415423,-124.41539,-124.296347,-124.269254,-124.258388,-124.258274,-124.253467,-124.253317,-124.243779,-124.24387,-124.239129,-124.239394,-124.219623,-124.219416,-124.209708,-124.209522,-124.214393,-124.214201,-124.204851,-124.204529,-124.199717,-124.199692,-124.189984,-124.189907,-124.185291,-124.18531,-124.180706,-124.180704,-124.161308,-124.160976,-124.161288,-124.162074,-124.156629,-124.156491,-124.151209,-124.151235,-124.146377,-124.146344,-124.141475,-124.141185,-124.160658,-124.160149,-124.164889,-124.164225,-124.164887,-124.160163,-124.159895,-124.159966,-124.138655,-124.138686,-124.138748,-124.132926,-124.132918,-124.128049,-124.128073,-124.119228,-124.1192,-124.089872,-124.089872,-124.070314,-123.996291,-123.996296,-123.976677,-123.976631,-123.956985,-123.957026,-123.937288,-123.937268,-123.925942,-123.925717,-123.868491,-123.868282,-123.84989,-123.849858,-123.811553,-123.808536,-123.806976,-123.803732,-123.800444,-123.800083,-123.799136,-123.796749,-123.796456,-123.795111,-123.7917,-123.789263,-123.783304,-123.780349,-123.778041,-123.773571,-123.76995,-123.766112,-123.764019,-123.761476,-123.759427,-123.756486,-123.754526,-123.752421,-123.750436,-123.746879,-123.743493,-123.741725,-123.740093,-123.739229,-123.735741,-123.734082,-123.732315,-123.726832,-123.723188,-123.720137,-123.716495,-123.716492,-123.718719,-123.72034,-123.720119,-123.72218,-123.725276,-123.727794,-123.729321,-123.730022,-123.733021,-123.734322,-123.735421,-123.735183,-123.736506,-123.737944,-123.737502,-123.739398,-123.741852,-123.744373,-123.747579,-123.749533,-123.7545,-123.75543,-123.756231,-123.754795,-123.757263,-123.758186,-123.759135,-123.760665,-123.761074,-123.762886,-123.764535,-123.765268,-123.766875,-123.769127,-123.768483,-123.770488,-123.772341,-123.773833,-123.773716,-123.774581,-123.779962,-123.831264,-123.831689,-123.828568,-123.824264,-123.821526,-123.81985,-123.818972,-123.819403,-123.82086,-123.821583,-123.824234,-123.827067,-123.828618,-123.828393,-123.829275,-123.82926,-123.830469,-123.830315,-123.835668,-123.840861,-123.841223,-123.846549,-123.849663,-123.850178,-123.849517,-123.850134,-123.850036,-123.853456,-123.853474,-123.855639,-123.857235,-123.858754,-123.860305,-123.859671,-123.860844,-123.859311,-123.856672,-123.855219,-123.854798,-123.861708,-123.863521,-123.865356,-123.865843,-123.868406,-123.871196,-123.870714,-123.872161,-123.87338,-123.875128,-123.874554,-123.875902,-123.875677,-123.878488,-123.879224,-123.878426,-123.876055,-123.876929,-123.875256,-123.880309,-123.879821,-123.884731,-123.885552,-123.884898,-123.886257,-123.885746,-123.888662,-123.890657,-123.894213,-123.89549,-123.897998,-123.900611,-123.902759,-123.904993,-123.908023,-123.910798,-123.913158,-123.915768,-123.917355,-123.919321,-123.923228,-123.92617,-123.928109,-123.929368,-123.932984,-123.934826,-123.93669,-123.938921,-123.941841,-123.945943,-123.947539,-123.949711,-123.952541,-123.958133,-123.961176,-123.964007,-123.967916,-123.969199,-123.972758,-123.978035,-123.981442,-123.986415,-123.988482,-123.990256,-123.993419,-123.995531,-123.997493,-123.99878,-124.001195,-124.005475,-124.008695,-124.010456,-124.011544,-124.009244,-124.006863,-124.005541,-124.004173,-124.003139,-124.002248,-124.00144,-124.001629,-124.002819,-124.002893,-124.001127,-124.001225,-124.002402,-124.002827,-124.005121,-124.005753,-124.005436,-124.001334,-124.001159,-124.001535,-124.003052,-124.003935,-124.004475,-124.003591,-124.001851,-124.001625,-124.002003,-124.002891,-124.008608,-124.010703,-124.012236,-124.013606,-124.014517,-124.014611,-124.013664,-124.011699,-124.011005,-124.009677,-124.009174,-124.009457,-124.012825,-124.010968,-124.009216,-124.008668,-124.00863,-124.009651,-124.011666,-124.013057,-124.013345,-124.016251,-124.017488,-124.02036,-124.021521,-124.02306,-124.026168,-124.028557,-124.030212,-124.032309,-124.035718,-124.036828,-124.035796,-124.037047,-124.036177,-124.037333,-124.036998,-124.038842,-124.041983,-124.041579,-124.039586,-124.038584,-124.03726,-124.037266,-124.035489,-124.035001,-124.036171,-124.036265,-124.033565,-124.032262,-124.030141,-124.028712,-124.026947,-124.021961,-124.01908,-124.017452,-124.010986,-124.008637,-123.998549,-123.995141,-123.992913,-123.990456,-123.986317,-123.984686,-123.978917,-123.972898,-123.970015,-123.966661,-123.962628,-123.956029,-123.953011,-123.94959,-123.944632,-123.940407,-123.936538,-123.935313,-123.93467,-123.933213,-123.930195,-123.928303,-123.925893,-123.924437,-123.923302,-123.920408,-123.916606,-123.915017,-123.910437,-123.907007,-123.903527,-123.900219,-123.897208,-123.895094,-123.892651,-123.891321,-123.888026,-123.884354,-123.884467,-123.878816,-123.877852,-123.877858,-123.878522,-123.878927,-123.876337,-123.87675,-123.875264,-123.87318,-123.871837,-123.871462,-123.869582,-123.866394,-123.864168,-123.863558,-123.859863,-123.857646,-123.856118,-123.853846,-123.851287,-123.849054,-123.84557,-123.845982,-123.8417,-123.839496,-123.841454,-123.844167,-123.845404,-123.847483,-123.847595,-123.847315,-123.843557,-123.843007,-123.83972,-123.837879,-123.836606,-123.838419,-123.835287,-123.832956,-123.832684,-123.830947,-123.829732,-123.828031,-123.825321,-123.825742,-123.826159,-123.82382,-123.823743,-123.822177,-123.820847,-123.817359,-123.814997,-123.815251,-123.813816,-123.811992,-123.811604,-123.810017,-123.812203,-123.809421,-123.805938,-123.803515,-123.79962,-123.798159,-123.796383,-123.7922,-123.79252,-123.794003,-123.793075,-123.793288,-123.792834,-123.791154,-123.790462,-123.793144,-123.796702,-123.797063,-123.799931,-123.802202,-123.805991,-123.808307,-123.811361,-123.812417,-123.813891,-123.816794,-123.818915,-123.820471,-123.820407,-123.821531,-123.820857,-123.821288,-123.81719,-123.816316,-123.813505,-123.813199,-123.815092,-123.814536,-123.814793,-123.812603,-123.815726,-123.817915,-123.820841,-123.821199,-123.822386,-123.823911,-123.826311,-123.827684,-123.836854,-123.840232,-123.842871,-123.844724,-123.849528,-123.85081,-123.853382,-123.855572,-123.85591,-123.857192,-123.858549,-123.856075,-123.854857,-123.850176,-123.846258,-123.842828,-123.839241,-123.83883,-123.840149,-123.840156,-123.838249,-123.836688,-123.835422,-123.832155,-123.831124,-123.830979,-123.829967,-123.829528,-123.82572,-123.821973,-123.82251,-123.824877,-123.825624,-123.8271,-123.826921,-123.828112,-123.827264,-123.829397,-123.830968,-123.834173,-123.834302,-123.834601,-123.840227,-123.841559,-123.840893,-123.838755,-123.838574,-123.840118,-123.840683,-123.840693,-123.843151,-123.846851,-123.848497,-123.84909,-123.848952,-123.847758,-123.845611,-123.845386,-123.844471,-123.841723,-123.836151,-123.837574,-123.837496,-123.83653,-123.837541,-123.840103,-123.840068,-123.839963,-123.839529,-123.838849,-123.838592,-123.83774,-123.83615,-123.834613,-123.833287,-123.832066,-123.830213,-123.827325,-123.827502,-123.829295,-123.828843,-123.826343,-123.824441,-123.821615,-123.818161,-123.818981,-123.820663,-123.822037891998,-123.834208,-123.967045984176,-123.999248,-124.084956,-124.102532,-124.121365,-124.211605,-124.21894,-124.227079,-124.230459,-124.231537,-124.237242,-124.239121787196,-124.239716,-124.244725,-124.245485117115,-124.248523,-124.254028,-124.255035,-124.259821,-124.263887,-124.265820787596,-124.270094423003,-124.270464,-124.270791201675,-124.277703,-124.279883,-124.281677,-124.282347205885,-124.28264,-124.286679,-124.288729760161,-124.291269,-124.290870418472,-124.289783836142,-124.289478,-124.291670598908,-124.292595,-124.295473,-124.294998,-124.296801,-124.299649,-124.30084,-124.303991,-124.308571,-124.313319,-124.313628940036,-124.316250114133,-124.316276,-124.316823741191,-124.319738,-124.319924107201,-124.320203,-124.320698,-124.323806521608,-124.324785,-124.325767444958,-124.328858,-124.329066329506,-124.332127,-124.335162,-124.34101,-124.342669,-124.342058,-124.344673,-124.348476,-124.351083,-124.354027,-124.352136,-124.350766,-124.351193,-124.352704,-124.355319,-124.356229,-124.357122,-124.356177,-124.353486,-124.354239,-124.351535,-124.351784,-124.356493,-124.356243,-124.358499,-124.361563,-124.366028,-124.366832,-124.363389,-124.360318,-124.361972,-124.364606,-124.361748,-124.362442,-124.361009,-124.363555,-124.366106,-124.368606,-124.370319,-124.373264,-124.376215,-124.375337,-124.375697,-124.377867,-124.378158,-124.37662,-124.377762,-124.382256,-124.383633,-124.386301,-124.388426,-124.389162,-124.392505,-124.392458,-124.397747,-124.400795,-124.401549,-124.404214,-124.410982,-124.414149,-124.411534,-124.411461,-124.408514,-124.408226331137,-124.408215,-124.41051,-124.412919,-124.41131,-124.411815,-124.41978,-124.418591,-124.420557,-124.425264,-124.426435,-124.427782,-124.431686,-124.433063,-124.431438,-124.431495,-124.429288,-124.427222,-124.428752,-124.426885,-124.426354,-124.424759,-124.424765038491,-124.426155,-124.426131310332,-124.426017646233,-124.425647484431,-124.425499,-124.428734,-124.42983957245,-124.431134,-124.431273499676,-124.435892,-124.43512,-124.433983499306,-124.431748,-124.423836,-124.422038,-124.42492,-124.425631,-124.422012,-124.421981,-124.422394,-124.425816,-124.425039,-124.423084,-124.421356,-124.419964,-124.421381,-124.422195,-124.420076,-124.411362,-124.410982713025,-124.406126984569,-124.405834027084,-124.399829,-124.399133,-124.397684,-124.392657,-124.391571,-124.389977,-124.392305,-124.394426,-124.394815,-124.393663,-124.395052,-124.398319,-124.400031,-124.401954,-124.404933,-124.408289,-124.403855,-124.401716,-124.40433,-124.40112,-124.401498,-124.399421,-124.401385,-124.401177,-124.405547,-124.404841,-124.406282,-124.407266509123,-124.409431,-124.411308,-124.413764,-124.409836,-124.413119,-124.416774,-124.422747,-124.429195,-124.434688,-124.438875,-124.45074,-124.451484,-124.447873851781,-124.447487,-124.449417,-124.452248,-124.455263,-124.454984,-124.459643,-124.459797,-124.461619,-124.462569,-124.46445,-124.467766,-124.467559,-124.473864,-124.478516461253,-124.482158,-124.491225646384,-124.491679,-124.498473,-124.499122,-124.503681,-124.503784994074,-124.505236,-124.508394,-124.511286,-124.513663,-124.514669,-124.514311,-124.513602,-124.516177,-124.52046,-124.524439,-124.532333828514,-124.536073,-124.544179,-124.552845,-124.559298,-124.564487,-124.566244,-124.564595],"lat":[42.840876,42.838038,42.838429,42.840568,42.843616,42.847981,42.851377,42.854086,42.856855,42.862354,42.869664,42.87227,42.875403,42.876082,42.879534,42.879986,42.917502,42.951495,42.9543325389089,42.953817,42.95369,42.953769,42.955232,42.954621,42.954877,42.954946,42.951152,42.951314,42.943809,42.9443,42.940652,42.940948,42.933751,42.933782,42.918156,42.918227,42.911125,42.911141,42.904006,42.90391,42.900327,42.900275,42.896656,42.896696,42.893032,42.893047,42.885919,42.885998,42.88245,42.883499,42.876642,42.874824,42.86973,42.869642,42.8658,42.86581,42.862067,42.862081,42.850511,42.850586,42.828475,42.828288,42.817761,42.817825,42.804038,42.790006,42.790087,42.768326,42.739947,42.739956,42.729928,42.671115,42.671119,42.666697,42.666684,42.671123,42.671129,42.678339,42.678208,42.685454,42.685327,42.685651,42.7001,42.700118,42.714558,42.714569,42.729051,42.729097,42.739666,42.73971,42.774514,42.77484,42.781921,42.781821,42.788994,42.788837,42.787868,42.786983,42.787536,42.78959,42.790094,42.790954,42.79277,42.792936,42.793699,42.797302,42.798147,42.799426,42.798915,42.797665,42.797407,42.794568,42.793468,42.792059,42.792391,42.79107,42.789808,42.789804,42.788245,42.787735,42.788228,42.787971,42.786552,42.783343,42.782865,42.782516,42.781753,42.780131,42.781526,42.783945,42.784164,42.785376,42.784061,42.782694,42.780911,42.77747,42.775435,42.774115,42.773809,42.773041,42.771115,42.768945,42.765701,42.764575,42.762842,42.760655,42.757294,42.753118,42.751499,42.747987,42.746335,42.742576,42.742038,42.732339,42.731791,42.728067,42.72596,42.720584,42.720093,42.717906,42.717138,42.715876,42.715028,42.713543,42.711145,42.709109,42.708063,42.705989,42.704685,42.704493,42.702858,42.700834,42.700429,42.694025,42.632313,42.625798,42.625339,42.622398,42.619743,42.615779,42.614786,42.612446,42.611139,42.60913,42.607575,42.607046,42.606107,42.604497,42.601793,42.599452,42.598106,42.595067,42.591633,42.588961,42.587864,42.586258,42.583353,42.581966,42.579542,42.57809,42.574579,42.570941,42.569663,42.567228,42.566509,42.564143,42.563091,42.562393,42.559989,42.556281,42.553775,42.551791,42.549736,42.544375,42.542232,42.541989,42.539031,42.536341,42.535158,42.534203,42.533372,42.531188,42.530067,42.528675,42.527805,42.526195,42.524647,42.522047,42.519959,42.516799,42.516203,42.51372,42.511588,42.509885,42.508401,42.507625,42.506279,42.505436,42.504233,42.502978,42.500538,42.499925,42.498997,42.499058,42.498416,42.499584,42.499165,42.496903,42.497435,42.496146,42.495396,42.495798,42.494737,42.495021,42.494335,42.494563,42.496048,42.496023,42.497079,42.500293,42.50113,42.500867,42.501334,42.500474,42.500487,42.499311,42.498238,42.498816,42.49732,42.497228,42.496028,42.49535,42.49761,42.497167,42.498353,42.501979,42.501621,42.499599,42.500832,42.500694,42.499962,42.496875,42.496918,42.496147,42.494019,42.489628,42.489421,42.488828,42.487376,42.486682,42.485828,42.48466,42.480858,42.477902,42.473912,42.47166,42.467382,42.464829,42.46302,42.462667,42.462041,42.461239,42.458572,42.455054,42.453976,42.453402,42.451972,42.451543,42.451153,42.447785,42.44602,42.445291,42.444308,42.443527,42.441928,42.439908,42.437069,42.435068,42.434189,42.432342,42.430707,42.429269,42.428504,42.427851,42.427216,42.426465,42.423994,42.421801,42.421399,42.420822,42.419622,42.418034,42.416175,42.413114,42.412677,42.412176,42.410959,42.410041,42.408194,42.407621,42.407409,42.403308,42.402883,42.403283,42.401762,42.398726,42.396407,42.395766,42.394949,42.393818,42.392623,42.388837,42.387656,42.385912,42.384751,42.383094,42.382673,42.380525,42.377858,42.375876,42.374389,42.3702,42.367455,42.365481,42.363636,42.361049,42.359199,42.36166,42.361384,42.35977,42.358541,42.359016,42.358488,42.358487,42.357659,42.357941,42.359409,42.358449,42.358505,42.357979,42.357324,42.35774,42.356714,42.357866,42.356991,42.356544,42.358058,42.360604,42.361625,42.35983,42.355761,42.354338,42.353759,42.352612,42.352008,42.351045,42.348835,42.346469,42.346592,42.346709,42.347884,42.347644,42.349314,42.349234,42.350937,42.351422,42.353293,42.353095,42.351454,42.347602,42.346072,42.345667,42.344851,42.342428,42.341049,42.335279,42.333167,42.330669,42.330071,42.327633,42.327455,42.324799,42.322796,42.322362,42.321478,42.32046,42.31854,42.318688,42.319933,42.320742,42.320577,42.319125,42.318327,42.316923,42.313281,42.312202,42.310752,42.307854,42.305638,42.303538,42.301983,42.299219,42.298507,42.297656,42.296282,42.294693,42.290556,42.288537,42.286277,42.285622,42.282991,42.281652,42.279859,42.279255,42.276123,42.271824,42.270973,42.268693,42.266983,42.264365,42.264665,42.264096,42.262603,42.259439,42.254797,42.253495,42.251246,42.24779,42.24399,42.241494,42.241176,42.239436,42.240204,42.238232,42.237497,42.237623,42.233619,42.231155,42.230098,42.22781,42.224314,42.222173,42.220457,42.22111,42.219878,42.218962,42.216388,42.215738,42.216849,42.217284,42.214644,42.212667,42.20573,42.203769,42.2036,42.198974,42.195498,42.193959,42.190924,42.189849,42.188225,42.185435,42.183987,42.178235,42.174122,42.172501,42.170464,42.169651,42.166047,42.16438,42.163027,42.161167,42.159333,42.157656,42.157509,42.155855,42.154378,42.152913,42.149668,42.146369,42.145819,42.144503,42.143597,42.141392,42.138323,42.137426,42.135116,42.133224,42.130628,42.126945,42.125204,42.125599,42.124671,42.122593,42.119291,42.116779,42.113334,42.109619,42.10885,42.107914,42.103609,42.101345,42.100377,42.097285,42.093188,42.086567,42.085321,42.084441,42.080498,42.077493,42.074796,42.073675,42.072475,42.069596,42.068955,42.066002,42.063791,42.063187,42.060507,42.059225,42.058515,42.057965,42.057618,42.055504,42.05248,42.051934,42.048965,42.047798,42.046646,42.045069,42.043009,42.040136,42.03699,42.036426,42.03336,42.031385,42.029292,42.02734,42.025558,42.024006,42.020306,42.018736,42.018098,42.017586,42.01704,42.016469,42.015304,42.01489,42.013911,42.012811,42.012042,42.011666,42.011552,42.008438,42.006535,42.004951,42.002504,42.00188,42.000564,41.999935,41.998791,41.998563,41.996727,41.9956172960188,41.996116,41.9961337074385,41.996138,41.996662,41.99681,41.997015,41.99846,42.007916,42.0125,42.013206,42.015156,42.018688,42.0225828218138,42.023814,42.02522,42.0253761062006,42.026,42.029218,42.031573,42.034578,42.040923,42.042284325311,42.0452928294818,42.045553,42.0455717127357,42.045967,42.044316,42.04427,42.0450543427124,42.045397,42.045346,42.0447352398387,42.043979,42.044650646595,42.0464816379254,42.046997,42.0480183838992,42.048449,42.04764,42.048876,42.051343,42.051736,42.055806,42.060886,42.064801,42.065277,42.0655839003804,42.0681793680017,42.068205,42.0688524167975,42.072297,42.0730712835003,42.07423159375,42.076291,42.0803783978765,42.081665,42.0825671223039,42.085405,42.0854402420363,42.085958,42.087445,42.092929,42.094295,42.097922,42.100039,42.100215,42.100213,42.103539,42.104692,42.108014,42.110662,42.113293,42.113635,42.114952,42.118016,42.119711,42.121595,42.124095,42.129796,42.134965,42.139691,42.142132,42.143848,42.143767,42.152343,42.15845,42.158588,42.162272,42.166086,42.169219,42.171991,42.176704,42.180752,42.182839,42.183612,42.18862,42.191349,42.195752,42.196381,42.201109,42.206111,42.208971,42.21119,42.213643,42.218809,42.223888,42.22716,42.228076,42.229427,42.232105,42.233345,42.23515,42.239938,42.240081,42.242802,42.245129,42.250547,42.252164,42.254115,42.257678,42.260588,42.2796049322341,42.280354,42.298652,42.301818,42.305175,42.307393,42.315527,42.316757,42.320412,42.322026,42.319569,42.318857,42.321101,42.323976,42.329094,42.33072,42.331746,42.33488,42.338918,42.341532,42.352029,42.376993,42.3770733517197,42.395569,42.3960674941724,42.3984592917688,42.4062484892051,42.409373,42.417776,42.4206421965775,42.423998,42.4243844827095,42.43718,42.441926,42.443810056608,42.447516,42.45735,42.461226,42.462132,42.46346,42.465439,42.470417,42.475608,42.476345,42.478611,42.478952,42.485061,42.48998,42.491737,42.496427,42.499678,42.513378,42.5141969546748,42.5246814209893,42.5253139734301,42.53828,42.543366,42.546728,42.561716,42.568218,42.574758,42.576755,42.577054,42.578512,42.582061,42.584732,42.589587,42.591926,42.592077,42.591139,42.594815,42.594702,42.597676,42.601175,42.601872,42.610005,42.618079,42.620088,42.627192,42.628966,42.631415,42.636517,42.6370463026186,42.63821,42.640715,42.645795,42.649485,42.657934,42.661594,42.663285,42.666605,42.669958,42.670837,42.675798,42.677787,42.6840670501793,42.68474,42.689819,42.691953,42.694369,42.697079,42.702166,42.707486,42.711488,42.714106,42.717283,42.719533,42.723821,42.732671,42.7351234428017,42.737043,42.7415630136265,42.741789,42.741077,42.738606,42.739758,42.7395367701631,42.73645,42.735337,42.733124,42.732949,42.736806,42.744038,42.745827,42.755653,42.770865,42.789793,42.8063386170557,42.814175,42.822958,42.830144,42.834298,42.834164,42.836392,42.840876]}]],[[{"lng":[-124.150267,-124.144075,-124.138326,-124.137178,-124.137081915707,-124.136941,-124.134251,-124.133271736676,-124.130608,-124.125752,-124.125748897347,-124.123975,-124.125438,-124.124083,-124.123643,-124.127073,-124.127758,-124.125824,-124.123876,-124.125868,-124.128882,-124.12741,-124.125272,-124.122668,-124.117006,-124.116717,-124.115864601151,-124.114424,-124.115671,-124.114719,-124.113212,-124.111054,-124.112945,-124.115309,-124.114293,-124.111681,-124.111766,-124.108945,-124.109744,-124.114869,-124.115953,-124.114690718599,-124.114043752426,-124.083717,-124.063303,-124.063259,-123.941072,-123.941075,-123.798955,-123.775598,-123.767931,-123.723588,-123.715386,-123.715377,-123.593513,-123.59329,-123.573614,-123.556039,-123.532858,-123.472186,-123.471685,-123.455686,-123.451272,-123.371411,-123.371408,-123.367696,-123.328667,-123.288655,-123.248679,-123.230044,-123.224885,-123.200385,-123.180388,-123.179931,-123.175977,-123.175133,-123.174174,-123.174054,-123.174938,-123.17501,-123.177701,-123.178903,-123.17878,-123.175342,-123.174204,-123.171308,-123.169341,-123.166868,-123.163604,-123.159533,-123.156542,-123.153386,-123.1512,-123.15034,-123.150627,-123.152389,-123.155708,-123.15911,-123.15787,-123.160434,-123.164226,-123.166002,-123.165428,-123.127696,-123.07167,-123.060853,-123.040799,-123.038427,-123.038121,-122.985827,-122.97952,-122.979199,-122.905755,-122.903999,-122.884125,-122.872923,-122.865545,-122.865465,-122.861992,-122.860134,-122.856452,-122.852796,-122.849343,-122.846854,-122.845096,-122.843403,-122.839919,-122.837442,-122.835135,-122.833148,-122.830451,-122.830352,-122.828717,-122.829074,-122.82527,-122.823015,-122.819352,-122.817065,-122.814416,-122.811705,-122.807156,-122.804727,-122.802825,-122.798259,-122.795605,-122.791085,-122.788615,-122.784205,-122.781625,-122.779134,-122.776319,-122.774074,-122.771265,-122.768734,-122.762735,-122.758905,-122.758014,-122.753255,-122.749834,-122.746347,-122.744584,-122.742034,-122.738128,-122.731121,-122.727574,-122.725697,-122.725089,-122.724937,-122.722692,-122.721184,-122.717134,-122.71472,-122.710473,-122.706473,-122.704483,-122.700224,-122.696076,-122.696412,-122.693973,-122.692063,-122.689353,-122.686703,-122.683333,-122.680863,-122.678543,-122.676247,-122.674283,-122.670787,-122.668915,-122.665931,-122.663697,-122.657909,-122.655773,-122.652553,-122.651583,-122.646853,-122.64679,-122.644542,-122.645763,-122.64493,-122.644082,-122.640716,-122.639699,-122.637437,-122.631432,-122.624857,-122.622312,-122.617391,-122.611738,-122.608342,-122.604621,-122.599071,-122.593471,-122.591986,-122.588363,-122.585624,-122.582028,-122.579831,-122.57677,-122.5754,-122.575169,-122.57778,-122.577232,-122.573085,-122.570153,-122.567339,-122.565493,-122.562413,-122.558723,-122.554953,-122.551917,-122.549707,-122.548543,-122.545794,-122.543711,-122.539632,-122.535382,-122.533745,-122.532614,-122.532942,-122.531171,-122.529542,-122.528191,-122.522442,-122.519391,-122.513425,-122.512251,-122.511964,-122.510561,-122.507203,-122.503182,-122.499506,-122.497,-122.492272,-122.488381,-122.484305,-122.479635,-122.478045,-122.47368,-122.470829,-122.468798,-122.465628,-122.463518,-122.457892,-122.456337,-122.451074,-122.448436,-122.445272,-122.442879,-122.438796,-122.434885,-122.430218,-122.426446,-122.425081,-122.425089,-122.404748,-122.404781,-122.384561,-122.38457,-122.379589,-122.373799,-122.371128,-122.367197,-122.364257,-122.363745,-122.361244,-122.358069,-122.35689,-122.355447,-122.354488,-122.352623,-122.347714,-122.340612,-122.339923,-122.336791,-122.334249,-122.331857,-122.330673,-122.327313,-122.328729,-122.325744,-122.328531,-122.331478,-122.332446,-122.32949,-122.32715,-122.264527,-122.264527,-122.228368,-122.027996,-122.028016,-121.964517,-121.960126,-121.799426,-121.797461,-121.794053,-121.793299,-121.789648,-121.78928,-121.790457,-121.789792,-121.787806,-121.78766,-121.786562,-121.785421,-121.785753,-121.783459,-121.780239,-121.778226,-121.777905,-121.779552,-121.78406,-121.785251,-121.783458,-121.785536,-121.785631,-121.78366,-121.78161,-121.782576,-121.780652,-121.781334,-121.782174,-121.78121,-121.781511,-121.7791,-121.777485,-121.774525,-121.774047,-121.774429,-121.773407,-121.77429,-121.776464,-121.777556,-121.779738,-121.778813,-121.777229,-121.773196,-121.771647,-121.772913,-121.772426,-121.776708,-121.77888,-121.782017,-121.781132,-121.781069,-121.78342,-121.783142,-121.78402,-121.782676,-121.779553,-121.772735,-121.773339,-121.772532,-121.773003,-121.771473,-121.771649,-121.770604,-121.771345,-121.769381,-121.76807,-121.768446,-121.769573,-121.770003,-121.769311,-121.769874,-121.769259,-121.771349,-121.772156,-121.771755,-121.772481,-121.773384,-121.776779,-121.777087,-121.779395,-121.779748,-121.784547,-121.787098,-121.789211,-121.789458,-121.790365,-121.793616,-121.796501,-121.799227,-121.801513,-121.802225,-121.805421,-121.81219,-121.814176,-121.815895,-121.817468,-121.820056,-121.821394,-121.825726,-121.830059,-121.832225,-121.834472,-121.835193,-121.832785,-121.832623,-121.82955,-121.828042,-121.827324,-121.825487,-121.825042,-121.825381,-121.823599,-121.822016,-121.822384,-121.824299,-121.824533,-121.825663,-121.827099,-121.829103,-121.829239,-121.833384,-121.831355,-121.830273,-121.828402,-121.832449,-121.835458,-121.83679,-121.835963,-121.837282,-121.843135,-121.845087,-121.84511,-121.84356,-121.841469,-121.836722,-121.841387,-121.84539,-121.848898,-121.851462,-121.853218,-121.857063,-121.859711,-121.85998,-121.858022,-121.859435,-121.859497,-121.858124,-121.858174,-121.859205,-121.858102,-121.858364,-121.860927,-121.861569,-121.861353,-121.862399,-121.861553,-121.865338,-121.864863,-121.86649,-121.868366,-121.869966,-121.865855,-121.865553,-121.866636,-121.86838,-121.868029,-121.869385,-121.871602,-121.876903,-121.884325,-121.888545,-121.891442,-121.892574,-121.893921,-121.898393,-121.899743,-121.901482,-121.904318,-121.905856,-121.907868,-121.911588,-121.913613,-121.916265,-121.916801,-121.920359,-121.923578,-121.928213,-121.929404,-121.931438,-121.934322,-121.936964,-121.939333,-121.93656,-121.931479,-121.931269,-121.932415,-121.937524,-121.94233,-121.943782,-121.94521,-121.947402,-121.952256,-121.952638,-121.951391,-121.95134,-121.95296,-121.956466,-121.9575,-121.959462,-121.961483,-121.962046,-121.965431,-121.968548,-121.972931,-121.972875,-121.975113,-121.975358,-121.97542,-121.974896,-121.976173,-121.976081,-121.974401,-121.9744,-121.975192,-121.974803,-121.975226,-121.976052,-121.976763,-121.977799,-121.976611,-121.975264,-121.973657,-121.973495,-121.974756,-121.974278,-121.975565,-121.97546,-121.974371,-121.97073,-121.967767,-121.963754,-121.964537,-121.964924,-121.964404,-121.966654,-121.968382,-121.967348,-121.967157,-121.967844,-121.96739,-121.966186,-121.964026,-121.960507,-121.962544,-121.96538,-121.968894,-121.969609,-121.969048,-121.965522,-121.961437,-121.963562,-121.967095,-121.968164,-121.970119,-121.971991,-121.970437,-121.974141,-121.974351,-121.975677,-121.981248,-121.981007,-121.979648,-121.978289,-121.975173,-121.975571,-121.973689,-121.975456,-121.977949,-121.978262,-121.977,-121.975842,-121.973588,-121.973125,-121.974629,-121.975179,-121.974607,-121.973498,-121.971795,-121.967179,-121.966917,-121.967826,-121.972422,-121.973084,-121.972889,-121.973488,-121.976117,-121.978224,-121.979573,-121.979319,-121.980832,-121.981099,-121.983119,-121.98475,-121.984519,-121.985716,-121.986267,-121.985717,-121.98691,-121.985633,-121.982442,-121.980619,-121.980509,-121.978135,-121.974541,-121.973742,-121.972147,-121.969516,-121.967951,-121.9657,-121.964918,-121.968364,-121.977014,-121.981146,-121.98666,-121.99214,-121.995526,-121.997755,-122.000095,-122.001623,-122.001944,-122.002362,-122.003068,-122.010965,-122.013037,-122.016941,-122.020002,-122.026748,-122.02914,-122.034958,-122.035993,-122.038966,-122.04094,-122.042529,-122.046115,-122.047708,-122.049781,-122.056872,-122.059263,-122.061334,-122.064361,-122.067707,-122.071531,-122.072724,-122.070284,-122.071291,-122.076149,-122.078379,-122.080848,-122.0826,-122.086742,-122.092318,-122.093513,-122.094982,-122.094779,-122.096613,-122.099228,-122.103544,-122.105215,-122.106566,-122.109553,-122.110753,-122.112224,-122.116677,-122.124336,-122.125264,-122.12716,-122.129193,-122.131009,-122.131616,-122.133128,-122.133674,-122.135109,-122.136349,-122.138746,-122.139145,-122.140828,-122.142806,-122.142867,-122.141768,-122.140082,-122.140274,-122.143532,-122.144946,-122.146991,-122.146222,-122.147807,-122.149534,-122.148688,-122.147726,-122.145139,-122.142355,-122.138758,-122.132474,-122.131583,-122.129797,-122.129678,-122.130579,-122.128721,-122.130529,-122.133453,-122.133547,-122.130937,-122.131417,-122.133046,-122.133356,-122.132331,-122.132848,-122.134547,-122.13445,-122.135334,-122.136871,-122.138917,-122.140492,-122.140161,-122.13888,-122.137364,-122.136458,-122.138412,-122.138978,-122.136912,-122.138621,-122.145365,-122.147339,-122.146301,-122.148739,-122.151573,-122.15296,-122.149927,-122.147305,-122.14421,-122.14345,-122.140676,-122.138814,-122.13754,-122.132435,-122.132034,-122.270653,-122.27067,-122.447124,-122.508441,-122.508438,-122.622914,-122.622946,-122.741716,-122.741317,-122.741914,-122.741845,-122.771564,-122.776409,-122.781518,-122.833744,-122.892765,-122.9124,-122.932533,-122.935501,-122.970915,-122.987618,-122.987626,-123.107475,-123.107672,-123.107318,-123.137211,-123.13733,-123.137588,-123.137646,-123.138001,-123.137319,-123.147539,-123.153653,-123.185986,-123.312001,-123.313129,-123.348246,-123.3482,-123.397831,-123.411426,-123.470371,-123.470251,-123.529153,-123.529005,-123.579689,-123.57958,-123.619574,-123.619367,-123.619621,-123.619012,-123.658909,-123.658767,-123.703628,-123.7038,-123.734733,-123.75871,-123.81007,-123.827004,-123.827036,-123.831984,-123.832118,-123.837073,-123.837143,-123.842059,-123.842136,-123.847057,-123.847397,-123.852268,-123.852602,-123.862381,-123.862685,-123.872399,-123.872566,-123.872667,-123.877485,-123.877749,-123.882553,-123.882804,-123.897197,-123.897407,-123.902195,-123.902391,-123.907166,-123.916158,-123.925917,-123.926089,-123.925479,-123.934708,-123.946529,-123.946294,-123.96592,-123.98581,-124.005944,-124.025781,-124.064585,-124.064614,-124.098533,-124.101667,-124.102125,-124.104167,-124.138807,-124.158728145934,-124.150267],"lat":[43.91085,43.958437,43.995325,44.013606,44.0174173436398,44.023007,44.042125,44.0485338927156,44.065967,44.092848,44.0928706736351,44.105834,44.11123,44.114417,44.117217,44.119776,44.122027,44.12613,44.1341,44.136034,44.137549,44.139211,44.141892,44.142519,44.171913,44.185962,44.1904979663121,44.198164,44.206554,44.2167,44.221742,44.235071,44.24275,44.245977,44.249408,44.255421,44.260489,44.265475,44.270597,44.272721,44.274641,44.276194,44.2769899702691,44.276117,44.275094,44.277178,44.277375,44.282951,44.283304,44.283547,44.283606,44.283944,44.283946,44.280267,44.276699,44.281915,44.282597,44.281402,44.281523,44.281471,44.281185,44.280647,44.280496,44.281021,44.283725,44.283719,44.283725,44.283724,44.283726,44.283725,44.283725,44.283725,44.283725,44.283431,44.277606,44.275152,44.267131,44.266608,44.261582,44.259514,44.255751,44.253056,44.251601,44.248645,44.248114,44.247537,44.245854,44.240113,44.235315,44.233078,44.233269,44.231343,44.228779,44.226627,44.2252,44.222689,44.219947,44.214094,44.211612,44.207989,44.204725,44.201877,44.200071,44.200016,44.200024,44.200077,44.200136,44.200745,44.200129,44.200572,44.200613,44.200616,44.200736,44.259129,44.258894,44.258952,44.25898,44.287317,44.286662,44.285586,44.285373,44.285539,44.284298,44.284282,44.283601,44.281187,44.281352,44.282129,44.283455,44.282285,44.282166,44.28097,44.278525,44.277106,44.276858,44.27432,44.275804,44.27639,44.276269,44.27983,44.284171,44.283952,44.284435,44.284724,44.285708,44.285866,44.28565,44.283459,44.2834,44.283909,44.283816,44.284609,44.286729,44.288119,44.290537,44.290066,44.289137,44.28724,44.28473,44.285909,44.286051,44.287467,44.285828,44.28823,44.286529,44.286668,44.285639,44.283162,44.282775,44.281778,44.280931,44.281603,44.27937,44.279319,44.27822,44.279938,44.278893,44.277019,44.275771,44.275387,44.273948,44.27373,44.274459,44.274128,44.27327,44.273535,44.271849,44.270633,44.268902,44.269093,44.270062,44.271093,44.269688,44.26881,44.267078,44.266384,44.264246,44.260088,44.25681,44.253458,44.252551,44.251096,44.249263,44.249458,44.249189,44.25002,44.249852,44.247801,44.246867,44.245298,44.244228,44.24447,44.244427,44.242953,44.24123,44.239178,44.238046,44.237819,44.236587,44.235358,44.234628,44.22979,44.228044,44.229146,44.228689,44.229347,44.230575,44.231617,44.230568,44.231089,44.232295,44.235344,44.235588,44.235022,44.235184,44.23431,44.23486,44.233706,44.231511,44.22987,44.228633,44.226715,44.226498,44.228581,44.230717,44.231535,44.22982,44.227819,44.2262,44.223448,44.22167,44.222611,44.222308,44.219967,44.221927,44.22148,44.219132,44.219196,44.222406,44.222878,44.222599,44.223039,44.222209,44.220805,44.219036,44.21805,44.216748,44.217388,44.218543,44.21871,44.221306,44.220296,44.218544,44.218198,44.220657,44.22058,44.216938,44.217063,44.211013,44.20944,44.210413,44.209667,44.20938,44.21102,44.211945,44.211748,44.213326,44.216311,44.217265,44.219183,44.220742,44.221659,44.221577,44.224454,44.227001,44.226938,44.227653,44.229606,44.231189,44.234719,44.237579,44.238506,44.240603,44.243382,44.249537,44.252841,44.25263,44.253847,44.253847,44.253818,44.256164,44.257238,44.257313,44.25828,44.254613,44.252707,44.25152,44.249326,44.247071,44.245463,44.243505,44.240762,44.234981,44.233215,44.230903,44.229239,44.225653,44.224606,44.221483,44.218877,44.216985,44.215751,44.212595,44.209599,44.208394,44.207811,44.20542,44.205326,44.203014,44.201958,44.199392,44.198499,44.196545,44.194809,44.194255,44.192042,44.190792,44.190156,44.187627,44.185623,44.183762,44.181082,44.178687,44.17565,44.173127,44.171595,44.169488,44.167583,44.164798,44.16353,44.159933,44.160744,44.159765,44.158315,44.155202,44.154322,44.151746,44.148462,44.14625,44.145276,44.139831,44.137039,44.134981,44.133307,44.131314,44.12676,44.125254,44.123916,44.118178,44.115245,44.11205,44.110428,44.108132,44.106409,44.10395,44.10134,44.099603,44.095897,44.094858,44.091034,44.089686,44.088537,44.085138,44.082353,44.080121,44.077214,44.076541,44.075019,44.072607,44.071873,44.067131,44.061662,44.060089,44.05684,44.052691,44.052251,44.053164,44.052956,44.051201,44.051832,44.050905,44.047911,44.044147,44.041365,44.041599,44.039744,44.037024,44.035576,44.033319,44.03106,44.029158,44.024752,44.023129,44.021567,44.019426,44.016406,44.012359,44.010777,44.008066,44.004224,44.002135,43.99759,43.995395,43.994496,43.991094,43.990573,43.989247,43.988727,43.987296,43.987284,43.985983,43.984745,43.982647,43.979073,43.976239,43.975021,43.973445,43.972587,43.971232,43.969574,43.967175,43.967269,43.966335,43.966596,43.965248,43.961526,43.958507,43.954542,43.953806,43.952781,43.951404,43.948783,43.947384,43.945593,43.944787,43.943048,43.941197,43.939036,43.937103,43.935837,43.932315,43.930281,43.925795,43.923898,43.923286,43.920959,43.919789,43.917106,43.915837,43.914504,43.911859,43.911681,43.907841,43.907985,43.90867,43.908658,43.9109,43.910784,43.912269,43.914537,43.9159,43.914863,43.913363,43.913876,43.912326,43.912917,43.912347,43.911488,43.911171,43.908566,43.909181,43.907347,43.905543,43.904908,43.903343,43.900866,43.900588,43.898992,43.897504,43.894213,43.890663,43.886262,43.884603,43.882058,43.881049,43.878063,43.876552,43.875554,43.873938,43.871681,43.870083,43.868549,43.868195,43.866226,43.865003,43.865763,43.864554,43.861156,43.859351,43.85757,43.855444,43.851773,43.851243,43.848478,43.846044,43.843043,43.84128,43.83999,43.838518,43.83585,43.834914,43.830226,43.828526,43.827615,43.827875,43.829345,43.827147,43.821219,43.817418,43.812541,43.811768,43.811555,43.813036,43.812761,43.809736,43.808235,43.805798,43.803954,43.801924,43.800984,43.795743,43.793313,43.791207,43.78699,43.784709,43.782628,43.78124,43.77872,43.777706,43.774753,43.769542,43.76734,43.765176,43.763745,43.762525,43.759699,43.757767,43.756832,43.752983,43.750748,43.750364,43.748549,43.746965,43.742964,43.741516,43.739082,43.737692,43.735841,43.733585,43.730635,43.729102,43.725444,43.724446,43.722386,43.721911,43.7176,43.715821,43.714027,43.710661,43.708584,43.706227,43.705008,43.704254,43.702821,43.701406,43.69714,43.695848,43.692868,43.691409,43.690301,43.688021,43.683766,43.680825,43.676079,43.673038,43.670143,43.667019,43.665708,43.66425,43.661708,43.656292,43.653858,43.652527,43.644379,43.64254,43.639685,43.637181,43.635627,43.633715,43.631689,43.629837,43.627549,43.62779,43.627045,43.626385,43.625796,43.625894,43.625632,43.625893,43.626937,43.62704,43.626357,43.622528,43.616414,43.615498,43.614657,43.609274,43.609162,43.609916,43.606611,43.604822,43.603609,43.602452,43.601758,43.601615,43.600817,43.599211,43.597823,43.597881,43.594581,43.59192,43.590297,43.589719,43.587403,43.58775,43.58775,43.584945,43.581616,43.579585,43.579643,43.577964,43.577326,43.577615,43.579584,43.579642,43.579215,43.576825,43.575654,43.574618,43.574987,43.574486,43.572977,43.569273,43.567709,43.565274,43.56549,43.562447,43.561938,43.55993,43.558293,43.557376,43.557284,43.55495,43.553278,43.551491,43.549437,43.544544,43.543161,43.541944,43.540482,43.53711,43.535952,43.534465,43.530775,43.529683,43.528421,43.52841,43.525509,43.523617,43.523017,43.520693,43.519057,43.515463,43.513576,43.513285,43.511821,43.510434,43.507323,43.505694,43.503594,43.499774,43.496887,43.491969,43.491401,43.489966,43.485057,43.483834,43.482811,43.479701,43.478185,43.476034,43.47356,43.472069,43.468423,43.467445,43.467514,43.466716,43.463835,43.461778,43.461777,43.460686,43.459132,43.456987,43.456339,43.45514,43.45489,43.452654,43.450923,43.449351,43.448708,43.447662,43.444354,43.442479,43.442832,43.444169,43.444947,43.444501,43.443167,43.441124,43.440221,43.440011,43.441628,43.44141,43.441275,43.440226,43.440262,43.438458,43.437395,43.452015,43.517582,43.544654,43.544317,43.544034,43.543912,43.544702,43.544882,43.543886,43.544357,43.54417,43.541679,43.540992,43.538988,43.540013,43.542099,43.605889,43.605906,43.649355,43.677086,43.736284,43.753648,43.77967,43.779635,43.779631,43.779533,43.77991,43.77991,43.78017,43.809212,43.809076,43.809877,43.810056,43.831183,43.830061,43.86833,43.868291,43.891057,43.891672,43.899074,43.906509,43.921117,43.921672,43.936474,43.937399,43.944319,43.944062,43.943882,43.944581,43.944837,43.94305,43.94308,43.935987,43.935984,43.932458,43.932429,43.928878,43.928822,43.924661,43.924682,43.920553,43.920658,43.916562,43.916733,43.914097,43.912655,43.91275,43.908629,43.908714,43.904582,43.904714,43.900512,43.900512,43.896281,43.896252,43.897322,43.898476,43.878689,43.865947,43.866012,43.871689,43.862737,43.863042,43.862001,43.862996,43.862224,43.862277,43.86421,43.863512,43.86343,43.863417,43.863289,43.863611,43.8637200341693,43.91085]}]],[[{"lng":[-119.943441,-119.943504,-119.931595,-119.931944,-119.932611,-119.896969,-119.896465,-119.895056,-119.895163,-119.896581,-119.897434,-119.777528,-119.775402,-119.657183,-119.614325,-118.932024,-118.867264,-118.857192,-118.816931,-118.81689,-118.799711,-118.587172,-118.587125,-118.467308,-118.466299,-118.347859,-118.347856,-118.227645,-118.228107,-118.230291,-118.231731,-118.232392,-118.232171,-118.232178,-118.232011,-118.228069,-118.228618,-118.228683,-118.228673,-118.228793,-118.216832,-118.216384,-118.214698,-118.195281,-118.196857,-118.197369215928,-118.501002,-118.601806,-118.628692114981,-118.644698465629,-118.696409,-118.775869,-118.777228,-118.795612,-118.829630206433,-119.001022,-119.20828,-119.231876,-119.251033,-119.324182599298,-119.360121480893,-119.359446,-119.363579,-119.363648,-119.363896,-119.365156,-119.365337,-119.705858,-119.706005,-119.943779,-119.943441],"lat":[42.753671,42.917079,42.917005,42.976439,43.178963,43.179017,43.353816,43.568127,43.592745,43.611164,43.6982,43.697957,43.959086,43.95892,43.959593,43.960374,43.960462,43.960227,43.960733,44.047828,44.047775,44.046995,44.040266,44.040375,44.040374,44.040388,44.039075,44.039862,43.779195,43.779207,43.779216,43.612266,43.436775,43.43565,43.348959,43.348964,43.096791,43.086086,43.042817,42.914625,42.914703,42.805902,42.275891,42.275813,42.135279,41.9969940811635,41.995446,41.993895,41.9932978970796,41.9929424184721,41.991794,41.992692,41.992671,41.992394,41.9926256901358,41.993793,41.993177,41.994212,41.993843,41.9942055845967,41.9943837248054,42.13723,42.137231,42.220094,42.487079,42.661822,42.748958,42.748791,42.746605,42.746371,42.753671]}]],[[{"lng":[-122.867891,-122.857175,-122.851912,-122.846503,-122.846485,-122.846494,-122.843407,-122.842499,-122.825967,-122.82066,-122.807188,-122.805556,-122.80547,-122.787507,-122.786266,-122.784896,-122.769123,-122.764942,-122.75407,-122.746817,-122.743741,-122.743868,-122.743811,-122.743798,-122.743856,-122.743923,-122.743923,-122.743933,-122.743922,-122.743915,-122.743919,-122.743921,-122.743926,-122.743942,-122.743939,-122.743848,-122.743941,-122.743942,-122.743956,-122.743963,-122.743974,-122.744029,-122.74406,-122.744006,-122.743991,-122.743721,-122.741101,-122.738563,-122.733422,-122.7303,-122.725541,-122.721663,-122.721355,-122.719286,-122.715938,-122.712169,-122.707893,-122.705021,-122.703304,-122.702001,-122.701808,-122.698697,-122.697382,-122.694678,-122.682505,-122.681893,-122.675572,-122.673311,-122.672677,-122.666298,-122.666145,-122.660451,-122.654959,-122.648725,-122.648787,-122.651183,-122.646267,-122.64616,-122.647666,-122.651227,-122.652605,-122.658274,-122.659105,-122.660979,-122.656972,-122.652988,-122.652921,-122.646958,-122.641245,-122.64158,-122.636587,-122.63656,-122.632974,-122.626278,-122.622359,-122.618977,-122.618995,-122.618588,-122.618341,-122.616871,-122.616195,-122.615374,-122.613127,-122.610832,-122.608722,-122.606614,-122.60573,-122.60175,-122.601454,-122.599675,-122.597665,-122.59762,-122.597395,-122.597198,-122.597184,-122.596702,-122.596603,-122.596245,-122.58937,-122.586836,-122.58613,-122.5855,-122.583961,-122.57905,-122.571309,-122.570126,-122.568617,-122.565483,-122.558255,-122.55301,-122.548002,-122.547638,-122.537618,-122.532488,-122.530085,-122.527468,-122.517067,-122.514243,-122.510439,-122.507261,-122.504364,-122.501787,-122.501043,-122.499336,-122.496748,-122.486584,-122.485866,-122.479942,-122.47555,-122.474558,-122.47253,-122.468001,-122.466639,-122.45466,-122.447789,-122.443966,-122.439145,-122.414457,-122.41397,-122.403758,-122.389346,-122.383141,-122.372796,-122.372096,-122.357752,-122.348315,-122.342882,-122.316084,-122.305836,-122.2727,-122.263944,-122.249828,-122.249969,-122.166674,-122.147212,-122.126545,-122.126544,-122.085981,-122.004194,-121.983147,-121.983148,-121.821956,-121.821959,-121.819587,-121.815501,-121.814319,-121.810726,-121.806845,-121.805977,-121.807559,-121.807583,-121.80559,-121.805791,-121.807908,-121.806939,-121.806916,-121.80456,-121.802589,-121.799679,-121.796434,-121.794539,-121.793651,-121.792696,-121.790802,-121.785633,-121.783928,-121.780122,-121.776204,-121.773181,-121.766144,-121.762165,-121.756938,-121.744622,-121.738405,-121.735074,-121.732298,-121.730946,-121.726508,-121.72419,-121.723201,-121.720904,-121.716979,-121.714579,-121.708575,-121.705532,-121.704123,-121.700473,-121.699988,-121.698113,-121.696925,-121.69756,-121.700209,-121.699231,-121.700709,-121.700918,-121.702141,-121.70123,-121.701957,-121.703546,-121.70326,-121.704223,-121.704567,-121.703592,-121.702846,-121.70326,-121.702476,-121.700932,-121.698691,-121.697615,-121.693809,-121.691752,-121.689975,-121.688772,-121.687276,-121.687945,-121.685262,-121.683547,-121.68159,-121.679081,-121.679232,-121.680813,-121.679888,-121.68,-121.681973,-121.684562,-121.68505,-121.685033,-121.687532,-121.689008,-121.690481,-121.690732,-121.692134,-121.695032,-121.696479,-121.696411,-121.691878,-121.689261,-121.680898,-121.682463,-121.681537,-121.684793,-121.685304,-121.686262,-121.684475,-121.682607,-121.685082,-121.689772,-121.691112,-121.697685,-121.698375,-121.69945,-121.703592,-121.705971,-121.709251,-121.710517,-121.711275,-121.712953,-121.714469,-121.715592,-121.719697,-121.727341,-121.73048,-121.73492,-121.736292,-121.738512,-121.741175,-121.74687,-121.748245,-121.749061,-121.748649,-121.747973,-121.746454,-121.743454,-121.740329,-121.738794,-121.736506,-121.733403,-121.732018,-121.731438,-121.730168,-121.729226,-121.728533,-121.727194,-121.725283,-121.723999,-121.718675,-121.715716,-121.712219,-121.711596,-121.710503,-121.710201,-121.71065,-121.710291,-121.708402,-121.70805,-121.706179,-121.702383,-121.700208,-121.69865,-121.699675,-121.696085,-121.695074,-121.693387,-121.69088,-121.687776,-121.685005,-121.682723,-121.677722,-121.667021,-121.665717,-121.664694,-121.662881,-121.662382,-121.662415,-121.661656,-121.660444,-121.657245,-121.653866,-121.652638,-121.652581,-121.653315,-121.652732,-121.651394,-121.652018,-121.653593,-121.656909,-121.659639,-121.660828,-121.660419,-121.66043,-121.65871,-121.660852,-121.672405,-121.680346,-121.683277,-121.688164,-121.691214,-121.693396,-121.696035,-121.697656,-121.698143,-121.699939,-121.707639,-121.710813,-121.714462,-121.715266,-121.722584,-121.722407,-121.718977,-121.718681,-121.716996,-121.717652,-121.720814,-121.725175,-121.730625,-121.735545,-121.737791,-121.740994,-121.744103,-121.749443,-121.751454,-121.752152,-121.755915,-121.766495,-121.770738,-121.778672,-121.779906,-121.781727,-121.78183,-121.779672,-121.779132,-121.778803,-121.781121,-121.781588,-121.781098,-121.781958,-121.784556,-121.788805,-121.793219,-121.798154,-121.80044,-121.804426,-121.805269,-121.805667,-121.804406,-121.803163,-121.802547,-121.803471,-121.802935,-121.801623,-121.802626,-121.803345,-121.800131,-121.798684,-121.798502,-121.79603,-121.794783,-121.792475,-121.792162,-121.791112,-121.787787,-121.786147,-121.785593,-121.785612,-121.786735,-121.790661,-121.796127,-121.79511,-121.789703,-121.787028,-121.78285,-121.77977,-121.777156,-121.773775,-121.772236,-121.766527,-121.764083,-121.76256,-121.760379,-121.754124,-121.752417,-121.748452,-121.745436,-121.744453,-121.744585,-121.747324,-121.747297,-121.742614,-121.738297,-121.735372,-121.732821,-121.728994,-121.723005,-121.71456,-121.714854,-121.715592,-121.71822,-121.723013,-121.724519,-121.726138,-121.728208,-121.730737,-121.734396,-121.735253,-121.734223,-121.765322,-121.806706,-122.257482,-122.317709,-122.378871,-122.388999,-122.401021,-122.399655,-122.396057,-122.393936,-122.393227,-122.394475,-122.39354,-122.394498,-122.394349,-122.395774,-122.399554,-122.401663,-122.404145,-122.407737,-122.410428,-122.413982,-122.422733,-122.423551,-122.426441,-122.429684,-122.435193,-122.436643,-122.439655,-122.441487,-122.445521,-122.446968,-122.450045,-122.453594,-122.455185,-122.4585,-122.464204,-122.466492,-122.47126,-122.475125,-122.480324,-122.483507,-122.48619,-122.487974,-122.492889,-122.495627,-122.496329,-122.499167,-122.500908,-122.505316,-122.506406,-122.508106,-122.511494,-122.515898,-122.51585,-122.516997,-122.517542,-122.518934,-122.522276,-122.523985,-122.526335,-122.527397,-122.52966,-122.532858,-122.535472,-122.536946,-122.540368,-122.540574,-122.542187,-122.543205,-122.545409,-122.546099,-122.548613,-122.549216,-122.550897,-122.552009,-122.551783,-122.553144,-122.554761,-122.556847,-122.555943,-122.557935,-122.559757,-122.558937,-122.560126,-122.561605,-122.56115,-122.562859,-122.56507,-122.56476,-122.565592,-122.567212,-122.566342,-122.567385,-122.568801,-122.571483,-122.573,-122.576221,-122.579862,-122.58168,-122.586299,-122.588868,-122.592472,-122.594954,-122.595491,-122.593133,-122.594367,-122.593682,-122.593818,-122.594626,-122.593197,-122.593483,-122.593502,-122.594702,-122.593535,-122.595636,-122.594796,-122.595829,-122.59552,-122.599078,-122.602164,-122.609216,-122.61168,-122.616241,-122.618649,-122.623428,-122.626492,-122.629512,-122.631083,-122.633939,-122.635839,-122.63866,-122.639844,-122.643168,-122.644197,-122.646144,-122.647963,-122.649252,-122.650233,-122.653581,-122.657523,-122.658507,-122.660029,-122.662537,-122.666038,-122.669637,-122.673705,-122.677361,-122.677936,-122.68152,-122.681147,-122.685747,-122.689571,-122.69464,-122.699104,-122.700829,-122.705237,-122.704641,-122.70536,-122.707425,-122.707287,-122.711949,-122.714132,-122.717097,-122.718753,-122.717886,-122.720723,-122.721141,-122.719677,-122.722655,-122.723727,-122.725293,-122.725607,-122.729745,-122.729595,-122.732936,-122.736633,-122.737647,-122.739652,-122.740594,-122.743301,-122.744146,-122.745578,-122.746317,-122.748307,-122.749968,-122.748752,-122.74984,-122.752579,-122.753353,-122.755755,-122.757254,-122.760276,-122.760977,-122.762126,-122.763246,-122.763984,-122.765164,-122.764789,-122.765616,-122.766302,-122.767681,-122.766995,-122.769068,-122.7707,-122.773366,-122.773903,-122.775889,-122.774314,-122.776307,-122.776942,-122.775718,-122.776187,-122.777586,-122.777663,-122.781786,-122.782827,-122.782815,-122.785493,-122.786549,-122.788505,-122.786627,-122.78538,-122.786313,-122.784888,-122.780824,-122.779965,-122.781352,-122.780652,-122.782013,-122.782884,-122.78211,-122.779564,-122.780383,-122.779835,-122.778455,-122.778553,-122.776847,-122.776907,-122.775109,-122.774156,-122.772894,-122.772035,-122.770026,-122.772065,-122.773305,-122.774752,-122.773688,-122.771475,-122.769712,-122.768112,-122.766605,-122.763332,-122.762055,-122.760535,-122.759894,-122.7619,-122.756883,-122.756696,-122.759303,-122.757657,-122.756386,-122.754149,-122.756842,-122.75439,-122.752463,-122.751894,-122.752724,-122.756569,-122.757844,-122.760134,-122.760358,-122.754911,-122.756151,-122.757919,-122.758214,-122.756239,-122.7544,-122.753184,-122.753841,-122.756522,-122.753884,-122.753413,-122.755088,-122.756638,-122.759434,-122.760415,-122.759871,-122.757517,-122.755534,-122.75652,-122.753163,-122.751459,-122.751833,-122.754896,-122.754437,-122.751348,-122.751611,-122.749815,-122.750561,-122.750461,-122.752691,-122.754369,-122.753159,-122.753648,-122.75639,-122.757403,-122.758803,-122.759494,-122.758267,-122.75582,-122.757473,-122.754592,-122.752483,-122.752237,-122.753886,-122.753387,-122.748307,-122.747358,-122.748557,-122.745399,-122.747201,-122.748091,-122.746621,-122.747151,-122.746712,-122.748913,-122.749779,-122.752533,-122.75186,-122.748109,-122.747274,-122.746774,-122.74563,-122.745299,-122.747765,-122.749821,-122.750085,-122.750739,-122.749784,-122.747736,-122.749131,-122.75124,-122.750248,-122.751948,-122.749958,-122.749828,-122.751113,-122.750062,-122.747134,-122.747534,-122.745653,-122.744481,-122.744258,-122.743964,-122.743741,-122.743598,-122.743512,-122.743481,-122.743483,-122.74445,-122.742709,-122.74112,-122.741516,-122.738988,-122.73926,-122.784756,-122.784857,-122.784898,-122.7849,-122.832856,-122.834576,-122.834765,-122.837929,-122.842326,-122.846224,-122.84674,-122.849872,-122.849925,-122.868073,-122.867891],"lat":[45.317345,45.317273,45.317228,45.317192,45.328151,45.34595,45.346154,45.346133,45.346249,45.346233,45.346276,45.34566,45.331772,45.33182,45.33182,45.331825,45.331909,45.331928,45.331994,45.332045,45.332067,45.346587,45.353992,45.355871,45.359577,45.371751,45.372181,45.375538,45.377431,45.381513,45.386122,45.386845,45.387483,45.391704,45.393033,45.396544,45.402592,45.402702,45.404972,45.406149,45.407918,45.415311,45.418855,45.421046,45.426072,45.433294,45.433268,45.433238,45.433199,45.43324,45.433167,45.433137,45.433135,45.433113,45.433079,45.433056,45.433042,45.433037,45.433038,45.433056,45.433041,45.433041,45.433041,45.43301,45.432841,45.432841,45.432867,45.432795,45.432792,45.432743,45.432743,45.432702,45.432668,45.432718,45.432811,45.436059,45.439584,45.441424,45.443983,45.445281,45.445741,45.453242,45.454341,45.457819,45.458066,45.458314,45.458318,45.458669,45.458671,45.461482,45.461476,45.461474,45.46155,45.461451,45.461444,45.461451,45.460908,45.460933,45.460832,45.460889,45.461473,45.461481,45.461493,45.461501,45.461505,45.461493,45.461488,45.461486,45.461464,45.461454,45.461453,45.461453,45.461457,45.461457,45.461457,45.461458,45.461458,45.461458,45.46149,45.461522,45.461483,45.461487,45.461494,45.461518,45.461392,45.46138,45.461365,45.461307,45.461062,45.461053,45.461045,45.461058,45.461353,45.461318,45.461296,45.461273,45.461262,45.46126,45.461256,45.461252,45.461187,45.461107,45.46107,45.461028,45.460982,45.461132,45.461138,45.461176,45.461183,45.461184,45.461173,45.461135,45.461127,45.460941,45.460974,45.461001,45.461134,45.461579,45.461581,45.461421,45.4613,45.461276,45.46123,45.461222,45.461426,45.461502,45.461529,45.46149,45.461439,45.461394,45.461412,45.461422,45.460935,45.460837,45.460828,45.460039,45.461299,45.46058,45.461534,45.461403,45.460237,45.460226,45.461674,45.461675,45.459678,45.457968,45.455518,45.454649,45.451832,45.450143,45.448983,45.444307,45.443096,45.442561,45.440485,45.435494,45.432929,45.431927,45.427854,45.427171,45.424228,45.418572,45.415174,45.415202,45.412164,45.4101,45.407275,45.402672,45.402457,45.403433,45.402844,45.401105,45.397261,45.397131,45.395664,45.395593,45.394798,45.393784,45.393648,45.39177,45.3894,45.387131,45.386754,45.383619,45.383545,45.381733,45.378531,45.376309,45.373838,45.373564,45.371963,45.369899,45.368338,45.366277,45.364545,45.363389,45.356172,45.35187,45.349016,45.346629,45.344448,45.339223,45.338957,45.334258,45.331267,45.329188,45.327889,45.323929,45.322947,45.321348,45.319453,45.316379,45.309477,45.306251,45.30503,45.30306,45.300714,45.299775,45.297177,45.295895,45.294816,45.292672,45.290025,45.287942,45.286259,45.283681,45.281798,45.279234,45.276153,45.275625,45.271641,45.268412,45.263859,45.25792,45.255359,45.254141,45.251348,45.250581,45.247204,45.243495,45.240067,45.235873,45.233301,45.230368,45.228988,45.228409,45.22965,45.229558,45.227391,45.226448,45.224054,45.2233,45.221466,45.21998,45.21847,45.215347,45.212368,45.21133,45.210941,45.211691,45.212044,45.211543,45.208963,45.206919,45.206156,45.206788,45.205997,45.2051,45.197559,45.1918,45.188995,45.18635,45.183795,45.182227,45.180374,45.176313,45.174913,45.170913,45.170633,45.170314,45.168594,45.164721,45.161556,45.159339,45.158354,45.156838,45.154039,45.153424,45.152824,45.150597,45.148733,45.143283,45.14039,45.137271,45.134055,45.131594,45.129102,45.127066,45.123789,45.12179,45.118883,45.117392,45.116934,45.11806,45.122474,45.12369,45.123572,45.12236,45.120519,45.11972,45.115172,45.114456,45.11335,45.107592,45.105425,45.104415,45.103177,45.102852,45.101992,45.099886,45.098582,45.097111,45.088803,45.086706,45.084943,45.082515,45.079635,45.075258,45.073623,45.069473,45.066355,45.066362,45.067683,45.068111,45.068012,45.067109,45.065692,45.06365,45.062866,45.061626,45.059579,45.05852,45.057054,45.055912,45.053214,45.051756,45.045432,45.044095,45.042325,45.039285,45.038037,45.037566,45.036915,45.036784,45.036182,45.034668,45.033616,45.034428,45.03385,45.034098,45.034836,45.036162,45.037218,45.03958,45.039837,45.037277,45.035136,45.034399,45.033698,45.031646,45.030126,45.026237,45.021486,45.018144,45.016312,45.015214,45.015132,45.016028,45.017471,45.01615,45.015183,45.012877,45.011496,45.006124,45.002217,44.999614,44.995386,44.992173,44.987321,44.982743,44.981021,44.977103,44.976452,44.974963,44.973167,44.970487,44.964926,44.959666,44.95786,44.956569,44.95477,44.952248,44.950377,44.947412,44.945223,44.941371,44.937426,44.935668,44.934682,44.935457,44.935654,44.935153,44.936857,44.938213,44.93984,44.941721,44.941952,44.941233,44.938447,44.932036,44.93057,44.927539,44.923042,44.920925,44.91983,44.917166,44.914636,44.912122,44.910179,44.907761,44.906819,44.904814,44.906315,44.90613,44.90277,44.900018,44.89745,44.896167,44.895375,44.893142,44.891348,44.890799,44.88931,44.888473,44.88572,44.885719,44.88572,44.88572,44.88572,44.885716,44.88572,44.88572,44.886262,44.889461,44.890411,44.891673,44.893745,44.895326,44.896804,44.899106,44.901513,44.904077,44.903796,44.904679,44.905012,44.903207,44.903949,44.904154,44.903461,44.903142,44.902029,44.903297,44.90295,44.90407,44.903958,44.906108,44.908139,44.910375,44.911579,44.913152,44.915212,44.916363,44.915471,44.917318,44.918395,44.921567,44.921549,44.922659,44.921358,44.920914,44.919965,44.919034,44.917781,44.918567,44.918332,44.91951,44.919599,44.922628,44.927857,44.929833,44.930043,44.932797,44.933534,44.934565,44.935681,44.936046,44.935156,44.935035,44.937446,44.936684,44.939975,44.943562,44.945139,44.945665,44.948872,44.949182,44.950115,44.950425,44.954172,44.954646,44.95626,44.957953,44.959177,44.959405,44.961426,44.962863,44.963588,44.965195,44.967159,44.969355,44.970562,44.971395,44.973208,44.973904,44.975131,44.977266,44.978628,44.980206,44.982564,44.983735,44.98521,44.985101,44.986044,44.985983,44.988407,44.988748,44.989629,44.988875,44.99089,44.992781,44.995429,44.996424,44.997588,45.00001,45.00081,45.003442,45.004531,45.006866,45.009501,45.012247,45.013907,45.016304,45.017789,45.01962,45.020549,45.021784,45.021866,45.024354,45.025,45.026964,45.028271,45.028355,45.030057,45.032175,45.033795,45.033418,45.031682,45.031442,45.032126,45.03377,45.033754,45.032445,45.032454,45.035844,45.035458,45.035768,45.035877,45.037081,45.038637,45.043633,45.046532,45.047052,45.046514,45.046314,45.047789,45.050296,45.052439,45.053471,45.054055,45.055997,45.057489,45.05929,45.061008,45.061957,45.062479,45.064479,45.067162,45.069124,45.069888,45.072405,45.074183,45.0758,45.077761,45.079641,45.081425,45.083141,45.082868,45.085653,45.087275,45.088244,45.092173,45.093478,45.094204,45.094286,45.095987,45.096291,45.098606,45.099676,45.102757,45.102063,45.103315,45.105482,45.10772,45.107061,45.110084,45.110444,45.111851,45.111575,45.112905,45.112597,45.113867,45.112386,45.11301,45.114389,45.115813,45.114627,45.114868,45.115745,45.1167,45.118255,45.117758,45.119241,45.118832,45.120228,45.121021,45.121981,45.122449,45.123511,45.123531,45.122446,45.124861,45.124528,45.126177,45.127566,45.129344,45.130356,45.130538,45.132497,45.133732,45.135904,45.137743,45.139388,45.140148,45.141555,45.141717,45.143852,45.145019,45.146571,45.147702,45.148922,45.149192,45.151118,45.151644,45.153233,45.153446,45.155281,45.155645,45.157689,45.159421,45.159579,45.160965,45.16182,45.163454,45.163004,45.16167,45.163073,45.163304,45.167946,45.169203,45.169575,45.170901,45.171984,45.172802,45.174712,45.175159,45.177512,45.178058,45.177444,45.179577,45.180131,45.18098,45.182194,45.18265,45.182445,45.183093,45.182647,45.183565,45.184699,45.186249,45.185891,45.186873,45.187131,45.186135,45.187517,45.18822,45.188847,45.189178,45.190158,45.191576,45.191249,45.189771,45.19142,45.194733,45.195719,45.19542,45.193098,45.19176,45.192758,45.193742,45.195927,45.196745,45.195862,45.194701,45.194959,45.197682,45.199202,45.200024,45.199926,45.201089,45.201832,45.202085,45.200599,45.200705,45.203317,45.205555,45.20697,45.209145,45.208981,45.209758,45.210801,45.21165,45.212319,45.211034,45.212283,45.214153,45.215953,45.217883,45.22069,45.221665,45.223337,45.225199,45.227217,45.229017,45.228835,45.23017,45.231213,45.231025,45.229255,45.230095,45.232772,45.233478,45.231969,45.233603,45.235042,45.236119,45.235692,45.238205,45.238406,45.24053,45.242542,45.243364,45.244329,45.245342,45.247278,45.249281,45.252235,45.252059,45.250772,45.250775,45.250826,45.250906,45.250982,45.251193,45.251356,45.251553,45.253319,45.256638,45.257031,45.258664,45.259532,45.259532,45.259575,45.261833,45.273887,45.274069,45.274053,45.274058,45.273822,45.26955,45.265657,45.261773,45.261388,45.259717,45.259697,45.259695,45.317345]}]],[[{"lng":[-123.180908,-123.180532,-123.178468,-123.174215,-123.170891,-123.16781,-123.1616,-123.155436,-123.152597,-123.149402,-123.147924,-123.147995,-123.146617,-123.144973,-123.141485,-123.13733,-123.134498,-123.13309,-123.132383,-123.13017,-123.128245,-123.125287,-123.123769,-123.120462,-123.116542,-123.11321,-123.108792,-123.107108,-123.108165,-123.110396,-123.1123,-123.112769,-123.111472,-123.109725,-123.105091,-123.093008,-123.091347,-123.082998,-123.081694,-123.076574,-123.072813,-123.071687,-123.06993,-123.067478,-123.062005,-123.060074,-123.054933,-123.0496,-123.044433,-123.043631,-123.042906,-123.042127,-123.04148,-123.039822,-123.038095,-123.037897,-123.038923,-123.037566,-123.036985,-123.037316,-123.037807,-123.037779,-123.037594,-123.037374,-123.037897,-123.040164,-123.040529,-123.040853,-123.041717,-123.042938,-123.047081,-123.051824,-123.053762,-123.05465,-123.055299,-123.058089,-123.064261,-123.065415,-123.066938,-123.068685,-123.069219,-123.071977,-123.074723,-123.075577,-123.075174,-123.075113,-123.074284,-123.073539,-123.072732,-123.070654,-123.068975,-123.068849,-123.067835,-123.067043,-123.065974,-123.06603,-123.066732,-123.068079,-123.068271,-123.068627,-123.067619,-123.062251,-123.059397,-123.051936,-123.046115,-123.044916,-123.041478,-123.036121,-123.033439,-123.027643,-123.018118,-123.014574,-123.009998,-123.008255,-123.005564,-123.002309,-122.999042,-122.996444,-122.998002,-123.001054,-123.007494,-123.009878,-123.012235,-123.015037,-123.020187,-123.022368,-123.025303,-123.028136,-123.031177,-123.031676,-123.032027,-123.032467,-123.033292,-123.033173,-123.031407,-123.028875,-123.02705,-123.023019,-123.01801,-123.011513,-123.007346,-123.003569,-123.000726,-123.001883,-123.007746,-123.011189,-123.014505,-123.015382,-123.01624,-123.018862,-123.019124,-123.018777,-123.020521,-123.022219,-123.024949,-123.028675,-123.036649,-123.041321,-123.043892,-123.045896,-123.047009,-123.049662,-123.050918,-123.051106,-123.049012,-123.046867,-123.044146,-123.04117,-123.038475,-123.035667,-123.02609,-123.007632,-123.003867,-122.999659,-122.997737,-122.996221,-122.995366,-122.995576,-122.996087,-122.996469,-122.997702,-122.998455,-122.998984,-123.001527,-123.001497,-123.000788,-122.999811,-122.999265,-122.996046,-122.99097,-122.98831,-122.981086,-122.977037,-122.975052,-122.974937,-122.974957,-122.974911,-122.974699,-122.971659,-122.967579,-122.964021,-122.9623,-122.961195,-122.959922,-122.958818,-122.957273,-122.954429,-122.952144,-122.949691,-122.947317,-122.943419,-122.932081,-122.928984,-122.92513,-122.922836,-122.919112,-122.916561,-122.912621,-122.908708,-122.904219,-122.899528,-122.898048,-122.893198,-122.889006,-122.886812,-122.882494,-122.881015,-122.879136,-122.872906,-122.867179,-122.86352,-122.858823,-122.854691,-122.849925,-122.849872,-122.84674,-122.846224,-122.842326,-122.837929,-122.834765,-122.834576,-122.832856,-122.7849,-122.784898,-122.784857,-122.784756,-122.73926,-122.738988,-122.741516,-122.74112,-122.742709,-122.74445,-122.743483,-122.743481,-122.743512,-122.743598,-122.743741,-122.743964,-122.744258,-122.744481,-122.745653,-122.747534,-122.747134,-122.750062,-122.751113,-122.749828,-122.749958,-122.751948,-122.750248,-122.75124,-122.749131,-122.747736,-122.749784,-122.750739,-122.750085,-122.749821,-122.747765,-122.745299,-122.74563,-122.746774,-122.747274,-122.748109,-122.75186,-122.752533,-122.749779,-122.748913,-122.746712,-122.747151,-122.746621,-122.748091,-122.747201,-122.745399,-122.748557,-122.747358,-122.748307,-122.753387,-122.753886,-122.752237,-122.752483,-122.754592,-122.757473,-122.75582,-122.758267,-122.759494,-122.758803,-122.757403,-122.75639,-122.753648,-122.753159,-122.754369,-122.752691,-122.750461,-122.750561,-122.749815,-122.751611,-122.751348,-122.754437,-122.754896,-122.751833,-122.751459,-122.753163,-122.75652,-122.755534,-122.757517,-122.759871,-122.760415,-122.759434,-122.756638,-122.755088,-122.753413,-122.753884,-122.756522,-122.753841,-122.753184,-122.7544,-122.756239,-122.758214,-122.757919,-122.756151,-122.754911,-122.760358,-122.760134,-122.757844,-122.756569,-122.752724,-122.751894,-122.752463,-122.75439,-122.756842,-122.754149,-122.756386,-122.757657,-122.759303,-122.756696,-122.756883,-122.7619,-122.759894,-122.760535,-122.762055,-122.763332,-122.766605,-122.768112,-122.769712,-122.771475,-122.773688,-122.774752,-122.773305,-122.772065,-122.770026,-122.772035,-122.772894,-122.774156,-122.775109,-122.776907,-122.776847,-122.778553,-122.778455,-122.779835,-122.780383,-122.779564,-122.78211,-122.782884,-122.782013,-122.780652,-122.781352,-122.779965,-122.780824,-122.784888,-122.786313,-122.78538,-122.786627,-122.788505,-122.786549,-122.785493,-122.782815,-122.782827,-122.781786,-122.777663,-122.777586,-122.776187,-122.775718,-122.776942,-122.776307,-122.774314,-122.775889,-122.773903,-122.773366,-122.7707,-122.769068,-122.766995,-122.767681,-122.766302,-122.765616,-122.764789,-122.765164,-122.763984,-122.763246,-122.762126,-122.760977,-122.760276,-122.757254,-122.755755,-122.753353,-122.752579,-122.74984,-122.748752,-122.749968,-122.748307,-122.746317,-122.745578,-122.744146,-122.743301,-122.740594,-122.739652,-122.737647,-122.736633,-122.732936,-122.729595,-122.729745,-122.725607,-122.725293,-122.723727,-122.722655,-122.719677,-122.721141,-122.720723,-122.717886,-122.718753,-122.717097,-122.714132,-122.711949,-122.707287,-122.707425,-122.70536,-122.704641,-122.705237,-122.700829,-122.699104,-122.69464,-122.689571,-122.685747,-122.681147,-122.68152,-122.677936,-122.677361,-122.673705,-122.669637,-122.666038,-122.662537,-122.660029,-122.658507,-122.657523,-122.653581,-122.650233,-122.649252,-122.647963,-122.646144,-122.644197,-122.643168,-122.639844,-122.63866,-122.635839,-122.633939,-122.631083,-122.629512,-122.626492,-122.623428,-122.618649,-122.616241,-122.61168,-122.609216,-122.602164,-122.599078,-122.59552,-122.595829,-122.594796,-122.595636,-122.593535,-122.594702,-122.593502,-122.593483,-122.593197,-122.594626,-122.593818,-122.593682,-122.594367,-122.593133,-122.595491,-122.594954,-122.592472,-122.588868,-122.586299,-122.58168,-122.579862,-122.576221,-122.573,-122.571483,-122.568801,-122.567385,-122.566342,-122.567212,-122.565592,-122.56476,-122.56507,-122.562859,-122.56115,-122.561605,-122.560126,-122.558937,-122.559757,-122.557935,-122.555943,-122.556847,-122.554761,-122.553144,-122.551783,-122.552009,-122.550897,-122.549216,-122.548613,-122.546099,-122.545409,-122.543205,-122.542187,-122.540574,-122.540368,-122.536946,-122.535472,-122.532858,-122.52966,-122.527397,-122.526335,-122.523985,-122.522276,-122.518934,-122.517542,-122.516997,-122.51585,-122.515898,-122.511494,-122.508106,-122.506406,-122.505316,-122.500908,-122.499167,-122.496329,-122.495627,-122.492889,-122.487974,-122.48619,-122.483507,-122.480324,-122.475125,-122.47126,-122.466492,-122.464204,-122.4585,-122.455185,-122.453594,-122.450045,-122.446968,-122.445521,-122.441487,-122.439655,-122.436643,-122.435193,-122.429684,-122.426441,-122.423551,-122.422733,-122.413982,-122.410428,-122.407737,-122.404145,-122.401663,-122.399554,-122.395774,-122.394349,-122.394498,-122.39354,-122.394475,-122.393227,-122.393936,-122.396057,-122.399655,-122.401021,-122.388999,-122.378871,-122.317709,-122.257482,-121.806706,-121.765322,-121.734223,-121.733528,-121.736936,-121.739922,-121.746221,-121.747741,-121.747874,-121.750034,-121.753182,-121.751069,-121.748587,-121.742406,-121.741864,-121.742441,-121.745258,-121.746671,-121.750261,-121.752994,-121.753589,-121.759991,-121.76252,-121.764831,-121.767978,-121.775926,-121.781753,-121.787132,-121.790183,-121.792116,-121.796409,-121.803883,-121.808137,-121.812221,-121.811363,-121.810174,-121.813063,-121.813663,-121.816998,-121.820278,-121.819663,-121.820254,-121.817693,-121.816517,-121.816436,-121.817212,-121.817809,-121.819137,-121.817386,-121.813655,-121.81202,-121.810296,-121.80762,-121.806653,-121.804304,-121.804413,-121.801536,-121.798998,-121.796831,-121.795963,-121.79151,-121.789999,-121.784961,-121.783621,-121.779924,-121.778305,-121.776323,-121.773183,-121.772449,-121.771593,-121.769125,-121.769206,-121.76661,-121.763225,-121.761005,-121.759958,-121.762002,-121.768218,-121.772321,-121.775652,-121.774175,-121.780168,-121.782569,-121.788203,-121.788525,-121.79161,-121.792298,-121.795075,-121.797222,-121.800219,-121.799458,-121.802779,-121.804597,-121.802682,-121.798109,-121.79695,-121.794385,-121.795643,-121.79528,-121.795864,-121.795797,-121.796107,-121.796704,-121.797833,-121.798174,-121.802109,-121.802922,-121.800479,-121.797651,-121.796565,-121.797009,-121.796635,-121.795481,-121.793604,-121.793329,-121.790022,-121.788944,-121.787179,-121.788859,-121.793238,-121.794599,-121.799562,-121.963805,-121.964997,-121.966375,-121.967345,-121.971604,-121.973503,-121.974303,-121.977179,-121.980176,-121.981681,-121.984527,-121.992926,-121.996208,-121.999761,-122.001009,-122.003216,-122.005291,-122.008804,-122.011684,-122.015715,-122.016709,-122.01847,-122.020851,-122.024106,-122.026339,-122.028916,-122.030498,-122.033006,-122.034171,-122.03598,-122.040875,-122.045304,-122.046094,-122.047028,-122.050762,-122.054415,-122.056484,-122.058813,-122.060621,-122.063939,-122.065765,-122.068144,-122.069796,-122.071823,-122.074393,-122.075401,-122.077104,-122.081091,-122.08412,-122.086244,-122.088617,-122.09404,-122.096559,-122.100326,-122.103815,-122.107563,-122.108719,-122.110688,-122.11344,-122.118702,-122.119828,-122.119821,-122.121442,-122.122466,-122.124247,-122.128698,-122.130972,-122.132685,-122.138702,-122.14237,-122.149224,-122.152774,-122.154325,-122.156292,-122.161118,-122.164191,-122.166572,-122.171843,-122.174251,-122.178684,-122.179739,-122.184557,-122.189405,-122.193924,-122.196732,-122.198046,-122.198685,-122.199334,-122.204021,-122.207421,-122.210663,-122.21445,-122.218413,-122.220719,-122.222145,-122.224659,-122.22769,-122.23037,-122.231438,-122.23292,-122.237408,-122.23706,-122.242203,-122.245971,-122.246528,-122.247582,-122.250044,-122.253592,-122.255066,-122.255448,-122.259394,-122.261423,-122.264381,-122.269612,-122.271886,-122.273067,-122.274,-122.27376,-122.276675,-122.278591,-122.282872,-122.288569,-122.292897,-122.300164,-122.302935,-122.306909,-122.308786,-122.311568,-122.317447,-122.318858,-122.32137,-122.325742,-122.328534,-122.333374,-122.334685,-122.340708,-122.343213,-122.34955,-122.354329,-122.35614,-122.362732,-122.370076,-122.372462,-122.378629,-122.382079,-122.38863,-122.39138,-122.394416,-122.397991,-122.400882,-122.4027,-122.406298,-122.408208,-122.41,-122.41099,-122.411198,-122.410944,-122.410988,-122.411213,-122.412346,-122.419433,-122.423287,-122.428316,-122.431319,-122.435041,-122.436918,-122.44036,-122.441817,-122.442151,-122.443103,-122.443897,-122.454774,-122.457333,-122.46124,-122.469302,-122.473551,-122.475835,-122.475968,-122.475677,-122.477499,-122.480122,-122.484798,-122.487637,-122.496565,-122.503151,-122.50559,-122.511612,-122.519439,-122.520605,-122.520625,-122.52245,-122.522561,-122.52029,-122.521912,-122.531042,-122.532911,-122.536666,-122.538944,-122.541561,-122.542407,-122.546669,-122.553888,-122.56151,-122.564402,-122.56693,-122.568195,-122.568548,-122.569953,-122.5701,-122.572269,-122.576929,-122.582836,-122.597363,-122.599469,-122.603458,-122.607766,-122.61524,-122.618014,-122.620463,-122.621327,-122.627139,-122.634129,-122.639144,-122.64073,-122.645826,-122.65029,-122.653472,-122.660327,-122.66985,-122.670774,-122.677492,-122.680574,-122.683555,-122.690864,-122.694844,-122.696463,-122.700531,-122.705411,-122.713778,-122.715588,-122.719631,-122.721705,-122.724795,-122.726418,-122.727945,-122.729355,-122.732714,-122.737302,-122.743446,-122.748027,-122.753221,-122.757763,-122.759186,-122.762124,-122.763398,-122.765303,-122.768613,-122.773998,-122.778248,-122.779831,-122.783465,-122.787691,-122.793327,-122.794418,-122.800709,-122.804166,-122.803195,-122.805408,-122.807949,-122.812321,-122.813636,-122.813769,-122.815899,-122.819465,-122.821487,-122.825426,-122.828925,-122.832797,-122.839136,-122.839763,-122.842851,-122.845145,-122.847178,-122.848492,-122.846935,-122.8471,-122.849696,-122.852323,-122.856157,-122.861237,-122.864965,-122.868847,-122.871689,-122.873219,-122.873245,-122.87453,-122.882731,-122.884958,-122.890258,-122.891829,-122.892398,-122.895184,-122.897648,-122.899397,-122.900612,-122.902456,-122.90538,-122.906842,-122.909232,-122.909888,-122.913298,-122.916886,-122.919518,-122.919464,-122.922578,-122.925638,-122.928097,-122.929887,-122.929381,-122.931922,-122.93408,-122.937846,-122.943228,-122.947659,-122.949349,-122.955481,-122.957256,-122.962703,-122.964661,-122.969086,-122.971694,-122.97265,-122.97364,-122.973993,-122.973649,-122.974427,-122.975862,-122.979769,-122.985042,-122.986746,-122.988675,-122.990027,-122.991695,-122.993648,-122.996175,-122.998293,-122.997623,-122.996025,-122.996297,-122.998717,-123.000013,-123.001831,-123.004903,-123.005477,-123.006847,-123.007595,-123.010604,-123.01133,-123.012491,-123.013065,-123.01383,-123.014599,-123.015982,-123.018107,-123.018367,-123.018598,-123.018734,-123.018747,-123.018679,-123.017345,-123.016551,-123.015765,-123.015049,-123.014433,-123.013824,-123.013866,-123.01474,-123.01509,-123.015148,-123.015825,-123.016667,-123.018153,-123.019999,-123.024002,-123.027127,-123.031884,-123.034095,-123.035804,-123.03941,-123.041567,-123.042756,-123.041897,-123.039451,-123.039828,-123.039988,-123.040809,-123.041354,-123.042037,-123.043527,-123.044987,-123.050025,-123.053026,-123.055342,-123.060106,-123.061853,-123.061431,-123.060721,-123.061117,-123.062154,-123.066818,-123.07173,-123.076375,-123.078903,-123.081389,-123.086457,-123.089503,-123.092658,-123.095772,-123.099242,-123.100881,-123.105377,-123.106032,-123.107712,-123.111578,-123.113025,-123.118721,-123.120253,-123.119733,-123.120155,-123.123007,-123.12769,-123.133831,-123.13696,-123.139759,-123.142191,-123.143843,-123.145463,-123.147833,-123.148411,-123.148333,-123.14752,-123.145812,-123.144012,-123.140101,-123.137656,-123.133628,-123.132924,-123.131328,-123.129627,-123.128571,-123.126787,-123.125807,-123.124779,-123.122064,-123.117983,-123.110229,-123.102131,-123.097713,-123.095698,-123.09199,-123.091349,-123.091479,-123.093335,-123.101167,-123.103566,-123.109462,-123.1114,-123.118528,-123.126252,-123.131734,-123.140136,-123.143754,-123.149254,-123.151364,-123.152849,-123.154541,-123.158928,-123.166472,-123.169856,-123.173863,-123.17778,-123.179387,-123.179555,-123.179677,-123.179758,-123.179829,-123.18001,-123.180117,-123.179881,-123.179857,-123.180122,-123.180944,-123.180908],"lat":[44.857553,44.858765,44.861006,44.863534,44.864462,44.864022,44.861579,44.860009,44.860059,44.861254,44.863181,44.866795,44.870722,44.877305,44.88374,44.887259,44.889368,44.891904,44.894683,44.90073,44.904764,44.909273,44.910536,44.912185,44.913242,44.914782,44.917505,44.920337,44.92249,44.923826,44.926012,44.928728,44.930161,44.930863,44.93044,44.930541,44.930297,44.927167,44.926878,44.926914,44.927686,44.928107,44.92905,44.932214,44.936207,44.937885,44.940694,44.942701,44.944231,44.94495,44.945975,44.947098,44.948114,44.95165,44.95657,44.958779,44.961154,44.965581,44.967428,44.972795,44.975841,44.977463,44.979621,44.981139,44.984421,44.988153,44.988502,44.98877,44.989381,44.990026,44.991041,44.990302,44.989928,44.989868,44.989826,44.989368,44.989778,44.990718,44.995005,44.998378,45.000505,45.008897,45.012533,45.014513,45.017489,45.021657,45.02584,45.031314,45.033397,45.036599,45.041493,45.046709,45.054188,45.060738,45.068042,45.069102,45.071438,45.074288,45.074864,45.076586,45.078925,45.082673,45.083942,45.086332,45.089197,45.090273,45.094073,45.097729,45.098953,45.100555,45.100961,45.101967,45.105444,45.107235,45.111091,45.11311,45.114694,45.117631,45.120604,45.123249,45.127319,45.129273,45.133769,45.136757,45.138747,45.139431,45.140185,45.141313,45.144303,45.144999,45.145564,45.146614,45.150825,45.153831,45.15794,45.160852,45.161894,45.162905,45.162765,45.160252,45.159498,45.161321,45.16452,45.167365,45.170955,45.173053,45.175796,45.177017,45.181566,45.189247,45.191003,45.19584,45.199841,45.201121,45.202051,45.201943,45.199434,45.198918,45.199481,45.201105,45.204744,45.207266,45.209391,45.211305,45.214705,45.216583,45.21828,45.220788,45.222272,45.222789,45.223224,45.222137,45.22217,45.223696,45.226947,45.230698,45.233981,45.237426,45.238305,45.238752,45.239953,45.241311,45.242731,45.254877,45.257284,45.259347,45.26085,45.261554,45.264811,45.267714,45.268761,45.271011,45.273321,45.276226,45.276928,45.278081,45.279143,45.279979,45.283041,45.285083,45.284894,45.28388,45.282982,45.281837,45.280509,45.278695,45.273639,45.270488,45.26826,45.267485,45.267586,45.268499,45.268621,45.268635,45.268509,45.268065,45.267445,45.266203,45.262835,45.259435,45.256719,45.256622,45.257798,45.257491,45.256531,45.255211,45.254827,45.254425,45.253827,45.252972,45.253084,45.254719,45.257252,45.259697,45.259717,45.261388,45.261773,45.265657,45.26955,45.273822,45.274058,45.274053,45.274069,45.273887,45.261833,45.259575,45.259532,45.259532,45.258664,45.257031,45.256638,45.253319,45.251553,45.251356,45.251193,45.250982,45.250906,45.250826,45.250775,45.250772,45.252059,45.252235,45.249281,45.247278,45.245342,45.244329,45.243364,45.242542,45.24053,45.238406,45.238205,45.235692,45.236119,45.235042,45.233603,45.231969,45.233478,45.232772,45.230095,45.229255,45.231025,45.231213,45.23017,45.228835,45.229017,45.227217,45.225199,45.223337,45.221665,45.22069,45.217883,45.215953,45.214153,45.212283,45.211034,45.212319,45.21165,45.210801,45.209758,45.208981,45.209145,45.20697,45.205555,45.203317,45.200705,45.200599,45.202085,45.201832,45.201089,45.199926,45.200024,45.199202,45.197682,45.194959,45.194701,45.195862,45.196745,45.195927,45.193742,45.192758,45.19176,45.193098,45.19542,45.195719,45.194733,45.19142,45.189771,45.191249,45.191576,45.190158,45.189178,45.188847,45.18822,45.187517,45.186135,45.187131,45.186873,45.185891,45.186249,45.184699,45.183565,45.182647,45.183093,45.182445,45.18265,45.182194,45.18098,45.180131,45.179577,45.177444,45.178058,45.177512,45.175159,45.174712,45.172802,45.171984,45.170901,45.169575,45.169203,45.167946,45.163304,45.163073,45.16167,45.163004,45.163454,45.16182,45.160965,45.159579,45.159421,45.157689,45.155645,45.155281,45.153446,45.153233,45.151644,45.151118,45.149192,45.148922,45.147702,45.146571,45.145019,45.143852,45.141717,45.141555,45.140148,45.139388,45.137743,45.135904,45.133732,45.132497,45.130538,45.130356,45.129344,45.127566,45.126177,45.124528,45.124861,45.122446,45.123531,45.123511,45.122449,45.121981,45.121021,45.120228,45.118832,45.119241,45.117758,45.118255,45.1167,45.115745,45.114868,45.114627,45.115813,45.114389,45.11301,45.112386,45.113867,45.112597,45.112905,45.111575,45.111851,45.110444,45.110084,45.107061,45.10772,45.105482,45.103315,45.102063,45.102757,45.099676,45.098606,45.096291,45.095987,45.094286,45.094204,45.093478,45.092173,45.088244,45.087275,45.085653,45.082868,45.083141,45.081425,45.079641,45.077761,45.0758,45.074183,45.072405,45.069888,45.069124,45.067162,45.064479,45.062479,45.061957,45.061008,45.05929,45.057489,45.055997,45.054055,45.053471,45.052439,45.050296,45.047789,45.046314,45.046514,45.047052,45.046532,45.043633,45.038637,45.037081,45.035877,45.035768,45.035458,45.035844,45.032454,45.032445,45.033754,45.03377,45.032126,45.031442,45.031682,45.033418,45.033795,45.032175,45.030057,45.028355,45.028271,45.026964,45.025,45.024354,45.021866,45.021784,45.020549,45.01962,45.017789,45.016304,45.013907,45.012247,45.009501,45.006866,45.004531,45.003442,45.00081,45.00001,44.997588,44.996424,44.995429,44.992781,44.99089,44.988875,44.989629,44.988748,44.988407,44.985983,44.986044,44.985101,44.98521,44.983735,44.982564,44.980206,44.978628,44.977266,44.975131,44.973904,44.973208,44.971395,44.970562,44.969355,44.967159,44.965195,44.963588,44.962863,44.961426,44.959405,44.959177,44.957953,44.95626,44.954646,44.954172,44.950425,44.950115,44.949182,44.948872,44.945665,44.945139,44.943562,44.939975,44.936684,44.937446,44.935035,44.935156,44.936046,44.935681,44.934565,44.933534,44.932797,44.930043,44.929833,44.927857,44.922628,44.919599,44.91951,44.918332,44.918567,44.917781,44.919034,44.919965,44.920914,44.921358,44.922659,44.921549,44.921567,44.918395,44.917318,44.915471,44.916363,44.915212,44.913152,44.911579,44.910375,44.908139,44.906108,44.903958,44.90407,44.90295,44.903297,44.902029,44.903142,44.903461,44.904154,44.903949,44.903207,44.905012,44.904679,44.903796,44.904077,44.901513,44.899106,44.896804,44.895326,44.893745,44.891673,44.890411,44.889461,44.886262,44.88572,44.88572,44.885716,44.88572,44.88572,44.88572,44.885719,44.88572,44.882059,44.879812,44.876673,44.875394,44.872298,44.869565,44.864573,44.86124,44.856706,44.855163,44.853292,44.847398,44.845514,44.841401,44.837387,44.832677,44.829919,44.828908,44.82543,44.824633,44.820267,44.819734,44.819846,44.818958,44.815469,44.815433,44.813004,44.812002,44.81217,44.811634,44.811574,44.807869,44.806377,44.805407,44.80399,44.803173,44.800134,44.795847,44.79466,44.793037,44.792964,44.792548,44.791602,44.790637,44.7898,44.786813,44.784404,44.781509,44.78228,44.782159,44.780597,44.779078,44.777548,44.779277,44.778183,44.776675,44.772848,44.772311,44.773281,44.771856,44.772641,44.775543,44.77555,44.77416,44.775636,44.775136,44.772141,44.769993,44.769111,44.766914,44.767292,44.765293,44.762326,44.760886,44.76137,44.759964,44.754074,44.752723,44.750464,44.748893,44.748232,44.747845,44.746259,44.744269,44.741882,44.738266,44.735456,44.732713,44.730793,44.729236,44.729116,44.727671,44.727148,44.725896,44.724655,44.72052,44.716295,44.71558,44.714547,44.714077,44.713842,44.713707,44.711741,44.710685,44.703088,44.70078,44.699309,44.69837,44.698304,44.69753,44.696291,44.6946,44.6928,44.690417,44.689291,44.687063,44.685153,44.683929,44.683915,44.683888,44.684129,44.685564,44.685483,44.689168,44.691926,44.692141,44.691065,44.693635,44.693787,44.69226,44.689704,44.690406,44.687755,44.687445,44.68911,44.688618,44.686724,44.687317,44.690576,44.690836,44.690819,44.689988,44.690218,44.689948,44.688861,44.687201,44.685691,44.685799,44.687338,44.688084,44.688263,44.688731,44.692286,44.692841,44.692955,44.693644,44.697043,44.697513,44.696384,44.696426,44.697193,44.697478,44.698365,44.700448,44.700734,44.700608,44.698712,44.699471,44.702147,44.702552,44.704358,44.705825,44.707154,44.707611,44.706996,44.707172,44.708855,44.710107,44.710977,44.71193,44.713165,44.714143,44.715879,44.717151,44.718001,44.718005,44.721143,44.725179,44.7261,44.726127,44.724254,44.719643,44.717671,44.717039,44.715565,44.71368,44.713151,44.710244,44.708729,44.707001,44.705819,44.703685,44.703152,44.703218,44.700798,44.696784,44.69617,44.697184,44.695977,44.696236,44.694456,44.693239,44.694399,44.695981,44.696937,44.697071,44.697668,44.698465,44.70099,44.705106,44.706416,44.713068,44.717246,44.719361,44.720745,44.722005,44.722504,44.723565,44.725706,44.728796,44.729275,44.73179,44.732929,44.734203,44.735506,44.738496,44.741007,44.746135,44.747099,44.750634,44.753062,44.753979,44.754257,44.75525,44.75549,44.75611,44.75621,44.758914,44.759289,44.758822,44.758759,44.756705,44.756323,44.755412,44.755972,44.756864,44.75804,44.75766,44.757225,44.757428,44.756511,44.754975,44.752014,44.752082,44.754362,44.755029,44.753131,44.752316,44.753697,44.755047,44.755006,44.754739,44.754428,44.754134,44.753908,44.753124,44.752753,44.752512,44.752011,44.753528,44.751448,44.752751,44.754761,44.756134,44.755458,44.753528,44.753404,44.753858,44.754725,44.755009,44.755259,44.755633,44.755564,44.753742,44.752139,44.752096,44.752567,44.753934,44.75489,44.755819,44.755009,44.754001,44.751043,44.749763,44.750074,44.752692,44.753486,44.754101,44.755686,44.758945,44.760641,44.762046,44.764031,44.766805,44.766867,44.766226,44.764863,44.765619,44.766239,44.767362,44.768217,44.767942,44.768072,44.769646,44.771258,44.774001,44.774716,44.774732,44.775558,44.776476,44.777214,44.777804,44.778181,44.782461,44.784075,44.788271,44.788863,44.789213,44.789107,44.787851,44.787861,44.787054,44.784738,44.782401,44.781976,44.781136,44.780277,44.777719,44.777574,44.777923,44.777371,44.776088,44.775417,44.77602,44.777267,44.777245,44.778523,44.780196,44.781647,44.789338,44.791364,44.792929,44.793214,44.792106,44.789677,44.789109,44.789479,44.787808,44.787738,44.789642,44.790451,44.790249,44.791419,44.792586,44.793174,44.792765,44.793463,44.792603,44.79278,44.794422,44.793666,44.791563,44.791537,44.791578,44.789678,44.78903,44.786855,44.785434,44.785209,44.783213,44.779591,44.777942,44.778194,44.775523,44.771708,44.77072,44.770298,44.770616,44.770896,44.774362,44.77468,44.774063,44.772644,44.769308,44.767536,44.76229,44.760755,44.759186,44.758055,44.7583,44.758216,44.757137,44.75506,44.752291,44.751136,44.751034,44.750569,44.748623,44.747499,44.745129,44.743985,44.744958,44.743794,44.741044,44.739819,44.739187,44.737503,44.736472,44.732507,44.729806,44.728611,44.726906,44.724935,44.723703,44.721852,44.72222,44.720663,44.719301,44.716995,44.71578,44.714889,44.715479,44.717986,44.718634,44.720937,44.721094,44.715557,44.714277,44.713103,44.709874,44.707984,44.705845,44.702888,44.700518,44.698606,44.697578,44.696492,44.696526,44.695985,44.694026,44.693479,44.693872,44.696058,44.695699,44.694101,44.69212,44.690286,44.689016,44.687233,44.686916,44.688924,44.68809,44.687041,44.686898,44.68794,44.689732,44.690091,44.690794,44.691194,44.691887,44.69276,44.694116,44.697591,44.69816,44.698774,44.699336,44.699592,44.700354,44.704244,44.705776,44.707409,44.709128,44.710897,44.712904,44.714894,44.717341,44.71976,44.719877,44.721154,44.72213,44.723642,44.725376,44.725578,44.723951,44.72107,44.720551,44.721804,44.723498,44.725243,44.728972,44.731045,44.733589,44.735417,44.735833,44.736823,44.73726,44.737595,44.73808,44.738451,44.73849,44.737627,44.737034,44.737684,44.738869,44.743405,44.744883,44.747124,44.748042,44.748094,44.74615,44.743504,44.743073,44.743343,44.745997,44.747011,44.747551,44.746539,44.746215,44.746553,44.748844,44.751034,44.752966,44.759049,44.759483,44.758445,44.756922,44.753731,44.752475,44.751272,44.751372,44.752109,44.751258,44.749592,44.7488,44.748914,44.749516,44.751446,44.755137,44.760578,44.765404,44.770231,44.771832,44.773729,44.775272,44.778736,44.779867,44.785587,44.787897,44.789249,44.79117,44.791961,44.792666,44.793774,44.794537,44.796516,44.797542,44.799099,44.800848,44.806642,44.80953,44.811523,44.814044,44.817768,44.818847,44.82098,44.821691,44.822803,44.826079,44.826479,44.825503,44.825398,44.826506,44.827607,44.829536,44.830219,44.830236,44.828733,44.829041,44.83042,44.833332,44.835729,44.83612,44.836601,44.837131,44.837984,44.839568,44.841506,44.844667,44.845611,44.851647,44.855601,44.857553]}]],[[{"lng":[-121.849512,-121.847093,-121.843955,-121.844453,-121.844256,-121.843049,-121.844366,-121.845971,-121.847034,-121.84938,-121.848875,-121.847359,-121.84688,-121.844861,-121.843914,-121.839796,-121.834668,-121.832405,-121.829007,-121.82561,-121.824155,-121.823104,-121.819453,-121.818283,-121.815638,-121.814698,-121.809865,-121.809382,-121.809419,-121.811212,-121.813074,-121.812509,-121.813482,-121.816073,-121.816317,-121.815832,-121.8138,-121.813604,-121.811331,-121.807657,-121.806817,-121.807092,-121.804825,-121.803286,-121.802801,-121.802093,-121.803133,-121.801798,-121.800708,-121.801265,-121.800617,-121.79921,-121.800051,-121.799081,-121.799965,-121.798363,-121.796859,-121.79518,-121.793895,-121.795273,-121.795192,-121.800216,-121.800926,-121.798646,-121.800331,-121.802162,-121.802325,-121.804756,-121.806559,-121.81069,-121.811566,-121.810189,-121.80941,-121.807491,-121.808206,-121.805763,-121.805488,-121.80419,-121.802244,-121.80273,-121.801352,-121.800054,-121.797945,-121.799432,-121.799566,-121.797991,-121.797622,-121.797993,-121.79865,-121.798969,-121.799036,-121.798805,-121.798435,-121.798296,-121.801092,-121.801611,-121.800563,-121.800936,-121.800345,-121.799241,-121.799675,-121.800929,-121.800402,-121.799562,-121.794599,-121.793238,-121.788859,-121.787179,-121.788944,-121.790022,-121.793329,-121.793604,-121.795481,-121.796635,-121.797009,-121.796565,-121.797651,-121.800479,-121.802922,-121.802109,-121.798174,-121.797833,-121.796704,-121.796107,-121.795797,-121.795864,-121.79528,-121.795643,-121.794385,-121.79695,-121.798109,-121.802682,-121.804597,-121.802779,-121.799458,-121.800219,-121.797222,-121.795075,-121.792298,-121.79161,-121.788525,-121.788203,-121.782569,-121.780168,-121.774175,-121.775652,-121.772321,-121.768218,-121.762002,-121.759958,-121.761005,-121.763225,-121.76661,-121.769206,-121.769125,-121.771593,-121.772449,-121.773183,-121.776323,-121.778305,-121.779924,-121.783621,-121.784961,-121.789999,-121.79151,-121.795963,-121.796831,-121.798998,-121.801536,-121.804413,-121.804304,-121.806653,-121.80762,-121.810296,-121.81202,-121.813655,-121.817386,-121.819137,-121.817809,-121.817212,-121.816436,-121.816517,-121.817693,-121.820254,-121.819663,-121.820278,-121.816998,-121.813663,-121.813063,-121.810174,-121.811363,-121.812221,-121.808137,-121.803883,-121.796409,-121.792116,-121.790183,-121.787132,-121.781753,-121.775926,-121.767978,-121.764831,-121.76252,-121.759991,-121.753589,-121.752994,-121.725068,-121.725068,-121.351973,-121.210841,-121.091897,-121.090568,-121.08948,-120.989505,-120.923309,-120.68959,-120.371441,-120.372635,-120.379053,-120.380711,-120.377062,-120.377797,-120.38353,-120.386035,-120.386498,-120.385489,-120.384813,-120.380814,-120.379005,-120.379794,-120.381376,-120.385877,-120.385062,-120.390987,-120.393173,-120.394109,-120.395872,-120.398292,-120.399226,-120.401654,-120.404676,-120.404685,-120.400743,-120.39737,-120.394668,-120.394254,-120.394825,-120.397984,-120.399248,-120.398603,-120.393046,-120.389667,-120.387782,-120.387452,-120.388118,-120.387642,-120.385687,-120.386378,-120.385768,-120.386561,-120.406743,-120.597275,-120.827555,-120.827552,-120.826899,-120.988824,-120.988375,-121.014525,-121.058034,-121.058352,-121.076748,-121.077844,-121.107534,-121.130934,-121.149644,-121.189792,-121.199971,-121.229289,-121.2293,-121.242113,-121.291112,-121.405495,-121.473293,-121.533117,-121.59326,-121.596883,-121.636001,-121.673699,-121.674928,-121.776324,-121.776324,-121.843138,-121.843218,-121.846123,-121.846756,-121.846519,-121.845128,-121.845745,-121.842528,-121.841332,-121.843244,-121.843146,-121.845531,-121.844403,-121.845334,-121.84552,-121.845745,-121.847561,-121.847578,-121.846191,-121.846615,-121.844711,-121.841535,-121.841128,-121.84291,-121.844408,-121.847502,-121.848677,-121.848139,-121.848791,-121.847291,-121.847634,-121.849462,-121.849512],"lat":[44.468364,44.470459,44.471833,44.473565,44.475957,44.479035,44.481512,44.483372,44.483275,44.484523,44.486706,44.488942,44.49109,44.491746,44.492775,44.495385,44.499335,44.502985,44.504256,44.50698,44.510048,44.511203,44.512045,44.512981,44.512108,44.513325,44.513812,44.514425,44.517546,44.519831,44.525157,44.527784,44.531585,44.534596,44.537376,44.539172,44.541745,44.54353,44.545235,44.546928,44.548444,44.551851,44.553353,44.555321,44.559782,44.562017,44.564929,44.566362,44.567833,44.570839,44.572228,44.573115,44.576399,44.579193,44.581321,44.582152,44.588985,44.592814,44.594056,44.596546,44.597702,44.600249,44.603152,44.605198,44.606225,44.608412,44.610439,44.611599,44.613731,44.61439,44.615767,44.617967,44.622239,44.623723,44.628211,44.631081,44.63302,44.633771,44.636033,44.63719,44.637365,44.639156,44.640313,44.643578,44.646223,44.64721,44.649507,44.650642,44.651538,44.652275,44.652762,44.653385,44.653849,44.654228,44.657456,44.660301,44.663489,44.665891,44.671413,44.672991,44.676467,44.67856,44.683013,44.683915,44.683929,44.685153,44.687063,44.689291,44.690417,44.6928,44.6946,44.696291,44.69753,44.698304,44.69837,44.699309,44.70078,44.703088,44.710685,44.711741,44.713707,44.713842,44.714077,44.714547,44.71558,44.716295,44.72052,44.724655,44.725896,44.727148,44.727671,44.729116,44.729236,44.730793,44.732713,44.735456,44.738266,44.741882,44.744269,44.746259,44.747845,44.748232,44.748893,44.750464,44.752723,44.754074,44.759964,44.76137,44.760886,44.762326,44.765293,44.767292,44.766914,44.769111,44.769993,44.772141,44.775136,44.775636,44.77416,44.77555,44.775543,44.772641,44.771856,44.773281,44.772311,44.772848,44.776675,44.778183,44.779277,44.777548,44.779078,44.780597,44.782159,44.78228,44.781509,44.784404,44.786813,44.7898,44.790637,44.791602,44.792548,44.792964,44.793037,44.79466,44.795847,44.800134,44.803173,44.80399,44.805407,44.806377,44.807869,44.811574,44.811634,44.81217,44.812002,44.813004,44.815433,44.815469,44.818958,44.819846,44.819734,44.820267,44.824633,44.82543,44.828908,44.829919,44.829919,44.825519,44.8247,44.825067,44.825098,44.824093,44.823272,44.823135,44.822996,44.822491,44.821769,44.82037,44.819357,44.817938,44.814826,44.812034,44.8119,44.810985,44.809966,44.809674,44.807041,44.807352,44.806314,44.80298,44.800721,44.798474,44.796406,44.795784,44.797013,44.802712,44.803969,44.802357,44.799835,44.797861,44.794719,44.792695,44.789951,44.788414,44.786038,44.784272,44.782665,44.78073,44.778767,44.776973,44.773307,44.771638,44.769866,44.767886,44.763229,44.761979,44.761175,44.653068,44.578606,44.564009,44.564036,44.563012,44.562793,44.562604,44.476499,44.476484,44.390265,44.390325,44.390428,44.390474,44.390427,44.390531,44.3906,44.390635,44.390647,44.390621,44.390631,44.390646,44.393036,44.392954,44.392893,44.393153,44.393464,44.393184,44.392612,44.392578,44.392413,44.393383,44.393387,44.393402,44.392829,44.39263,44.395459,44.398504,44.4022,44.404103,44.407373,44.408824,44.409387,44.41103,44.4118,44.413395,44.414634,44.417873,44.420456,44.424733,44.426582,44.428753,44.430542,44.431791,44.433879,44.437707,44.441974,44.444912,44.447288,44.451388,44.454743,44.458411,44.459549,44.461925,44.462899,44.464364,44.466672,44.468364]}]],[[{"lng":[-122.289972,-122.28747,-122.287458,-122.287177,-122.28769,-122.287686,-122.287818,-122.284689,-122.283449,-122.283778,-122.283792,-122.282708,-122.28273,-122.282622,-122.282585,-122.282245,-122.119656,-122.076261,-122.08045,-122.083097,-122.086152,-122.087905,-122.09102,-122.093776,-122.093953,-122.092989,-122.091829,-122.092132,-122.089048,-122.086957,-122.08859,-122.086627,-122.08697,-122.08664,-122.084436,-122.083111,-122.082668,-122.08346,-122.081345,-122.079883,-122.077287,-122.077133,-122.076045,-122.075297,-122.071996,-122.068737,-122.065175,-122.064263,-122.064303,-122.065324,-122.066487,-122.067115,-122.065992,-122.066281,-122.065023,-122.06047,-122.057458,-122.055484,-122.053544,-122.054283,-122.052383,-122.053175,-122.054621,-122.05417,-122.052183,-122.051025,-122.048329,-122.047031,-122.045526,-122.044583,-122.042643,-122.040172,-122.038962,-122.039694,-122.039964,-122.040977,-122.03966,-122.034519,-122.033634,-122.034014,-122.037333,-122.038408,-122.03965,-122.040718,-122.040658,-122.039396,-122.037335,-122.034178,-122.028174,-122.02634,-122.024834,-122.023229,-122.018876,-122.015876,-122.014804,-122.013759,-122.011983,-122.010682,-122.006618,-122.003126,-122.001997,-122.001265,-121.999218,-121.996857,-121.996478,-121.992757,-121.992743,-121.98966,-121.988228,-121.98518,-121.979423,-121.97532,-121.974199,-121.976391,-121.980554,-121.982424,-121.9839,-121.984575,-121.986399,-121.987774,-121.992765,-121.994513,-121.999904,-122.001332,-122.006263,-122.00765,-122.008778,-122.009532,-122.008532,-122.009075,-122.008467,-122.005582,-122.003164,-122.001443,-121.999293,-122.000957,-122.001748,-122.008646,-122.012305,-122.013078,-122.01326,-122.015941,-122.015598,-122.012945,-122.012157,-122.009233,-122.009346,-122.008208,-122.010144,-122.010789,-122.010403,-122.01216,-122.013147,-122.015812,-122.017972,-122.020536,-122.021663,-122.021803,-122.025284,-122.028001,-122.030376,-122.033694,-122.031057,-122.030513,-122.029159,-122.029958,-122.032684,-122.033982,-122.039166,-122.042212,-122.044577,-122.047945,-122.048876,-122.051658,-122.053217,-122.056221,-122.057121,-122.05949,-122.06024,-122.062266,-122.062769,-122.062446,-122.05922,-122.0571,-122.060407,-122.062799,-122.063256,-122.064155,-122.067515,-122.073062,-122.074132,-122.077115,-122.081246,-122.083154,-122.085681,-122.085903,-122.084586,-122.084678,-122.088043,-122.091182,-122.091581,-122.093408,-122.095125,-122.096658,-122.099629,-122.101598,-122.101702,-122.106436,-122.108581,-122.111765,-122.113959,-122.117102,-122.118494,-122.120581,-122.123909,-122.126425,-122.128491,-122.129916,-122.132883,-122.133328,-122.131782,-122.132034,-122.132435,-122.13754,-122.138814,-122.140676,-122.14345,-122.14421,-122.147305,-122.149927,-122.15296,-122.151573,-122.148739,-122.146301,-122.147339,-122.145365,-122.138621,-122.136912,-122.138978,-122.138412,-122.136458,-122.137364,-122.13888,-122.140161,-122.140492,-122.138917,-122.136871,-122.135334,-122.13445,-122.134547,-122.132848,-122.132331,-122.133356,-122.133046,-122.131417,-122.130937,-122.133547,-122.133453,-122.130529,-122.128721,-122.130579,-122.129678,-122.129797,-122.131583,-122.132474,-122.138758,-122.142355,-122.145139,-122.147726,-122.148688,-122.149534,-122.147807,-122.146222,-122.146991,-122.144946,-122.143532,-122.140274,-122.140082,-122.141768,-122.142867,-122.142806,-122.140828,-122.139145,-122.138746,-122.136349,-122.135109,-122.133674,-122.133128,-122.131616,-122.131009,-122.129193,-122.12716,-122.125264,-122.124336,-122.116677,-122.112224,-122.110753,-122.109553,-122.106566,-122.105215,-122.103544,-122.099228,-122.096613,-122.094779,-122.094982,-122.093513,-122.092318,-122.086742,-122.0826,-122.080848,-122.078379,-122.076149,-122.071291,-122.070284,-122.072724,-122.071531,-122.067707,-122.064361,-122.061334,-122.059263,-122.056872,-122.049781,-122.047708,-122.046115,-122.042529,-122.04094,-122.038966,-122.035993,-122.034958,-122.02914,-122.026748,-122.020002,-122.016941,-122.013037,-122.010965,-122.003068,-122.002362,-121.642987,-121.600018,-121.547864,-121.464437,-121.398498,-121.39767,-121.332969,-121.332609,-121.332413,-121.348471,-121.349247,-121.349315,-121.3513,-121.35055,-121.35053,-121.350007,-121.349679,-121.131887,-120.996685,-120.996696,-120.899236,-120.883327,-120.882106,-120.882106,-120.880436,-120.880501,-120.879805,-120.879925977229,-120.940201,-120.980416,-121.022114,-121.080956,-121.111238326886,-121.125007,-121.174152,-121.250331958387,-121.297304,-121.31648631619,-121.328988,-121.344911,-121.356649,-121.435531,-121.447537949131,-121.518985,-121.519526386293,-121.591106,-121.600214645464,-121.600302875257,-121.680618944726,-121.69468,-121.800981,-121.825079635986,-121.889217528984,-121.88925504236,-121.939829,-121.954084502429,-121.95743,-122.034563,-122.047234,-122.144058,-122.163511,-122.189401401612,-122.260687,-122.284835725791,-122.289748006076,-122.289972],"lat":[42.127156,42.127168,42.202994,42.288838,42.392086,42.395348,42.4745,42.4745,42.707455,42.901702,42.910926,42.910928,42.996499,43.056265,43.067719,43.06772,43.067757,43.067744,43.069772,43.069841,43.072046,43.072155,43.073641,43.076257,43.077449,43.082238,43.083706,43.086837,43.090462,43.091483,43.094927,43.096334,43.098894,43.100431,43.101539,43.103033,43.104749,43.10851,43.1135,43.115911,43.1177,43.120005,43.122069,43.126545,43.129445,43.131102,43.135701,43.140814,43.143377,43.146062,43.147204,43.149964,43.150872,43.152756,43.15248,43.154236,43.15582,43.156334,43.157965,43.162171,43.164577,43.167235,43.168662,43.172116,43.174665,43.176881,43.178552,43.181278,43.183103,43.186757,43.187293,43.189496,43.191598,43.193526,43.196262,43.197659,43.199921,43.205333,43.206901,43.207857,43.211156,43.213191,43.214102,43.216623,43.218136,43.218581,43.217497,43.218674,43.219886,43.221535,43.221998,43.224582,43.226832,43.226904,43.228348,43.232005,43.234109,43.234593,43.234065,43.23423,43.234752,43.236587,43.238929,43.239893,43.24262,43.248354,43.251153,43.253139,43.254846,43.25735,43.259784,43.260981,43.261693,43.262296,43.26518,43.268887,43.27039,43.27353,43.27473,43.277653,43.279401,43.280439,43.281121,43.281696,43.285971,43.288227,43.291051,43.294341,43.296048,43.298773,43.30118,43.302549,43.304723,43.307618,43.308993,43.310469,43.312566,43.317236,43.317991,43.31895,43.32131,43.324152,43.325457,43.327747,43.329023,43.331929,43.33516,43.337374,43.340257,43.342685,43.344697,43.345646,43.347589,43.350868,43.352741,43.358409,43.359378,43.362042,43.361911,43.360013,43.358849,43.35665,43.360048,43.361626,43.363153,43.364558,43.366071,43.368514,43.370607,43.372241,43.37526,43.377492,43.377553,43.379996,43.380888,43.381459,43.383771,43.386782,43.390573,43.39268,43.394378,43.395276,43.398562,43.399646,43.400716,43.403898,43.405868,43.406547,43.407003,43.409675,43.410852,43.412149,43.414465,43.418402,43.419318,43.420242,43.421641,43.422579,43.423647,43.426736,43.42882,43.429284,43.427893,43.425298,43.425947,43.425083,43.428032,43.429801,43.429219,43.429089,43.431354,43.431977,43.432837,43.435399,43.434663,43.435349,43.435234,43.436162,43.436528,43.437293,43.439396,43.440221,43.441124,43.443167,43.444501,43.444947,43.444169,43.442832,43.442479,43.444354,43.447662,43.448708,43.449351,43.450923,43.452654,43.45489,43.45514,43.456339,43.456987,43.459132,43.460686,43.461777,43.461778,43.463835,43.466716,43.467514,43.467445,43.468423,43.472069,43.47356,43.476034,43.478185,43.479701,43.482811,43.483834,43.485057,43.489966,43.491401,43.491969,43.496887,43.499774,43.503594,43.505694,43.507323,43.510434,43.511821,43.513285,43.513576,43.515463,43.519057,43.520693,43.523017,43.523617,43.525509,43.52841,43.528421,43.529683,43.530775,43.534465,43.535952,43.53711,43.540482,43.541944,43.543161,43.544544,43.549437,43.551491,43.553278,43.55495,43.557284,43.557376,43.558293,43.55993,43.561938,43.562447,43.56549,43.565274,43.567709,43.569273,43.572977,43.574486,43.574987,43.574618,43.575654,43.576825,43.579215,43.579642,43.579584,43.577615,43.577326,43.577964,43.579643,43.579585,43.581616,43.584945,43.58775,43.58775,43.587403,43.589719,43.590297,43.59192,43.594581,43.597881,43.597823,43.599211,43.600817,43.601615,43.601758,43.602452,43.603609,43.604822,43.606611,43.609916,43.609162,43.609274,43.614657,43.615498,43.616648,43.616443,43.616497,43.616607,43.616218,43.616295,43.616645,43.473058,43.356663,43.356753,43.111683,43.089928,42.919989,42.919989,42.91669,42.833905,42.746644,42.746775,42.746349,42.743688,42.743806,42.744214,42.486559,42.483262,42.483263,42.428587,41.996882,41.9937643415584,41.993492,41.993023,41.993308,41.995314,41.995871512136,41.996125,41.997228,41.9973071788576,41.997356,41.997018172313,41.996798,41.996214,41.996493,41.997327,41.9974692924328,41.998316,41.9983223656297,41.999164,41.9992909902104,41.9992922202857,42.0004119646647,42.000608,42.002122,42.0024146243105,42.0031934363034,42.0031938918199,42.003808,42.0035463939955,42.003485,42.004696,42.005339,42.006552,42.007264,42.0073583154912,42.007618,42.0080194929245,42.0081011637255,42.127156]}]],[[{"lng":[-121.108335,-121.108065,-121.107534,-121.077844,-121.076748,-121.058352,-121.058034,-121.014525,-120.988375,-120.988824,-120.826899,-120.827552,-120.827555,-120.597275,-120.406743,-120.386561,-120.387186,-120.385775,-120.386074,-120.36646,-120.143544,-120.101166,-120.021621,-120.020708,-120.010547,-120.000617,-119.970532,-119.960375,-119.899283,-119.899002,-119.655517,-119.654993,-119.656838,-119.657183,-119.775402,-119.777528,-119.897434,-120.237934,-120.257777,-120.258386,-120.298364,-120.378107,-120.37874,-120.747848,-120.748249,-120.918109,-120.986587,-120.986955,-120.987084,-120.987271,-121.028358,-121.09243,-121.102773,-121.102781,-121.102791,-121.102883,-121.102938,-121.108537,-121.108335],"lat":[44.26204,44.32718,44.3906,44.390531,44.390427,44.390474,44.390428,44.390325,44.390265,44.476484,44.476499,44.562604,44.562793,44.563012,44.564036,44.564009,44.476624,44.476624,44.436083,44.437015,44.437751,44.43821,44.438793,44.389687,44.389727,44.389104,44.388968,44.389457,44.389575,44.30662,44.307045,44.220276,44.220277,43.95892,43.959086,43.697957,43.6982,43.697376,43.698762,43.785297,43.785545,43.785429,43.872362,43.871331,43.95731,43.959365,43.960852,44.047637,44.076292,44.134026,44.135452,44.137751,44.138125,44.169238,44.17139,44.20241,44.218487,44.218519,44.26204]}]],[[{"lng":[-118.697766,-118.656251,-118.656266,-118.633925,-118.613243,-118.613254,-118.613107,-118.577354,-118.572271,-118.536194,-118.506296,-118.506172,-118.469471,-118.428329,-118.428539,-118.428539,-118.404806,-118.404849,-118.392817,-118.38422,-118.384117,-118.366522,-118.366326,-118.267614,-118.241665,-118.241668,-118.197876,-118.197955,-118.117464,-118.116461,-118.116362,-118.116355,-118.116309,-118.11836,-118.116844,-118.117121,-118.117194,-118.066383,-118.066513,-118.066465,-118.066506,-118.054666,-118.045102,-118.045003,-117.972948,-117.97298,-117.747327,-117.747405,-117.747464,-117.74765,-117.788395,-117.787623,-117.766865,-117.767063,-117.746137,-117.745959,-117.730633,-117.727225,-117.727235,-117.683986,-117.683794,-117.683951,-117.68379,-117.664146,-117.663391,-117.643485,-117.643494,-117.622777,-117.622801,-117.582344,-117.582674,-117.582166,-117.562208,-117.561969,-117.542058,-117.542216,-117.522249,-117.522313,-117.520674,-117.520941,-117.501432,-117.496311,-117.476762,-117.476684,-117.373361,-117.320193,-117.266006,-117.266006,-117.266005,-117.313239,-117.368183,-117.379472,-117.381873,-117.563486,-117.563402,-117.564033,-117.747664,-117.777504,-117.779549,-117.78438,-117.784917,-117.784223,-117.784287,-117.780449,-117.778261,-117.778664,-117.77942,-117.781825,-117.784715,-117.786109,-117.790617,-117.791738,-117.794182,-117.793112,-117.795976,-117.794825,-117.795624,-117.793626,-117.793905,-117.795811,-117.797179,-117.794612,-117.793418,-117.795212,-117.796519,-117.797076,-117.799062,-117.798106,-117.799102,-117.801591,-117.803038,-117.804671,-117.802486,-117.803614,-117.805343,-117.803943,-117.80439,-117.805679,-117.807106,-117.809642,-117.812501,-117.813232,-117.810901,-117.812384,-117.810499,-117.810347,-117.81202,-117.814507,-117.818062,-117.827784,-117.827377,-117.828819,-117.834022,-117.838224,-117.840934,-117.840601,-117.837244,-117.83775,-117.83989,-117.841727,-117.844909,-117.84433,-117.842069,-117.84343,-117.850204,-117.850462,-117.853788,-117.858127,-117.859832,-117.862058,-117.868648,-117.870438,-117.871887,-117.873734,-117.873396,-117.881163,-117.884041,-117.88527,-117.885361,-117.888408,-117.885732,-117.886506,-117.890152,-117.890515,-117.894708,-117.894074,-117.897252,-117.896386,-117.900497,-117.901443,-117.903603,-117.906142,-117.911901,-117.912473,-117.913393,-117.914198,-117.915266,-117.917055,-117.917634,-117.918603,-117.920378,-117.922093,-117.921696,-117.925714,-117.92723,-117.928321,-117.931873,-117.933931,-117.93636,-117.937296,-117.940522,-117.942835,-117.944977,-117.946243,-117.9477,-117.950925,-117.952633,-117.956183,-117.958124,-117.965211,-117.968688,-117.97216,-117.975378,-117.977728,-117.982631,-117.985755,-117.990182,-117.993112,-117.998992,-118.000318,-118.00333,-118.006843,-118.007344,-118.009949,-118.016228,-118.022745,-118.028283,-118.032237,-118.037125,-118.041949,-118.044232,-118.046279,-118.051814,-118.057584,-118.060105,-118.063637,-118.064404,-118.06955,-118.0717,-118.074772,-118.077997,-118.080456,-118.086523,-118.088982,-118.089673,-118.091286,-118.09213,-118.094052,-118.096972,-118.098817,-118.100661,-118.102659,-118.10804,-118.108962,-118.110422,-118.115495,-118.11925,-118.126328,-118.128407,-118.130351,-118.136551,-118.137729,-118.138203,-118.139929,-118.141185,-118.140482,-118.140876,-118.142367,-118.148405,-118.154916,-118.15578,-118.155076,-118.156488,-118.161036,-118.164484,-118.166758,-118.169815,-118.172167,-118.175223,-118.17687,-118.178908,-118.184709,-118.192549,-118.194901,-118.197174,-118.200232,-118.201486,-118.203838,-118.206973,-118.209168,-118.211519,-118.214184,-118.214497,-118.21246,-118.212459,-118.213556,-118.213478,-118.212772,-118.214731,-118.213634,-118.213869,-118.217081,-118.219197,-118.220763,-118.220371,-118.223192,-118.223739,-118.225462,-118.227421,-118.228047,-118.229691,-118.231806,-118.232658,-118.232165,-118.232197,-118.245136,-118.244662,-118.251326,-118.254562,-118.256409,-118.260454,-118.263148,-118.264747,-118.267939,-118.270121,-118.272668,-118.274333,-118.276006,-118.277008,-118.278403,-118.280496,-118.28229,-118.282246,-118.284328,-118.286304,-118.287892,-118.290194,-118.292543,-118.296386,-118.299031,-118.298941,-118.299819,-118.302714,-118.304524,-118.305238,-118.307603,-118.308807,-118.308527,-118.311985,-118.314562,-118.315687,-118.318969,-118.320187,-118.321271,-118.323544,-118.324554,-118.329464,-118.32962,-118.331747,-118.3346,-118.336217,-118.339081,-118.342078,-118.34662,-118.350693,-118.351765,-118.356323,-118.356759,-118.358389,-118.359455,-118.364214,-118.366738,-118.367815,-118.368541,-118.370856,-118.373475,-118.375376,-118.378083,-118.380085,-118.381016,-118.386538,-118.387501,-118.38708,-118.387479,-118.390619,-118.390399,-118.389864,-118.392626,-118.39477,-118.39872,-118.40065,-118.404535,-118.405273,-118.408772,-118.411093,-118.416289,-118.418766,-118.42272,-118.425078,-118.430751,-118.433878,-118.4361,-118.439339,-118.438286,-118.437099,-118.438268,-118.438524,-118.437462,-118.437612,-118.436403,-118.437351,-118.44167,-118.444209,-118.445887,-118.446726,-118.446315,-118.448093,-118.452852,-118.456019,-118.457035,-118.464283,-118.469023,-118.469598,-118.468871,-118.518689,-118.519022,-118.518687,-118.547652,-118.546632,-118.655992,-118.656102,-118.696986,-118.697013,-118.697766],"lat":[45.345647,45.345146,45.340337,45.340006,45.339884,45.345788,45.354951,45.354773,45.354767,45.354518,45.354632,45.354867,45.355164,45.35519,45.428951,45.429076,45.429013,45.44255,45.442554,45.44258,45.435246,45.43531,45.428951,45.429103,45.428841,45.427391,45.427204,45.4704,45.470702,45.470732,45.49282,45.498842,45.514652,45.514664,45.600729,45.673797,45.688607,45.688395,45.737574,45.769522,45.77346,45.773563,45.773538,45.817073,45.816896,45.860595,45.861072,45.850523,45.833238,45.773625,45.773515,45.689567,45.689605,45.660227,45.660736,45.616635,45.61692,45.61699,45.51478,45.51523,45.506771,45.441917,45.428365,45.428344,45.365749,45.365322,45.33687,45.336789,45.338171,45.338096,45.324359,45.310184,45.310219,45.295879,45.295956,45.267424,45.267731,45.253458,45.223598,45.209768,45.210148,45.209977,45.209973,45.166539,45.16654,45.166537,45.166539,45.152442,45.08057,45.080581,45.080569,45.079993,45.079997,45.079446,45.036118,44.992866,44.992426,44.992161,44.995244,44.995675,44.998322,44.999668,45.003714,45.005572,45.007621,45.009631,45.01143,45.013583,45.014289,45.013987,45.014854,45.016317,45.016682,45.018583,45.018489,45.020454,45.021648,45.022058,45.023142,45.02278,45.023925,45.023959,45.025795,45.026273,45.025335,45.026679,45.026766,45.028164,45.029284,45.02915,45.02718,45.028184,45.029705,45.030495,45.029481,45.031851,45.032625,45.032832,45.031655,45.032445,45.032274,45.030655,45.028808,45.027532,45.026711,45.025607,45.024511,45.024491,45.025909,45.033314,45.035472,45.037596,45.042113,45.04804,45.050658,45.051643,45.052819,45.055138,45.055136,45.054096,45.054797,45.056057,45.057026,45.058477,45.059736,45.060351,45.060443,45.059753,45.055712,45.054525,45.05758,45.060146,45.064703,45.065639,45.060713,45.059622,45.060095,45.058249,45.056709,45.0571,45.051089,45.049436,45.048706,45.047569,45.04524,45.043706,45.039581,45.037917,45.036321,45.034604,45.033156,45.030232,45.028008,45.028207,45.027236,45.026847,45.026033,45.025357,45.024736,45.024485,45.023006,45.020889,45.019079,45.016939,45.016787,45.015197,45.013626,45.014081,45.0125,45.012767,45.009324,45.008418,45.006667,45.006698,45.006582,45.004881,45.002967,45.000952,45.000621,44.997626,44.995908,44.99617,44.995873,44.994951,44.995409,44.99459,44.99525,44.994448,44.994348,44.994876,44.99484,44.996376,44.997415,44.997644,45.000595,45.001635,45.003403,45.003881,45.004007,45.006961,45.006868,45.00991,45.012785,45.012569,45.012924,45.014088,45.015179,45.016873,45.019598,45.021068,45.024723,45.025648,45.032029,45.033716,45.036878,45.038568,45.041238,45.042327,45.04233,45.044892,45.044347,45.045602,45.046198,45.046801,45.046962,45.045162,45.044761,45.044444,45.045214,45.045024,45.040799,45.040018,45.036458,45.035513,45.033844,45.031677,45.02945,45.027725,45.026728,45.022278,45.020442,45.018775,45.017883,45.015711,45.016657,45.016103,45.017161,45.017105,45.019388,45.019389,45.017995,45.019389,45.017997,45.017329,45.015325,45.015104,45.013155,45.01232,45.010203,45.010094,45.008201,45.007421,45.006585,45.005306,45.00108,44.999353,44.996519,44.995073,44.991343,44.990567,44.989174,44.988505,44.987447,44.984888,44.983722,44.981549,44.979158,44.977488,44.976652,44.973481,44.97237,44.969921,44.966976,44.963285,44.960686,44.960686,44.958396,44.956351,44.956457,44.956934,44.956655,44.958896,44.95929,44.958731,44.957313,44.957659,44.957348,44.957896,44.96023,44.961771,44.962104,44.963114,44.964726,44.964459,44.965046,44.964509,44.962755,44.962913,44.960768,44.96063,44.963426,44.963839,44.968559,44.968488,44.969209,44.969659,44.970771,44.972016,44.971568,44.972586,44.974252,44.975929,44.975415,44.973044,44.972832,44.971889,44.972329,44.973393,44.975827,44.976675,44.978879,44.979593,44.983748,44.986988,44.987332,44.987824,44.988214,44.990605,44.992174,44.992301,44.990763,44.986714,44.985957,44.984037,44.982434,44.981597,44.981894,44.980115,44.979488,44.98129,44.983712,44.983786,44.980483,44.979407,44.97756,44.974115,44.972402,44.972544,44.973976,44.97436,44.975912,44.976476,44.975031,44.973309,44.971192,44.968752,44.967006,44.965656,44.963809,44.963891,44.96256,44.96242,44.96625,44.968054,44.971665,44.975192,44.977115,44.978587,44.980277,44.98298,44.984781,44.985326,44.986752,44.986767,44.988471,44.990024,44.990623,44.989289,44.989514,44.990257,44.989822,44.991737,44.992707,44.995176,44.995877,45.010173,45.08069,45.080753,45.196898,45.196928,45.257729,45.257715,45.259928,45.345647]}]],[[{"lng":[-124.214477,-124.210531,-124.210203396979,-124.208958,-124.206343,-124.206343,-124.206343,-124.200217,-124.193623,-124.193984,-124.177685,-124.16856,-124.164503939476,-124.158728145934,-124.138807,-124.104167,-124.102125,-124.101667,-124.098533,-124.064614,-124.064585,-124.025781,-124.005944,-123.98581,-123.96592,-123.946294,-123.946529,-123.934708,-123.925479,-123.926089,-123.925917,-123.916158,-123.907166,-123.902391,-123.902195,-123.897407,-123.897197,-123.882804,-123.882553,-123.877749,-123.877485,-123.872667,-123.872566,-123.872399,-123.862685,-123.862381,-123.852602,-123.852268,-123.847397,-123.847057,-123.842136,-123.842059,-123.837143,-123.837073,-123.832118,-123.831984,-123.827036,-123.827004,-123.81007,-123.75871,-123.734733,-123.7038,-123.703628,-123.658767,-123.658909,-123.619012,-123.619621,-123.619367,-123.619574,-123.57958,-123.579689,-123.529005,-123.529153,-123.470251,-123.470371,-123.411426,-123.397831,-123.3482,-123.348246,-123.313129,-123.312001,-123.185986,-123.153653,-123.147539,-123.137319,-123.138001,-123.137646,-123.137588,-123.13733,-123.137211,-123.107318,-123.107672,-123.107475,-122.987626,-122.987618,-122.970915,-122.935501,-122.932533,-122.9124,-122.892765,-122.833744,-122.781518,-122.776409,-122.771564,-122.741845,-122.741914,-122.741317,-122.741716,-122.622946,-122.622914,-122.508438,-122.508441,-122.447124,-122.27067,-122.270653,-122.132034,-122.131782,-122.133328,-122.132883,-122.129916,-122.128491,-122.126425,-122.123909,-122.120581,-122.118494,-122.117102,-122.113959,-122.111765,-122.108581,-122.106436,-122.101702,-122.101598,-122.099629,-122.096658,-122.095125,-122.093408,-122.091581,-122.091182,-122.088043,-122.084678,-122.084586,-122.085903,-122.085681,-122.083154,-122.081246,-122.077115,-122.074132,-122.073062,-122.067515,-122.064155,-122.063256,-122.062799,-122.060407,-122.0571,-122.05922,-122.062446,-122.062769,-122.062266,-122.06024,-122.05949,-122.057121,-122.056221,-122.053217,-122.051658,-122.048876,-122.047945,-122.044577,-122.042212,-122.039166,-122.033982,-122.032684,-122.029958,-122.029159,-122.030513,-122.031057,-122.033694,-122.030376,-122.028001,-122.025284,-122.021803,-122.021663,-122.020536,-122.017972,-122.015812,-122.013147,-122.01216,-122.010403,-122.010789,-122.010144,-122.008208,-122.009346,-122.009233,-122.012157,-122.012945,-122.015598,-122.015941,-122.01326,-122.013078,-122.012305,-122.008646,-122.001748,-122.000957,-121.999293,-122.001443,-122.003164,-122.005582,-122.008467,-122.009075,-122.008532,-122.009532,-122.008778,-122.00765,-122.006263,-122.001332,-121.999904,-121.994513,-121.992765,-121.987774,-121.986399,-121.984575,-121.9839,-121.982424,-121.980554,-121.976391,-121.974199,-121.97532,-121.979423,-121.98518,-121.988228,-121.98966,-121.992743,-121.992757,-121.996478,-121.996857,-121.999218,-122.001265,-122.001997,-122.003126,-122.006618,-122.010682,-122.011983,-122.013759,-122.014804,-122.015876,-122.018876,-122.023229,-122.024834,-122.02634,-122.028174,-122.034178,-122.037335,-122.039396,-122.040658,-122.040718,-122.03965,-122.038408,-122.037333,-122.034014,-122.033634,-122.034519,-122.03966,-122.040977,-122.039964,-122.039694,-122.038962,-122.040172,-122.042643,-122.044583,-122.045526,-122.047031,-122.048329,-122.051025,-122.052183,-122.05417,-122.054621,-122.053175,-122.052383,-122.054283,-122.053544,-122.055484,-122.057458,-122.06047,-122.065023,-122.066281,-122.065992,-122.067115,-122.066487,-122.065324,-122.064303,-122.064263,-122.065175,-122.068737,-122.071996,-122.075297,-122.076045,-122.077133,-122.077287,-122.079883,-122.081345,-122.08346,-122.082668,-122.083111,-122.084436,-122.08664,-122.08697,-122.086627,-122.08859,-122.086957,-122.089048,-122.092132,-122.091829,-122.092989,-122.093953,-122.093776,-122.09102,-122.087905,-122.086152,-122.083097,-122.08045,-122.076261,-122.119656,-122.282245,-122.282585,-122.282622,-122.28273,-122.385922,-122.40031,-122.401025,-122.401041,-122.401077,-122.420844,-122.420863,-122.440535,-122.440505,-122.46021,-122.460224,-122.520525,-122.520741,-122.560273,-122.560299,-122.580049,-122.580094,-122.600202,-122.600251,-122.621665,-122.637812,-122.637695,-122.677181,-122.677198,-122.697017,-122.69701,-122.716657,-122.716699,-122.736329,-122.736367,-122.756033,-122.756079,-122.775223,-122.775044,-122.784914,-122.785493,-122.794811,-122.794776,-122.814413,-122.833971,-122.853707,-122.852943,-122.868692,-122.911925,-122.9178,-122.93175,-122.9451,-122.951199,-122.95119,-122.970829,-122.970492,-122.990035,-122.990728,-123.009744,-123.009765,-123.112688,-123.112652,-123.152233,-123.152023,-123.180512,-123.180551,-123.190456,-123.190504,-123.200419,-123.200424,-123.209912,-123.210392,-123.229635,-123.229619,-123.249209,-123.249328,-123.27426,-123.274283,-123.309197,-123.309162,-123.328626,-123.328588,-123.347048,-123.366666,-123.36665,-123.371581,-123.371999,-123.400242,-123.401297,-123.4014,-123.406341,-123.406299,-123.425721,-123.425687,-123.431052,-123.444922,-123.445456,-123.455213,-123.455304,-123.465271,-123.465261,-123.484693,-123.494304,-123.494414,-123.523444,-123.542539,-123.542433,-123.562168,-123.562086,-123.567036,-123.566777,-123.571728,-123.571814,-123.581862,-123.581699,-123.677275,-123.677206,-123.687082,-123.687089,-123.697,-123.696843,-123.701384,-123.716505,-123.716492,-123.716495,-123.720137,-123.723188,-123.726832,-123.732315,-123.734082,-123.735741,-123.739229,-123.740093,-123.741725,-123.743493,-123.746879,-123.750436,-123.752421,-123.754526,-123.756486,-123.759427,-123.761476,-123.764019,-123.766112,-123.76995,-123.773571,-123.778041,-123.780349,-123.783304,-123.789263,-123.7917,-123.795111,-123.796456,-123.796749,-123.799136,-123.800083,-123.800444,-123.803732,-123.806976,-123.808536,-123.811553,-123.811789,-123.820439,-123.819144,-123.81915,-123.819496,-123.820515,-123.821513,-123.821121,-123.821118,-123.761594,-123.761384,-123.761333,-123.707057,-123.707059,-123.702144,-123.702139,-123.702131,-123.702167,-123.703655,-123.703417,-123.703568,-123.703862,-123.704456,-123.704752,-123.764356,-123.764339,-123.763917,-123.764496,-123.762289,-123.761983,-123.762801,-123.761528,-123.764884,-123.769016,-123.817614,-123.817154,-123.816657,-123.875628,-123.875698,-123.949573,-123.949565,-123.979004,-124.062969,-124.100765,-124.146347,-124.180894,-124.183435,-124.218966377223,-124.214477],"lat":[43.627619,43.653347,43.6547163514708,43.659922,43.666628,43.6691103603323,43.674021,43.689555,43.706137,43.706674,43.767228,43.808955,43.8315479200854,43.8637200341693,43.863611,43.863289,43.863417,43.86343,43.863512,43.86421,43.862277,43.862224,43.862996,43.862001,43.863042,43.862737,43.871689,43.866012,43.865947,43.878689,43.898476,43.897322,43.896252,43.896281,43.900512,43.900512,43.904714,43.904582,43.908714,43.908629,43.91275,43.912655,43.914097,43.916733,43.916562,43.920658,43.920553,43.924682,43.924661,43.928822,43.928878,43.932429,43.932458,43.935984,43.935987,43.94308,43.94305,43.944837,43.944581,43.943882,43.944062,43.944319,43.937399,43.936474,43.921672,43.921117,43.906509,43.899074,43.891672,43.891057,43.868291,43.86833,43.830061,43.831183,43.810056,43.809877,43.809076,43.809212,43.78017,43.77991,43.77991,43.779533,43.779631,43.779635,43.77967,43.753648,43.736284,43.677086,43.649355,43.605906,43.605889,43.542099,43.540013,43.538988,43.540992,43.541679,43.54417,43.544357,43.543886,43.544882,43.544702,43.543912,43.544034,43.544317,43.544654,43.517582,43.452015,43.437395,43.438458,43.440262,43.440226,43.441275,43.44141,43.441628,43.440011,43.440221,43.439396,43.437293,43.436528,43.436162,43.435234,43.435349,43.434663,43.435399,43.432837,43.431977,43.431354,43.429089,43.429219,43.429801,43.428032,43.425083,43.425947,43.425298,43.427893,43.429284,43.42882,43.426736,43.423647,43.422579,43.421641,43.420242,43.419318,43.418402,43.414465,43.412149,43.410852,43.409675,43.407003,43.406547,43.405868,43.403898,43.400716,43.399646,43.398562,43.395276,43.394378,43.39268,43.390573,43.386782,43.383771,43.381459,43.380888,43.379996,43.377553,43.377492,43.37526,43.372241,43.370607,43.368514,43.366071,43.364558,43.363153,43.361626,43.360048,43.35665,43.358849,43.360013,43.361911,43.362042,43.359378,43.358409,43.352741,43.350868,43.347589,43.345646,43.344697,43.342685,43.340257,43.337374,43.33516,43.331929,43.329023,43.327747,43.325457,43.324152,43.32131,43.31895,43.317991,43.317236,43.312566,43.310469,43.308993,43.307618,43.304723,43.302549,43.30118,43.298773,43.296048,43.294341,43.291051,43.288227,43.285971,43.281696,43.281121,43.280439,43.279401,43.277653,43.27473,43.27353,43.27039,43.268887,43.26518,43.262296,43.261693,43.260981,43.259784,43.25735,43.254846,43.253139,43.251153,43.248354,43.24262,43.239893,43.238929,43.236587,43.234752,43.23423,43.234065,43.234593,43.234109,43.232005,43.228348,43.226904,43.226832,43.224582,43.221998,43.221535,43.219886,43.218674,43.217497,43.218581,43.218136,43.216623,43.214102,43.213191,43.211156,43.207857,43.206901,43.205333,43.199921,43.197659,43.196262,43.193526,43.191598,43.189496,43.187293,43.186757,43.183103,43.181278,43.178552,43.176881,43.174665,43.172116,43.168662,43.167235,43.164577,43.162171,43.157965,43.156334,43.15582,43.154236,43.15248,43.152756,43.150872,43.149964,43.147204,43.146062,43.143377,43.140814,43.135701,43.131102,43.129445,43.126545,43.122069,43.120005,43.1177,43.115911,43.1135,43.10851,43.104749,43.103033,43.101539,43.100431,43.098894,43.096334,43.094927,43.091483,43.090462,43.086837,43.083706,43.082238,43.077449,43.076257,43.073641,43.072155,43.072046,43.069841,43.069772,43.067744,43.067757,43.06772,43.067719,43.056265,42.996499,42.996644,42.996632,42.996632,42.993456,42.983458,42.983439,42.968927,42.968923,42.95442,42.954373,42.939873,42.93976,42.939077,42.939185,42.92469,42.924651,42.9108,42.911073,42.895693,42.896812,42.89699,42.881141,42.88108,42.866603,42.866572,42.852099,42.85211,42.837671,42.837661,42.823496,42.823195,42.828689,42.8288,42.806831,42.806845,42.792712,42.792721,42.778221,42.780511,42.780653,42.781766,42.774603,42.774541,42.774704,42.774753,42.774874,42.774805,42.774773,42.767555,42.768116,42.760945,42.76095,42.759538,42.75941,42.752144,42.752218,42.75575,42.755835,42.737721,42.737765,42.731655,42.731703,42.724495,42.724474,42.717236,42.717161,42.709983,42.709956,42.70261,42.702421,42.724404,42.724712,42.73203,42.732055,42.728412,42.728247,42.73175,42.732226,42.732194,42.739471,42.739484,42.724955,42.724951,42.724958,42.710297,42.710288,42.713966,42.714483,42.711039,42.710928,42.711122,42.703025,42.702982,42.699406,42.699297,42.702942,42.702168,42.702248,42.70918,42.709186,42.709832,42.717122,42.717574,42.724796,42.72483,42.735693,42.735716,42.732098,42.732149,42.73992,42.739682,42.750145,42.750274,42.753789,42.753907,42.739593,42.739703,42.739658,42.784061,42.785376,42.784164,42.783945,42.781526,42.780131,42.781753,42.782516,42.782865,42.783343,42.786552,42.787971,42.788228,42.787735,42.788245,42.789804,42.789808,42.79107,42.792391,42.792059,42.793468,42.794568,42.797407,42.797665,42.798915,42.799426,42.798147,42.797302,42.793699,42.792936,42.79277,42.790954,42.790094,42.78959,42.787536,42.786983,42.787868,42.788837,42.824101,42.824112,42.884356,42.885135,42.909661,42.909675,42.924483,42.965284,42.996291,42.996318,43.054511,43.08316,43.083457,43.087067,43.087083,43.112458,43.113946,43.17059,43.170579,43.177696,43.186134,43.214139,43.243253,43.257741,43.258054,43.2636,43.287099,43.344799,43.351419,43.358748,43.387997,43.422294,43.431548,43.431695,43.431306,43.459594,43.516449,43.515947,43.608407,43.608472,43.609265,43.609363,43.609641,43.611244,43.611216,43.611445,43.610925,43.6109319633736,43.627619]}]],[[{"lng":[-122.929193,-122.928956,-122.929145,-122.929122,-122.929146,-122.885463,-122.87539,-122.863423,-122.784735,-122.784663,-122.762437,-122.762189526428,-122.772511,-122.772681206097,-122.774511,-122.76381,-122.762414110309,-122.743540245466,-122.738109,-122.713309,-122.691381583242,-122.6911850902,-122.691008,-122.675327484197,-122.675093773773,-122.675008,-122.643907,-122.634962906196,-122.607718206328,-122.602606,-122.588917822907,-122.586005557515,-122.582325993186,-122.581406,-122.55127899822,-122.550211685523,-122.549955276927,-122.549438939157,-122.548149,-122.545981397444,-122.523668,-122.505353096256,-122.49601900833,-122.492259,-122.479315,-122.475778139509,-122.474659,-122.471883289024,-122.455261778702,-122.453891,-122.438674,-122.416934004748,-122.410706,-122.401222955157,-122.397100512625,-122.391802,-122.383435896741,-122.380302,-122.372189242991,-122.352802,-122.341811701881,-122.339070265255,-122.331502,-122.294901,-122.294819998052,-122.266701,-122.262625,-122.259530999909,-122.248993,-122.248911947664,-122.2017,-122.197527546048,-122.183695,-122.166829998749,-122.14075,-122.129548,-122.12949,-122.126197,-122.126197,-122.112356,-122.101675,-122.100176014643,-122.044374,-122.022571,-122.00369,-121.983038,-121.979797,-121.963547,-121.961258017759,-121.955734,-121.951838,-121.935149,-121.922028852172,-121.922051,-121.918698,-121.916509,-121.915478,-121.913115,-121.915184,-121.915527,-121.914551,-121.915913,-121.915803,-121.918095,-121.918386,-121.91549,-121.910547,-121.910516,-121.911443,-121.913019,-121.913911,-121.912619,-121.910309,-121.907326,-121.908329,-121.907176,-121.906325,-121.902915,-121.903291,-121.902678,-121.901879,-121.908793,-121.911695,-121.919685,-121.922136,-121.91644,-121.913216,-121.913761,-121.913087,-121.911614,-121.911443,-121.909746,-121.906924,-121.906688,-121.902817,-121.895902,-121.89392,-121.891749,-121.888674,-121.885605,-121.881862,-121.878538,-121.874665,-121.870166,-121.869342,-121.868187,-121.866919,-121.864656,-121.860873,-121.859828,-121.860137,-121.861111,-121.86337,-121.860323,-121.85882,-121.854653,-121.850403,-121.847872,-121.846821,-121.846764,-121.844301,-121.842521,-121.836809,-121.83527,-121.831765,-121.828898,-121.824922,-121.821485,-121.819587,-121.821959,-121.821956,-121.983148,-121.983147,-122.004194,-122.085981,-122.126544,-122.126545,-122.147212,-122.166674,-122.249969,-122.249828,-122.263944,-122.2727,-122.305836,-122.316084,-122.342882,-122.348315,-122.357752,-122.372096,-122.372796,-122.383141,-122.389346,-122.403758,-122.41397,-122.414457,-122.439145,-122.443966,-122.447789,-122.45466,-122.466639,-122.468001,-122.47253,-122.474558,-122.47555,-122.479942,-122.485866,-122.486584,-122.496748,-122.499336,-122.501043,-122.501787,-122.504364,-122.507261,-122.510439,-122.514243,-122.517067,-122.527468,-122.530085,-122.532488,-122.537618,-122.547638,-122.548002,-122.55301,-122.558255,-122.565483,-122.568617,-122.570126,-122.571309,-122.57905,-122.583961,-122.5855,-122.58613,-122.586836,-122.58937,-122.596245,-122.596603,-122.596702,-122.597184,-122.597198,-122.597395,-122.59762,-122.597665,-122.599675,-122.601454,-122.60175,-122.60573,-122.606614,-122.608722,-122.610832,-122.613127,-122.615374,-122.616195,-122.616871,-122.618341,-122.618588,-122.618995,-122.618977,-122.622359,-122.626278,-122.632974,-122.63656,-122.636587,-122.64158,-122.641245,-122.646958,-122.652921,-122.652988,-122.656972,-122.660979,-122.659105,-122.658274,-122.652605,-122.651227,-122.647666,-122.64616,-122.646267,-122.651183,-122.648787,-122.648725,-122.654959,-122.660451,-122.666145,-122.666298,-122.672677,-122.673311,-122.675572,-122.681893,-122.682505,-122.694678,-122.697382,-122.698697,-122.701808,-122.702001,-122.703304,-122.705021,-122.707893,-122.712169,-122.715938,-122.719286,-122.721355,-122.721663,-122.725541,-122.7303,-122.733422,-122.738563,-122.741101,-122.743721,-122.743718,-122.743703,-122.743691,-122.743673,-122.743668,-122.743649,-122.743659,-122.743667,-122.743672,-122.743663,-122.743654,-122.743626,-122.743671,-122.743681,-122.743711,-122.743745,-122.743746,-122.743758,-122.743798,-122.743799,-122.743809,-122.743785,-122.743803,-122.743805,-122.743813,-122.743815,-122.743828,-122.743847,-122.743856,-122.743859,-122.743859,-122.743862,-122.764464,-122.764486,-122.764472,-122.764459,-122.764458,-122.764439,-122.764436,-122.764412,-122.765076,-122.76609,-122.77215,-122.774659,-122.779838,-122.78234,-122.783624,-122.784232,-122.784864,-122.784768,-122.784769,-122.78477,-122.784771,-122.795111,-122.792699,-122.795914,-122.796057,-122.803132,-122.804585,-122.805432,-122.805481,-122.826005,-122.826222,-122.826342,-122.846978,-122.846905,-122.846849,-122.866745,-122.867592,-122.867495,-122.868303,-122.887963,-122.887837,-122.908992,-122.909078,-122.918725,-122.929128,-122.929193],"lat":[45.671015,45.67835,45.69381,45.698697,45.721482,45.721378,45.721418,45.721416,45.720946,45.72865,45.728665,45.7285767375573,45.699637,45.6980030214684,45.680437,45.657138,45.6564319354118,45.6468852157137,45.644138,45.637438,45.6249517318773,45.6248398415969,45.624739,45.6181727840074,45.6180749177675,45.618039,45.609739,45.6092842265807,45.6078989364008,45.607639,45.6052506713647,45.6047425360023,45.6041005214526,45.60394,45.5974429961583,45.5972128260687,45.5971575305685,45.597046180342,45.596768,45.5961361625816,45.589632,45.5859286680353,45.5840412856794,45.583281,45.579761,45.5786549714616,45.578305,45.5768358833279,45.5680385200064,45.567313,45.563585,45.5667315782601,45.567633,45.5710983445711,45.5726047893983,45.574541,45.5755594821359,45.575941,45.5740234392524,45.569441,45.558502299525,45.5557737334935,45.548241,45.543541,45.5435418617228,45.543841,45.544321,45.5450981314783,45.547745,45.5477731000169,45.564141,45.5672822170685,45.577696,45.5803711516712,45.584508,45.582945,45.582967,45.582573,45.582617,45.581409,45.583516,45.5841961560057,45.609516,45.615151,45.61593,45.622812,45.624839,45.632784,45.6359407622737,45.643559,45.644951,45.644169,45.6491618990508,45.610761,45.608288,45.607635,45.605163,45.601297,45.598698,45.597109,45.593684,45.591609,45.589685,45.587287,45.585484,45.582447,45.581241,45.579733,45.576484,45.575168,45.571163,45.568211,45.566826,45.566723,45.564983,45.56255,45.561935,45.561121,45.559517,45.55686,45.55619,45.549992,45.548941,45.547614,45.546673,45.543205,45.537275,45.535329,45.532567,45.530303,45.529082,45.526749,45.524655,45.520828,45.51853,45.514896,45.513388,45.512631,45.512252,45.512408,45.513125,45.514295,45.515751,45.514598,45.514103,45.508715,45.506786,45.504495,45.501814,45.499168,45.496923,45.495096,45.492844,45.489377,45.489006,45.486638,45.486502,45.483377,45.481329,45.47907,45.476188,45.476109,45.474619,45.472492,45.470184,45.467466,45.465469,45.46333,45.461675,45.461674,45.460226,45.460237,45.461403,45.461534,45.46058,45.461299,45.460039,45.460828,45.460837,45.460935,45.461422,45.461412,45.461394,45.461439,45.46149,45.461529,45.461502,45.461426,45.461222,45.46123,45.461276,45.4613,45.461421,45.461581,45.461579,45.461134,45.461001,45.460974,45.460941,45.461127,45.461135,45.461173,45.461184,45.461183,45.461176,45.461138,45.461132,45.460982,45.461028,45.46107,45.461107,45.461187,45.461252,45.461256,45.46126,45.461262,45.461273,45.461296,45.461318,45.461353,45.461058,45.461045,45.461053,45.461062,45.461307,45.461365,45.46138,45.461392,45.461518,45.461494,45.461487,45.461483,45.461522,45.46149,45.461458,45.461458,45.461458,45.461457,45.461457,45.461457,45.461453,45.461453,45.461454,45.461464,45.461486,45.461488,45.461493,45.461505,45.461501,45.461493,45.461481,45.461473,45.460889,45.460832,45.460933,45.460908,45.461451,45.461444,45.461451,45.46155,45.461474,45.461476,45.461482,45.458671,45.458669,45.458318,45.458314,45.458066,45.457819,45.454341,45.453242,45.445741,45.445281,45.443983,45.441424,45.439584,45.436059,45.432811,45.432718,45.432668,45.432702,45.432743,45.432743,45.432792,45.432795,45.432867,45.432841,45.432841,45.43301,45.433041,45.433041,45.433041,45.433056,45.433038,45.433037,45.433042,45.433056,45.433079,45.433113,45.433135,45.433137,45.433167,45.43324,45.433199,45.433238,45.433268,45.433294,45.435079,45.442944,45.444663,45.447284,45.447693,45.454892,45.456685,45.458486,45.465576,45.467532,45.469466,45.476439,45.476442,45.477961,45.484201,45.487084,45.48725,45.488258,45.494401,45.494665,45.497618,45.505017,45.506834,45.507374,45.507886,45.508181,45.509582,45.512509,45.5144,45.515754,45.516665,45.519509,45.519562,45.526737,45.528166,45.529634,45.529727,45.531184,45.531344,45.533822,45.533858,45.533852,45.533815,45.533809,45.533897,45.533946,45.533971,45.533982,45.533994,45.54232,45.543979,45.545158,45.5484,45.548433,45.54935,45.552082,45.555695,45.555689,45.556182,45.555687,45.562911,45.563041,45.568063,45.577521,45.577516,45.581018,45.591836,45.591881,45.591878,45.606226,45.606223,45.606352,45.620466,45.620763,45.635228,45.635399,45.635313,45.671015]}]],[[{"lng":[-119.672228,-119.667065,-119.603647,-119.593374,-119.552894,-119.544565,-119.306611,-119.306043,-119.162966,-119.002263,-118.946612,-118.675353,-118.518689,-118.468871,-118.469598,-118.469023,-118.464283,-118.457035,-118.456019,-118.452852,-118.448093,-118.446315,-118.446726,-118.445887,-118.444209,-118.44167,-118.437351,-118.436403,-118.437612,-118.437462,-118.438524,-118.438268,-118.437099,-118.438286,-118.439339,-118.4361,-118.433878,-118.430751,-118.425078,-118.42272,-118.418766,-118.416289,-118.411093,-118.408772,-118.405273,-118.404535,-118.40065,-118.39872,-118.39477,-118.392626,-118.389864,-118.390399,-118.390619,-118.387479,-118.38708,-118.387501,-118.386538,-118.381016,-118.380085,-118.378083,-118.375376,-118.373475,-118.370856,-118.368541,-118.367815,-118.366738,-118.364214,-118.359455,-118.358389,-118.356759,-118.356323,-118.351765,-118.350693,-118.34662,-118.342078,-118.339081,-118.336217,-118.3346,-118.331747,-118.32962,-118.329464,-118.324554,-118.323544,-118.321271,-118.320187,-118.318969,-118.315687,-118.314562,-118.311985,-118.308527,-118.308807,-118.307603,-118.305238,-118.304524,-118.302714,-118.299819,-118.298941,-118.299031,-118.296386,-118.292543,-118.290194,-118.287892,-118.286304,-118.284328,-118.282246,-118.28229,-118.280496,-118.278403,-118.277008,-118.276006,-118.274333,-118.272668,-118.270121,-118.267939,-118.264747,-118.263148,-118.260454,-118.256409,-118.254562,-118.251326,-118.244662,-118.243553,-118.244533,-118.24364,-118.245043,-118.244382,-118.24161,-118.237322,-118.23623,-118.233636,-118.229663,-118.227547,-118.226449,-118.223449,-118.225709,-118.226727,-118.226561,-118.22828,-118.231337,-118.232128,-118.231634,-118.227791,-118.229421,-118.232795,-118.235115,-118.237399,-118.236831,-118.234808,-118.235656,-118.235589,-118.236369,-118.235329,-118.231462,-118.232402,-118.230979,-118.229972,-118.226627,-118.224904,-118.228056,-118.22816,-118.227459,-118.228076,-118.23518,-118.236861,-118.24055,-118.242499,-118.246533,-118.253802,-118.258237,-118.261829,-118.264012,-118.267786,-118.2759,-118.279179,-118.283489,-118.2872,-118.289794,-118.295659,-118.296234,-118.294716,-118.294909,-118.293566,-118.29906,-118.302862,-118.306764,-118.306817,-118.309246,-118.312281,-118.314454,-118.3187,-118.317934,-118.313907,-118.308421,-118.30847,-118.310056,-118.311173,-118.308837,-118.307233,-118.307522,-118.304572,-118.303366,-118.300975,-118.296269,-118.295068,-118.294827,-118.296548,-118.298077,-118.2978,-118.296578,-118.298355,-118.299459,-118.294383,-118.293393,-118.294019,-118.294094,-118.292122,-118.290151,-118.284994,-118.283385,-118.28311,-118.286294,-118.287422,-118.28984,-118.289351,-118.288299,-118.286739,-118.286281,-118.286743,-118.285439,-118.289862,-118.292079,-118.294194,-118.296443,-118.29877,-118.300094,-118.302565,-118.305462,-118.306628,-118.311639,-118.316347,-118.319306,-118.321741,-118.325783,-118.329785,-118.332304,-118.336355,-118.339207,-118.343374,-118.346502,-118.350798,-118.35243,-118.358121,-118.361673,-118.365587,-118.367621,-118.372775,-118.376666,-118.379786,-118.381491,-118.383411,-118.383321,-118.385176,-118.387277,-118.387177,-118.391704,-118.391656,-118.394052,-118.393659,-118.395839,-118.40025,-118.403611,-118.413647,-118.417419,-118.418867,-118.418247,-118.419907,-118.419381,-118.422747,-118.425086,-118.43182,-118.432064,-118.433707,-118.435673,-118.437712,-118.440003,-118.443456,-118.445862,-118.45227,-118.459157,-118.460487,-118.461866,-118.460802,-118.461528,-118.464244,-118.468284,-118.470581,-118.473427,-118.476922,-118.480904,-118.483704,-118.488174,-118.491292,-118.492404,-118.495257,-118.495729,-118.496169,-118.496583,-118.496787,-118.497422,-118.497865,-118.498161,-118.498373,-118.498457,-118.499774,-118.501794,-118.505765,-118.507765,-118.509705,-118.513679,-118.516539,-118.518181,-118.51944,-118.519174,-118.516452,-118.51749,-118.51765,-118.518688,-118.517591,-118.513986,-118.512691,-118.511088,-118.510957,-118.50892,-118.507077,-118.507257,-118.504437,-118.504435,-118.500889,-118.497947,-118.493278,-118.488713,-118.485639,-118.48214,-118.47732,-118.473527,-118.472734,-118.463113,-118.460962,-118.456063,-118.453139,-118.451401,-118.446702,-118.441788,-118.438184,-118.436806,-118.433626,-118.432342,-118.429638,-118.425197,-118.422329,-118.41909,-118.417036,-118.414113,-118.412928,-118.41088,-118.410214,-118.404947,-118.403639,-118.402581,-118.399942,-118.393181,-118.391024,-118.388087,-118.38634,-118.386038,-118.379855,-118.377906,-118.375037,-118.372365,-118.3711,-118.368572,-118.36454,-118.362249,-118.360273,-118.355851,-118.354824,-118.353557,-118.343684,-118.343208,-118.342172,-118.342194,-118.344374,-118.341779,-118.341699,-118.342567,-118.341934,-118.338063,-118.338852,-118.337588,-118.336404,-118.333246,-118.329297,-118.319431,-118.316589,-118.314537,-118.312564,-118.309704,-118.311853,-118.311696,-118.309328,-118.305778,-118.305777,-118.306961,-118.308934,-118.311222,-118.310984,-118.315622,-118.314069,-118.316873,-118.315482,-118.31769,-118.317296,-118.31982,-118.322737,-118.323526,-118.32617,-118.327739,-118.328495,-118.332254,-118.334252,-118.337408,-118.337886,-118.343274,-118.343872,-118.345607,-118.346866,-118.346234,-118.347614,-118.347966,-118.346739,-118.349305,-118.351025,-118.352379,-118.354821,-118.354205,-118.356315,-118.358417,-118.359224,-118.364066,-118.365535,-118.369628,-118.37153,-118.372225,-118.370803,-118.371036,-118.368806,-118.371346,-118.374236,-118.374509,-118.373523,-118.374563,-118.373195,-118.372863,-118.370202,-118.367772,-118.366115,-118.364615,-118.365086,-118.363427,-118.360667,-118.357986,-118.362312,-118.367042,-118.36365,-118.36231,-118.360732,-118.36514,-118.367973,-118.36939,-118.372852,-118.375367,-118.376741,-118.378302,-118.380034,-118.383108,-118.386097,-118.388293,-118.39201,-118.394593,-118.398703,-118.402845,-118.405392,-118.408786,-118.411069,-118.41351,-118.418155,-118.419336,-118.420911,-118.421542,-118.422173,-118.421545,-118.420601,-118.420366,-118.418457,-118.420684,-118.423597,-118.422102,-118.422418,-118.42895,-118.429108,-118.428322,-118.430919,-118.431147,-118.434066,-118.434853,-118.435954,-118.434932,-118.43501,-118.431707,-118.425493,-118.427067,-118.428483,-118.428326,-118.424394,-118.422586,-118.421329,-118.417555,-118.413703,-118.409774,-118.40889,-118.407612,-118.410955,-118.413314,-118.420455,-118.430374,-118.432812,-118.433813,-118.433579,-118.432384,-118.433621,-118.435357,-118.43437,-118.436986,-118.440356,-118.447799,-118.452455,-118.456729,-118.457563,-118.458579,-118.461061,-118.46887,-118.469096,-118.467883,-118.47266,-118.474848,-118.478595,-118.478727,-118.48124,-118.481412,-118.482345,-118.484647,-118.486512,-118.488681,-118.490468,-118.49507,-118.496152,-118.497321,-118.498411,-118.500117,-118.49732,-118.497499,-118.447185,-118.354145,-118.354122,-118.23217,-118.232214,-118.233908,-118.228843,-118.228541,-118.227645,-118.347856,-118.347859,-118.466299,-118.467308,-118.587125,-118.587172,-118.799711,-118.81689,-118.816931,-118.857192,-118.867264,-118.932024,-119.614325,-119.657183,-119.656838,-119.654993,-119.655517,-119.655248,-119.655108,-119.653696,-119.653832,-119.653673,-119.653885,-119.653538,-119.653476,-119.653347,-119.653184,-119.652431,-119.671532,-119.672228],"lat":[44.995117,44.994664,44.994539,44.99531,44.995311,44.995689,44.995993,44.995696,44.996241,44.996558,44.997439,44.997662,44.995877,44.995176,44.992707,44.991737,44.989822,44.990257,44.989514,44.989289,44.990623,44.990024,44.988471,44.986767,44.986752,44.985326,44.984781,44.98298,44.980277,44.978587,44.977115,44.975192,44.971665,44.968054,44.96625,44.96242,44.96256,44.963891,44.963809,44.965656,44.967006,44.968752,44.971192,44.973309,44.975031,44.976476,44.975912,44.97436,44.973976,44.972544,44.972402,44.974115,44.97756,44.979407,44.980483,44.983786,44.983712,44.98129,44.979488,44.980115,44.981894,44.981597,44.982434,44.984037,44.985957,44.986714,44.990763,44.992301,44.992174,44.990605,44.988214,44.987824,44.987332,44.986988,44.983748,44.979593,44.978879,44.976675,44.975827,44.973393,44.972329,44.971889,44.972832,44.973044,44.975415,44.975929,44.974252,44.972586,44.971568,44.972016,44.970771,44.969659,44.969209,44.968488,44.968559,44.963839,44.963426,44.96063,44.960768,44.962913,44.962755,44.964509,44.965046,44.964459,44.964726,44.963114,44.962104,44.961771,44.96023,44.957896,44.957348,44.957659,44.957313,44.958731,44.95929,44.958896,44.956655,44.956934,44.956457,44.956351,44.958396,44.956525,44.951086,44.950096,44.945198,44.94431,44.943198,44.942695,44.941213,44.940104,44.941695,44.939778,44.939575,44.93691,44.933778,44.931409,44.930012,44.926032,44.924687,44.923482,44.921531,44.918361,44.913854,44.911514,44.91053,44.908385,44.906927,44.904173,44.902902,44.901367,44.898643,44.897046,44.894063,44.891028,44.887149,44.882349,44.878634,44.875568,44.872332,44.870332,44.867783,44.865544,44.862587,44.86166,44.862344,44.863165,44.864071,44.864851,44.863351,44.866013,44.866412,44.869386,44.866573,44.866271,44.865007,44.865367,44.866421,44.863043,44.862086,44.859376,44.856606,44.853018,44.850451,44.848153,44.846614,44.843855,44.841107,44.840039,44.838066,44.836274,44.834937,44.832422,44.830613,44.828794,44.824802,44.823236,44.821229,44.821148,44.819407,44.818712,44.81733,44.816426,44.816164,44.813191,44.809344,44.807807,44.802979,44.800259,44.799211,44.798705,44.796442,44.790167,44.787936,44.787259,44.784664,44.780412,44.77925,44.773003,44.772211,44.77072,44.767331,44.767165,44.765439,44.763371,44.762708,44.759278,44.757123,44.754323,44.750975,44.749868,44.747389,44.746564,44.74698,44.746248,44.746025,44.747643,44.746949,44.74528,44.744241,44.743986,44.742082,44.74151,44.74162,44.74358,44.742467,44.742609,44.743944,44.744444,44.743912,44.743996,44.744738,44.745573,44.745474,44.747126,44.747213,44.745628,44.745249,44.744357,44.742041,44.740717,44.738868,44.739093,44.737389,44.735949,44.734328,44.731398,44.728998,44.727872,44.726005,44.72647,44.724808,44.727122,44.726986,44.724884,44.722776,44.721846,44.718693,44.719488,44.718554,44.719766,44.721091,44.720729,44.721555,44.721547,44.722886,44.724173,44.723436,44.719166,44.715774,44.712657,44.710861,44.708948,44.707521,44.706374,44.705666,44.704,44.705289,44.709199,44.710035,44.71003,44.710944,44.712393,44.713621,44.712865,44.712425,44.712027,44.711729,44.711606,44.711339,44.711163,44.710958,44.710678,44.710619,44.709055,44.708664,44.709331,44.708903,44.706237,44.7061,44.704765,44.706081,44.705886,44.704031,44.702462,44.695931,44.692755,44.691562,44.690074,44.688532,44.684021,44.681049,44.679134,44.677878,44.675417,44.67433,44.669929,44.665556,44.665925,44.665698,44.663566,44.664484,44.663639,44.661871,44.66142,44.658729,44.656632,44.65559,44.656297,44.655396,44.653084,44.652859,44.650017,44.652451,44.653206,44.654376,44.652691,44.652595,44.653966,44.654828,44.652801,44.648687,44.647164,44.646543,44.644739,44.644169,44.643025,44.641444,44.641388,44.643381,44.643539,44.642871,44.643001,44.641555,44.642928,44.644419,44.64645,44.645905,44.646102,44.645121,44.643484,44.643038,44.639823,44.639769,44.637965,44.639377,44.639263,44.635601,44.631821,44.631204,44.628403,44.626656,44.625024,44.621341,44.618969,44.617901,44.616775,44.61249,44.61098,44.609502,44.610007,44.608374,44.608771,44.605442,44.603863,44.601609,44.597549,44.595679,44.592251,44.591181,44.589939,44.58881,44.587851,44.58605,44.585317,44.582581,44.581034,44.577082,44.575043,44.572539,44.570658,44.569192,44.567896,44.566543,44.564173,44.562368,44.56119,44.562207,44.563778,44.565112,44.564453,44.565182,44.567029,44.562544,44.560056,44.559716,44.556217,44.554977,44.553654,44.551086,44.550466,44.548608,44.548037,44.54759,44.545392,44.542545,44.541274,44.539108,44.536041,44.537216,44.538112,44.53281,44.531191,44.528638,44.526215,44.523791,44.521255,44.519056,44.514035,44.512089,44.509207,44.507891,44.506397,44.50479,44.502494,44.498025,44.496334,44.493629,44.491714,44.488219,44.485906,44.484385,44.480101,44.478912,44.474856,44.474066,44.471699,44.469162,44.466621,44.466172,44.462786,44.459231,44.45958,44.461433,44.462276,44.45974,44.458504,44.458337,44.456869,44.457882,44.457777,44.456458,44.454457,44.452648,44.452872,44.454282,44.455921,44.456766,44.455072,44.453439,44.448984,44.444531,44.443008,44.438442,44.432468,44.428179,44.426207,44.423503,44.421752,44.416737,44.414309,44.411717,44.40997,44.4088,44.407153,44.403825,44.401907,44.399426,44.397508,44.39858,44.398748,44.397454,44.394828,44.394126,44.391195,44.388993,44.385782,44.383807,44.380988,44.378619,44.372909,44.370845,44.373036,44.373543,44.371744,44.369882,44.36914,44.368133,44.364889,44.362848,44.359247,44.356125,44.353977,44.352126,44.350936,44.350716,44.349406,44.346428,44.344848,44.340343,44.336551,44.334584,44.325517,44.322048,44.319045,44.318331,44.315917,44.313051,44.309518,44.306626,44.304536,44.302617,44.297932,44.294188,44.289246,44.288546,44.287046,44.28383,44.278536,44.277057,44.277036,44.255248,44.255211,44.255384,44.256824,44.257343,44.256129,44.212548,44.21255,44.183239,44.039862,44.039075,44.040388,44.040374,44.040375,44.040266,44.046995,44.047775,44.047828,43.960733,43.960227,43.960462,43.960374,43.959593,43.95892,44.220277,44.220276,44.307045,44.34547,44.389206,44.38917,44.454961,44.461288,44.534131,44.621785,44.652251,44.652252,44.762701,44.823299,44.823343,44.995117]}]],[[{"lng":[-123.816709,-123.734996,-123.735153,-123.715538,-123.715675,-123.715866,-123.72014,-123.720065,-123.720071,-123.699976,-123.68952,-123.679097,-123.66875,-123.648669,-123.608115,-123.597677,-123.59763,-123.597233,-123.596134,-123.596674,-123.596919,-123.596929,-123.602817,-123.602794,-123.603143,-123.602609,-123.580966,-123.54132,-123.47056,-123.438419,-123.414116,-123.409764,-123.339138,-123.316612,-123.301882,-123.240276,-123.23521,-123.221593,-123.201917,-123.182025,-123.149025,-123.147507,-123.147489,-123.145982,-123.143316,-123.1366,-123.133244,-123.126206,-123.12453,-123.121299,-123.119339,-123.119212,-123.117517,-123.116892,-123.114522,-123.111736,-123.105532,-123.100643,-123.092509,-123.089254,-123.087313,-123.086173,-123.084184,-123.07836,-123.074838,-123.073643,-123.073132,-123.074291,-123.078206,-123.088313,-123.095339,-123.09675,-123.101193,-123.105311,-123.105836,-123.108685,-123.110063,-123.112528,-123.119519,-123.121978,-123.126206,-123.133623,-123.136988,-123.14252,-123.150434,-123.15707,-123.16132,-123.164428,-123.17088,-123.171739,-123.172124,-123.171855,-123.169674,-123.17011,-123.171626,-123.174226,-123.179922,-123.181816,-123.183175,-123.183449,-123.182812,-123.18291,-123.18392,-123.187849,-123.19519,-123.198028,-123.198645,-123.198355,-123.19701,-123.191431,-123.18719,-123.184161,-123.183202,-123.183011,-123.185375,-123.18564,-123.19195,-123.195441,-123.203044,-123.206301,-123.214573,-123.221793,-123.227875,-123.232606,-123.251209,-123.251831,-123.25212,-123.253373,-123.254317,-123.256178,-123.260251,-123.260791,-123.260739,-123.260151,-123.250991,-123.247404,-123.24292,-123.242113,-123.241754,-123.24579,-123.248391,-123.250254,-123.253376,-123.251728,-123.250029,-123.245055,-123.240081,-123.238067,-123.233093,-123.231079,-123.228001,-123.22581,-123.222672,-123.218023,-123.214683,-123.212619,-123.211967,-123.214343,-123.215082,-123.214409,-123.214778,-123.219354,-123.221019,-123.220156,-123.219144,-123.214276,-123.213426,-123.213992,-123.216169,-123.216462,-123.213822,-123.211785,-123.211866,-123.211306,-123.209831,-123.208492,-123.206317,-123.205287,-123.207587,-123.209194,-123.212903,-123.215459,-123.21886,-123.224857,-123.227466,-123.228054,-123.227685,-123.225841,-123.222195,-123.21938,-123.219345,-123.220377,-123.222904,-123.226797,-123.229311,-123.229331,-123.229324,-123.229146,-123.22896,-123.227668,-123.225099,-123.22345,-123.223614,-123.229297,-123.233258,-123.235868,-123.238668,-123.242821,-123.244952,-123.245157,-123.244701,-123.242288,-123.239283,-123.23416,-123.230813,-123.22595,-123.223754,-123.221167,-123.219011,-123.219661,-123.222699,-123.226797,-123.229529,-123.23319,-123.235048,-123.235102,-123.233245,-123.230581,-123.229399,-123.228599,-123.228518,-123.229898,-123.232316,-123.237425,-123.240744,-123.245334,-123.245678,-123.244844,-123.239365,-123.236564,-123.229862,-123.224557,-123.220295,-123.21691,-123.217585,-123.216802,-123.217302,-123.216178,-123.214125,-123.211304,-123.204394,-123.200105,-123.197359,-123.193766,-123.193097,-123.193752,-123.190897,-123.18975,-123.190365,-123.193657,-123.193575,-123.191102,-123.187851,-123.183671,-123.180388,-123.200385,-123.224885,-123.230044,-123.248679,-123.288655,-123.328667,-123.367696,-123.371408,-123.371411,-123.451272,-123.455686,-123.471685,-123.472186,-123.532858,-123.556039,-123.573614,-123.59329,-123.593513,-123.715377,-123.715386,-123.723588,-123.767931,-123.775598,-123.775789,-123.816525,-123.816709],"lat":[44.344622,44.345778,44.36035,44.360458,44.379969,44.389495,44.389506,44.432329,44.433374,44.433788,44.433582,44.433928,44.432935,44.43342,44.433671,44.433109,44.46932,44.477454,44.477454,44.541804,44.545624,44.651139,44.651159,44.702125,44.709242,44.721154,44.719415,44.72127,44.720722,44.720622,44.720552,44.720531,44.720059,44.719994,44.719835,44.719914,44.720146,44.720125,44.720099,44.720085,44.720225,44.717047,44.714848,44.711407,44.70831,44.702178,44.700002,44.696014,44.693903,44.691353,44.684493,44.682083,44.678592,44.676966,44.675549,44.674826,44.674763,44.675959,44.675887,44.674727,44.672546,44.66814,44.665294,44.662326,44.659373,44.657331,44.652359,44.649613,44.646585,44.643195,44.641107,44.640814,44.639818,44.639202,44.63915,44.639262,44.639801,44.640594,44.640896,44.640363,44.639291,44.638056,44.637775,44.63787,44.637507,44.637269,44.637619,44.637507,44.634245,44.632428,44.628866,44.62779,44.624542,44.622674,44.621011,44.620036,44.619901,44.619,44.61745,44.616087,44.613029,44.611036,44.609246,44.60723,44.604953,44.602857,44.60042,44.599046,44.59756,44.595896,44.595583,44.594289,44.593077,44.590002,44.587298,44.587179,44.585814,44.585615,44.586063,44.586028,44.585376,44.584597,44.583056,44.581496,44.574626,44.574095,44.573848,44.572781,44.571477,44.566167,44.559351,44.557491,44.556365,44.555148,44.551983,44.550583,44.548154,44.547324,44.544575,44.539654,44.536969,44.532434,44.52887,44.526486,44.525947,44.526172,44.528059,44.527969,44.524644,44.522623,44.516608,44.513286,44.510982,44.51022,44.507681,44.504978,44.501218,44.495079,44.494188,44.491014,44.488627,44.486962,44.484751,44.482585,44.481805,44.479649,44.476371,44.473803,44.471695,44.468473,44.460622,44.457143,44.452756,44.450269,44.448576,44.447397,44.445745,44.443038,44.437074,44.435239,44.434572,44.434638,44.434205,44.434126,44.433293,44.431889,44.42996,44.426664,44.422371,44.419436,44.416461,44.415712,44.416941,44.417256,44.415073,44.414213,44.414127,44.41312,44.41221,44.406912,44.39935,44.395505,44.393452,44.388135,44.386089,44.385229,44.384887,44.385352,44.384143,44.382254,44.380821,44.377715,44.374888,44.37205,44.371131,44.370322,44.36901,44.366149,44.362497,44.35993,44.359588,44.360124,44.359847,44.358396,44.356979,44.354622,44.352618,44.348468,44.345995,44.344606,44.342591,44.340852,44.339869,44.338879,44.337789,44.33363,44.332099,44.330984,44.329186,44.328999,44.330779,44.331266,44.32943,44.324952,44.32066,44.317272,44.313726,44.310808,44.309747,44.309222,44.308716,44.308829,44.308573,44.306974,44.305646,44.303354,44.29984,44.295892,44.294963,44.292272,44.290742,44.287587,44.285562,44.28493,44.283725,44.283725,44.283725,44.283725,44.283726,44.283724,44.283725,44.283719,44.283725,44.281021,44.280496,44.280647,44.281185,44.281471,44.281523,44.281402,44.282597,44.281915,44.276699,44.280267,44.283946,44.283944,44.283606,44.283547,44.316167,44.315303,44.344622]}]],[[{"lng":[-121.031202,-121.026348,-121.024374,-121.022556,-121.019811,-121.018483,-121.018588,-121.017429,-121.01569,-121.01079,-121.007455,-121.005447,-121.000973,-120.997673,-120.992973,-120.990473,-120.988673,-120.986474,-120.985498,-120.982776,-120.979647,-120.973089,-120.972589,-120.97387,-120.974381,-120.973344,-120.97218,-120.969577,-120.966974,-120.963672,-120.959771,-120.956471,-120.955773,-120.954171,-120.947171,-120.946071,-120.945771,-120.946472,-120.953872,-120.955372,-120.955072,-120.953672,-120.949472,-120.946372,-120.940771,-120.938471,-120.935871,-120.93377,-120.93237,-120.932169,-120.933068,-120.935868,-120.939568,-120.939628,-120.938472,-120.934171,-120.930471,-120.923671,-120.921771,-120.920471,-120.919771,-120.920475,-120.920371,-120.918671,-120.914371,-120.909271,-120.904671,-120.901065,-120.899371,-120.899771,-120.898171,-120.89428,-120.889071,-120.883445,-120.883039,-120.881064,-120.879164,-120.877522,-120.872479,-120.868265,-120.866962,-120.865759,-120.866075,-120.868235,-120.868569,-120.86607,-120.86657,-120.86157,-120.86267,-120.86287,-120.86209,-120.85917,-120.854872,-120.852271,-120.84987,-120.84947,-120.851771,-120.856371,-120.859571,-120.863971,-120.865071,-120.865771,-120.865371,-120.862871,-120.861871,-120.861471,-120.860972,-120.859072,-120.856571,-120.847671,-120.845671,-120.837971,-120.836073,-120.835571,-120.837371,-120.837471,-120.839171,-120.839071,-120.838172,-120.833377,-120.833178,-120.83458,-120.838981,-120.838881,-120.837783,-120.836184,-120.834585,-120.828587,-120.82629,-120.825731,-120.827084,-120.833877,-120.838772,-120.841972,-120.853673,-120.854473,-120.864073,-120.865268,-120.869928,-120.874893,-120.877966,-120.882656,-120.884318,-120.884777,-120.884644,-120.884983,-120.890264,-120.896833,-120.898438,-120.899356,-120.903006,-120.908459,-120.909382,-120.908205,-120.906528,-120.905657,-120.905899,-120.904815,-120.903013,-120.896872,-120.895674,-120.895397,-120.896478,-120.898788,-120.901176,-120.906075,-120.909275,-120.911675,-120.911282,-120.906375,-120.904375,-120.903975,-120.904775,-120.907361,-120.909223,-120.912191,-120.914281,-120.914976,-120.915795173154,-120.913476,-120.895575,-120.885616086084,-120.870042,-120.855674,-120.836141479114,-120.788872,-120.724171,-120.68937,-120.668869,-120.6535343441,-120.649368,-120.649368,-120.646168,-120.646068,-120.643668,-120.640368,-120.638568,-120.635868,-120.631668,-120.629067,-120.624467,-120.618567,-120.612267,-120.609967,-120.606167,-120.604867,-120.603466,-120.603766,-120.602466,-120.600466,-120.593766,-120.587066,-120.583366,-120.577565,-120.574265,-120.572265,-120.569465,-120.567465,-120.566965,-120.560065,-120.558264,-120.556464,-120.553064,-120.552064,-120.551164,-120.549064,-120.547364,-120.544783,-120.539245,-120.535308,-120.531013,-120.528516,-120.524742,-120.520924,-120.517573,-120.515688,-120.513313,-120.510188,-120.508107,-120.506384,-120.499805,-120.498461,-120.496624,-120.493853,-120.490833,-120.488779,-120.488689,-120.489739,-120.492223,-120.492223,-120.491732,-120.489585,-120.485156,-120.48244,-120.48231,-120.479903,-120.479474,-120.478341,-120.47836,-120.479181,-120.480276,-120.482367,-120.485326,-120.486421,-120.484741,-120.481042,-120.479303,-120.477833,-120.478087,-120.477475,-120.472696,-120.469915,-120.47018,-120.46897,-120.46795,-120.464725,-120.459735,-120.45746,-120.453915,-120.452159,-120.449588,-120.44422,-120.440538,-120.438299,-120.439925,-120.444612,-120.446258,-120.446592,-120.444248,-120.438889,-120.432693,-120.428135,-120.426305,-120.421999,-120.416052,-120.411699,-120.410742,-120.409413,-120.408982,-120.409128,-120.408536,-120.40536,-120.404938,-120.402654,-120.402578,-120.404832,-120.407117,-120.407663,-120.407038,-120.405673,-120.402107,-120.401323,-120.392574,-120.390763,-120.388305,-120.386122,-120.385845,-120.384579,-120.381856,-120.377466,-120.372265,-120.365267,-120.359875,-120.35798,-120.357804,-120.359512,-120.365401,-120.369313,-120.372139,-120.375793,-120.376156,-120.380486,-120.380493,-120.379469,-120.377837,-120.376304,-120.370994,-120.367013,-120.365217,-120.364122,-120.360771,-120.359976,-120.360827,-120.363246,-120.364955,-120.365655,-120.367855,-120.373427,-120.377756,-120.382056,-120.386686,-120.394456,-120.399056,-120.405557,-120.409557,-120.414957,-120.422581,-120.426856,-120.426057,-120.423357,-120.424257,-120.423257,-120.420557,-120.417857,-120.412857,-120.411057,-120.407256,-120.407022,-120.409948,-120.416409,-120.421449,-120.422903,-120.429082,-120.43323,-120.438779,-120.441284,-120.446592,-120.449907,-120.45441,-120.459937,-120.462291,-120.46966,-120.472759,-120.477559,-120.481228,-120.483859,-120.490359,-120.495859,-120.493459,-120.491759,-120.489859,-120.486359,-120.482359,-120.481559,-120.483459,-120.489859,-120.493659,-120.495159,-120.496859,-120.496059,-120.492159,-120.487859,-120.484435,-120.482941,-120.483658,-120.486758,-120.492259,-120.493959,-120.501159,-120.501859,-120.505859,-120.506459,-120.506059,-120.502959,-120.494059,-120.489058,-120.484158,-120.482958,-120.484258,-120.489258,-120.492258,-120.495759,-120.498759,-120.501159,-120.502659,-120.506259,-120.507959,-120.509659,-120.514759,-120.519859,-120.525059,-120.527559,-120.528659,-120.519359,-120.518459,-120.523059,-120.525259,-120.528159,-120.530159,-120.532059,-120.532559,-120.529759,-120.522659,-120.515159,-120.513358,-120.512558,-120.513158,-120.514958,-120.516659,-120.521859,-120.524059,-120.523459,-120.524459,-120.527059,-120.532059,-120.534459,-120.534659,-120.531859,-120.530659,-120.533659,-120.533659,-120.535559,-120.540159,-120.543059,-120.543359,-120.541459,-120.533958,-120.532458,-120.531258,-120.530458,-120.531258,-120.530758,-120.530958,-120.531958,-120.534358,-120.539658,-120.541258,-120.539358,-120.535158,-120.529458,-120.527358,-120.528058,-120.527458,-120.530358,-120.538758,-120.540458,-120.540758,-120.538858,-120.531858,-120.525558,-120.524658,-120.524057,-120.524457,-120.527757,-120.531558,-120.534658,-120.536858,-120.537758,-120.538558,-120.540358,-120.542258,-120.545458,-120.548158,-120.547758,-120.546658,-120.544258,-120.542758,-120.543158,-120.544858,-120.547358,-120.553358,-120.555558,-120.553158,-120.549158,-120.547858,-120.542858,-120.541758,-120.540257,-120.540289,-120.541857,-120.545158,-120.546358,-120.547057,-120.544657,-120.541657,-120.538157,-120.535957,-120.533657,-120.534457,-120.535757,-120.540657,-120.542857,-120.550957,-120.554457,-120.556057,-120.552057,-120.550663,-120.551139,-120.550357,-120.546457,-120.544157,-120.542956,-120.541656,-120.543656,-120.545356,-120.544856,-120.541956,-120.540056,-120.534156,-120.530056,-120.528456,-120.525956,-120.524455,-120.523855,-120.524455,-120.527555,-120.529355,-120.533055,-120.537556,-120.540256,-120.542856,-120.543008,-120.541755,-120.540955,-120.536755,-120.534055,-120.532555,-120.531655,-120.529055,-120.524155,-120.521555,-120.520455,-120.521254,-120.519354,-120.516054,-120.509454,-120.506254,-120.502854,-120.497954,-120.493553,-120.48849,-120.484853,-120.481653,-120.480953,-120.481153,-120.482353,-120.487153,-120.487653,-120.485552,-120.483352,-120.480152,-120.474752,-120.472652,-120.473652,-120.476752,-120.480152,-120.482552,-120.484052,-120.483552,-120.480252,-120.476852,-120.472951,-120.469549,-120.468551,-120.468951,-120.471551,-120.474951,-120.476251,-120.476751,-120.476251,-120.475351,-120.466995,-120.464991,-120.46295,-120.457069,-120.45225,-120.44886,-120.450097,-120.453041,-120.45505,-120.45865,-120.46045,-120.46215,-120.465706,-120.463787,-120.460249,-120.458449,-120.458449,-120.461049,-120.460549,-120.461249,-120.463448,-120.463648,-120.462548,-120.464548,-120.467448,-120.468449,-120.468849,-120.470649,-120.476849,-120.479249,-120.482849,-120.486949,-120.491949,-120.494749,-120.498149,-120.50115,-120.50345,-120.506864,-120.51005,-120.51485,-120.512249,-120.508549,-120.504449,-120.503733,-120.504419,-120.626232,-120.688617,-120.729792,-120.730182,-120.729292,-120.729487,-120.728574,-120.726329,-120.727391,-120.727052,-120.728455,-120.727736,-120.726605,-120.725299,-120.722581,-120.721768,-120.720072,-120.718099,-120.719022,-120.718381,-120.718645,-120.722032,-120.722779,-120.72414,-120.72332,-120.724375,-120.723166,-120.726786,-120.727515,-120.731003,-120.733197,-120.734189,-120.737715,-120.739885,-120.742358,-120.744025,-120.745747,-120.74657,-120.747881,-120.74927,-120.75116,-120.753057,-120.75508,-120.757615,-120.761281,-120.761838,-120.76099,-120.764167,-120.765987,-120.76907,-120.769379,-120.767914,-120.767269,-120.769803,-120.770957,-120.771887,-120.776469,-120.779175,-120.781447,-120.785207,-120.789015,-120.790705,-120.791689,-120.793721,-120.79614,-120.797512,-120.799513,-120.801544,-120.802598,-120.804459,-120.807057,-120.810019,-120.810337,-120.814098,-120.816572,-120.818038,-120.82114,-120.824421,-120.826779,-120.828702,-120.830944,-120.8339,-120.83473,-120.837282,-120.838408,-120.841194,-120.846485,-120.848278,-120.850241,-120.852133,-120.855029,-120.857412,-120.858274,-120.862649,-120.866917,-120.869892,-120.874104,-120.880732,-120.883252,-120.885464,-120.889357,-120.890777,-120.891826,-120.893665,-120.89586,-120.896262,-120.900336,-120.903867,-120.906598,-120.907903,-120.91103,-120.913498,-120.915516,-120.920404,-120.921218,-120.918168,-120.919952,-120.92356,-120.925671,-120.928255,-120.929924,-120.930986,-120.932135,-120.933105,-120.934796,-120.937582,-120.939568,-120.940399,-120.941741,-120.943269,-120.944643,-120.945892,-120.948817,-120.949477,-120.95345,-120.955009,-120.952541,-120.952936,-120.95377,-120.960641,-120.96269,-120.965499,-120.969286,-120.971202,-120.976906,-120.978751,-120.979915,-120.981623,-120.982904,-120.984454,-120.987364,-120.987691,-120.990604,-120.992661,-120.994305,-120.996115,-120.996341,-120.998011,-121.002122,-121.004846,-121.005607,-121.00779,-121.009205,-121.012104,-121.013426,-121.012758,-121.01339,-121.015251,-121.017818,-121.018916,-121.019213,-121.017603,-121.017866,-121.022616,-121.024,-121.024294,-121.023358,-121.021783,-121.020802,-121.023205,-121.02369,-121.019103,-121.020535,-121.022339,-121.024289,-121.020562,-121.022387,-121.022886,-121.025146,-121.025194,-121.023648,-121.023799,-121.0217,-121.022667,-121.022588,-121.023321,-121.022639,-121.024033,-121.022217,-121.020367,-121.018924,-121.019468,-121.023617,-121.024876,-121.024135,-121.021053,-121.017426,-121.017771,-121.020739,-121.028421,-121.03044,-121.031202],"lat":[45.285857,45.288917,45.289725,45.291386,45.294684,45.297022,45.301504,45.30514,45.307148,45.309269,45.31006,45.309698,45.307644,45.306544,45.307444,45.309344,45.312644,45.318543,45.320256,45.321963,45.322652,45.320315,45.319027,45.316643,45.312945,45.309899,45.308635,45.307437,45.30694,45.306845,45.307945,45.310345,45.313445,45.316745,45.323445,45.325045,45.327145,45.331345,45.333445,45.334445,45.335645,45.337245,45.337645,45.336745,45.332645,45.331345,45.330844,45.331343,45.332443,45.336443,45.337843,45.340244,45.342046,45.345588,45.346845,45.347745,45.347745,45.347345,45.348045,45.349245,45.351645,45.356144,45.359344,45.361345,45.362645,45.362145,45.360745,45.361596,45.364245,45.370245,45.374445,45.378322,45.383145,45.387278,45.390457,45.392552,45.392414,45.391687,45.388216,45.38852,45.389224,45.391231,45.393451,45.397879,45.401146,45.409346,45.412746,45.422746,45.425346,45.427346,45.428414,45.428645,45.426945,45.427145,45.428545,45.431445,45.433645,45.434645,45.435846,45.439046,45.440546,45.445046,45.446046,45.448446,45.450346,45.454546,45.456246,45.459946,45.461546,45.461946,45.462746,45.467346,45.469146,45.471246,45.474546,45.475646,45.479546,45.483245,45.485645,45.493046,45.494646,45.497345,45.501841,45.502441,45.504841,45.506742,45.507742,45.509945,45.511466,45.514077,45.515307,45.515968,45.515946,45.517546,45.521846,45.523446,45.528746,45.528848,45.528391,45.526944,45.526771,45.527564,45.529435,45.531695,45.538782,45.539326,45.541614,45.54268,45.543979,45.549261,45.553406,45.558241,45.561148,45.564497,45.565662,45.568928,45.571842,45.576068,45.579033,45.585914,45.586685,45.589342,45.592333,45.596399,45.598387,45.600345,45.602445,45.605245,45.608839,45.613245,45.615745,45.617145,45.621645,45.626731,45.627939,45.632496,45.634693,45.636345,45.641301218792,45.640045,45.642945,45.6500815780723,45.661242,45.671545,45.6758434879127,45.686246,45.706446,45.715847,45.730147,45.7372486812962,45.732947,45.730246,45.726146,45.723946,45.722346,45.721046,45.720846,45.721546,45.720646,45.721346,45.722047,45.721447,45.717847,45.715847,45.714547,45.713047,45.706647,45.704747,45.702847,45.702247,45.701548,45.701648,45.700048,45.698648,45.696048,45.695448,45.693748,45.690648,45.686048,45.682348,45.681648,45.679448,45.678348,45.677548,45.672548,45.670148,45.669048,45.669195,45.671165,45.671852,45.671899,45.671177,45.668983,45.667379,45.666867,45.66608,45.66596,45.665119,45.663944,45.661515,45.656275,45.655788,45.655522,45.656147,45.655946,45.654991,45.654794,45.651677,45.648977,45.648871,45.643504,45.643312,45.645171,45.645177,45.645166,45.645151,45.644858,45.642019,45.640653,45.639518,45.639181,45.639391,45.638269,45.637158,45.635036,45.634178,45.633047,45.630668,45.628747,45.627752,45.626368,45.624827,45.622829,45.620066,45.619321,45.619673,45.621577,45.622016,45.624286,45.62586,45.626584,45.627031,45.626112,45.622848,45.621291,45.618006,45.615692,45.613944,45.607454,45.602365,45.598438,45.597302,45.597164,45.597602,45.597026,45.596067,45.595318,45.592508,45.589052,45.583655,45.581893,45.576728,45.574605,45.569936,45.567051,45.565666,45.563101,45.559754,45.557779,45.556725,45.555641,45.554154,45.551701,45.549859,45.548723,45.546732,45.54431,45.541528,45.538808,45.537535,45.537733,45.537249,45.535359,45.533713,45.531459,45.530316,45.53113,45.531392,45.530644,45.528385,45.527588,45.523731,45.521584,45.519428,45.518166,45.518095,45.516641,45.515253,45.51424,45.51263,45.509832,45.508034,45.505691,45.501064,45.49725,45.49655,45.49525,45.493714,45.49295,45.49445,45.496787,45.49705,45.49695,45.49745,45.49825,45.49875,45.50051,45.49795,45.49395,45.49195,45.48605,45.48365,45.48285,45.48305,45.48255,45.48185,45.47445,45.473147,45.470332,45.468636,45.468017,45.469243,45.471716,45.472994,45.475768,45.478877,45.48369,45.485275,45.485194,45.480212,45.478808,45.476929,45.476149,45.472649,45.471983,45.470249,45.468949,45.465349,45.462649,45.462049,45.462449,45.461749,45.459549,45.456549,45.455349,45.453649,45.451849,45.450549,45.446949,45.444049,45.443649,45.442549,45.440716,45.438548,45.435549,45.434349,45.434249,45.434549,45.433999,45.433249,45.431749,45.430649,45.428249,45.427949,45.428249,45.426949,45.422849,45.420549,45.419249,45.416849,45.417349,45.418649,45.419049,45.418749,45.417249,45.407749,45.405749,45.405049,45.404349,45.405449,45.405249,45.403449,45.400349,45.396349,45.394649,45.388849,45.387249,45.386549,45.385449,45.383249,45.381549,45.380449,45.381849,45.381149,45.380649,45.378649,45.376849,45.375649,45.375749,45.377849,45.376849,45.373549,45.372549,45.371849,45.371249,45.370249,45.368449,45.366149,45.363849,45.358149,45.352949,45.351749,45.349949,45.347649,45.346049,45.345249,45.344149,45.343649,45.342049,45.339249,45.336549,45.335149,45.332249,45.331449,45.331449,45.330649,45.329349,45.327749,45.328449,45.328149,45.324249,45.320949,45.319149,45.317549,45.315849,45.314749,45.311549,45.309749,45.309049,45.305749,45.304049,45.30015,45.29915,45.295949,45.294749,45.295049,45.296349,45.297849,45.302749,45.304349,45.304549,45.302549,45.298349,45.296449,45.295549,45.291449,45.288049,45.285649,45.284449,45.284449,45.283249,45.281249,45.279649,45.281049,45.281049,45.279649,45.279049,45.276049,45.274864,45.271849,45.269049,45.267249,45.262949,45.261649,45.261649,45.262449,45.26185,45.25905,45.25585,45.25495,45.253255,45.253849,45.253349,45.252749,45.250449,45.246649,45.244146,45.242426,45.240849,45.237249,45.236649,45.235149,45.231949,45.228449,45.223949,45.222449,45.220249,45.219849,45.22325,45.22465,45.22465,45.22385,45.22255,45.22035,45.21885,45.21675,45.21635,45.21665,45.21785,45.217049,45.213649,45.212507,45.210349,45.209949,45.21115,45.21125,45.21065,45.20605,45.20475,45.20445,45.20535,45.20445,45.20265,45.20105,45.19925,45.19785,45.19615,45.19555,45.19575,45.19765,45.197233,45.19485,45.19335,45.19125,45.18895,45.18665,45.18365,45.18075,45.17955,45.17945,45.18015,45.17975,45.17765,45.17565,45.17325,45.17235,45.17235,45.17155,45.17025,45.16895,45.16835,45.16595,45.16494,45.16355,45.16215,45.15955,45.15775,45.15645,45.15415,45.15185,45.15105,45.146686,45.144196,45.14405,45.145483,45.14545,45.143185,45.140883,45.139253,45.13945,45.13885,45.13795,45.13505,45.130127,45.125985,45.12315,45.12065,45.11945,45.11625,45.11165,45.10865,45.10515,45.10375,45.10115,45.10015,45.10155,45.10285,45.10695,45.10855,45.11165,45.11015,45.10505,45.10435,45.10585,45.10575,45.10455,45.1041,45.10265,45.102778,45.10135,45.09465,45.09095,45.08725,45.08565,45.083477,45.083477,45.083589,45.083695,45.083731,45.085907,45.086873,45.088765,45.089885,45.091092,45.093143,45.095639,45.097334,45.099715,45.100225,45.103616,45.105245,45.106348,45.106596,45.111056,45.114616,45.117583,45.119629,45.121757,45.124848,45.126089,45.127872,45.129578,45.130522,45.131673,45.132358,45.133054,45.135077,45.134533,45.1344,45.134805,45.136159,45.136322,45.137567,45.139557,45.140314,45.142267,45.142428,45.144024,45.144321,45.143845,45.144461,45.145745,45.149272,45.150189,45.153147,45.155435,45.156511,45.157141,45.158737,45.160367,45.162337,45.162694,45.162405,45.163256,45.162708,45.164184,45.163077,45.163302,45.164828,45.165086,45.164483,45.165388,45.165421,45.166442,45.167929,45.168318,45.167194,45.170074,45.170973,45.172641,45.172219,45.172811,45.175916,45.17698,45.175965,45.176743,45.178981,45.179206,45.180176,45.181246,45.184218,45.185869,45.1877,45.189509,45.190206,45.189711,45.193073,45.193862,45.195112,45.19465,45.196764,45.198991,45.198138,45.199481,45.200624,45.199802,45.202305,45.202158,45.201016,45.200704,45.202121,45.203031,45.203406,45.202794,45.203096,45.200337,45.199614,45.199505,45.198189,45.197811,45.198744,45.201804,45.20288,45.201783,45.20033,45.199781,45.200555,45.203523,45.203315,45.201543,45.200106,45.2006,45.199612,45.198147,45.198131,45.200084,45.200797,45.200171,45.200435,45.201916,45.201454,45.200533,45.199129,45.196589,45.196232,45.197026,45.198343,45.198167,45.200064,45.199855,45.200423,45.19887,45.198832,45.200164,45.20007,45.197788,45.198917,45.200376,45.204264,45.204362,45.203313,45.204881,45.206422,45.208369,45.20892,45.20822,45.209422,45.211071,45.211051,45.208977,45.210143,45.21213,45.212996,45.213307,45.212389,45.212678,45.215473,45.216733,45.217611,45.217972,45.218455,45.219531,45.220811,45.22145,45.222909,45.22377,45.225219,45.227813,45.229872,45.23038,45.232197,45.235346,45.236331,45.237762,45.23835,45.239548,45.241133,45.241928,45.245501,45.246643,45.249845,45.251226,45.261002,45.264107,45.264793,45.266282,45.268668,45.270476,45.271766,45.275176,45.27644,45.278573,45.281969,45.284738,45.28618,45.284328,45.28481,45.285857]}]],[[{"lng":[-123.260791,-123.260251,-123.256178,-123.254317,-123.253373,-123.25212,-123.251831,-123.251209,-123.232606,-123.227875,-123.221793,-123.214573,-123.206301,-123.203044,-123.195441,-123.19195,-123.18564,-123.185375,-123.183011,-123.183202,-123.184161,-123.18719,-123.191431,-123.19701,-123.198355,-123.198645,-123.198028,-123.19519,-123.187849,-123.18392,-123.18291,-123.182812,-123.183449,-123.183175,-123.181816,-123.179922,-123.174226,-123.171626,-123.17011,-123.169674,-123.171855,-123.172124,-123.171739,-123.17088,-123.164428,-123.16132,-123.15707,-123.150434,-123.14252,-123.136988,-123.133623,-123.126206,-123.121978,-123.119519,-123.112528,-123.110063,-123.108685,-123.105836,-123.105311,-123.101193,-123.09675,-123.095339,-123.088313,-123.078206,-123.074291,-123.073132,-123.073643,-123.074838,-123.07836,-123.084184,-123.086173,-123.087313,-123.089254,-123.092509,-123.100643,-123.105532,-123.111736,-123.114522,-123.116892,-123.117517,-123.119212,-123.119339,-123.121299,-123.12453,-123.126206,-123.133244,-123.1366,-123.143316,-123.145982,-123.147489,-123.147507,-123.149025,-123.150297,-123.150763,-123.150429,-123.146582,-123.137819,-123.133529,-123.132445,-123.1327,-123.135106,-123.137757,-123.140884,-123.143843,-123.142191,-123.139759,-123.13696,-123.133831,-123.12769,-123.123007,-123.120155,-123.119733,-123.120253,-123.118721,-123.113025,-123.111578,-123.107712,-123.106032,-123.105377,-123.100881,-123.099242,-123.095772,-123.092658,-123.089503,-123.086457,-123.081389,-123.078903,-123.076375,-123.07173,-123.066818,-123.062154,-123.061117,-123.060721,-123.061431,-123.061853,-123.060106,-123.055342,-123.053026,-123.050025,-123.044987,-123.043527,-123.042037,-123.041354,-123.040809,-123.039988,-123.039828,-123.039451,-123.041897,-123.042756,-123.041567,-123.03941,-123.035804,-123.034095,-123.031884,-123.027127,-123.024002,-123.019999,-123.018153,-123.016667,-123.015825,-123.015148,-123.01509,-123.01474,-123.013866,-123.013824,-123.014433,-123.015049,-123.015765,-123.016551,-123.017345,-123.018679,-123.018747,-123.018734,-123.018598,-123.018367,-123.018107,-123.015982,-123.014599,-123.01383,-123.013065,-123.012491,-123.01133,-123.010604,-123.007595,-123.006847,-123.005477,-123.004903,-123.001831,-123.000013,-122.998717,-122.996297,-122.996025,-122.997623,-122.998293,-122.996175,-122.993648,-122.991695,-122.990027,-122.988675,-122.986746,-122.985042,-122.979769,-122.975862,-122.974427,-122.973649,-122.973993,-122.97364,-122.97265,-122.971694,-122.969086,-122.964661,-122.962703,-122.957256,-122.955481,-122.949349,-122.947659,-122.943228,-122.937846,-122.93408,-122.931922,-122.929381,-122.929887,-122.928097,-122.925638,-122.922578,-122.919464,-122.919518,-122.916886,-122.913298,-122.909888,-122.909232,-122.906842,-122.90538,-122.902456,-122.900612,-122.899397,-122.897648,-122.895184,-122.892398,-122.891829,-122.890258,-122.884958,-122.882731,-122.87453,-122.873245,-122.873219,-122.871689,-122.868847,-122.864965,-122.861237,-122.856157,-122.852323,-122.849696,-122.8471,-122.846935,-122.848492,-122.847178,-122.845145,-122.842851,-122.839763,-122.839136,-122.832797,-122.828925,-122.825426,-122.821487,-122.819465,-122.815899,-122.813769,-122.813636,-122.812321,-122.807949,-122.805408,-122.803195,-122.804166,-122.800709,-122.794418,-122.793327,-122.787691,-122.783465,-122.779831,-122.778248,-122.773998,-122.768613,-122.765303,-122.763398,-122.762124,-122.759186,-122.757763,-122.753221,-122.748027,-122.743446,-122.737302,-122.732714,-122.729355,-122.727945,-122.726418,-122.724795,-122.721705,-122.719631,-122.715588,-122.713778,-122.705411,-122.700531,-122.696463,-122.694844,-122.690864,-122.683555,-122.680574,-122.677492,-122.670774,-122.66985,-122.660327,-122.653472,-122.65029,-122.645826,-122.64073,-122.639144,-122.634129,-122.627139,-122.621327,-122.620463,-122.618014,-122.61524,-122.607766,-122.603458,-122.599469,-122.597363,-122.582836,-122.576929,-122.572269,-122.5701,-122.569953,-122.568548,-122.568195,-122.56693,-122.564402,-122.56151,-122.553888,-122.546669,-122.542407,-122.541561,-122.538944,-122.536666,-122.532911,-122.531042,-122.521912,-122.52029,-122.522561,-122.52245,-122.520625,-122.520605,-122.519439,-122.511612,-122.50559,-122.503151,-122.496565,-122.487637,-122.484798,-122.480122,-122.477499,-122.475677,-122.475968,-122.475835,-122.473551,-122.469302,-122.46124,-122.457333,-122.454774,-122.443897,-122.443103,-122.442151,-122.441817,-122.44036,-122.436918,-122.435041,-122.431319,-122.428316,-122.423287,-122.419433,-122.412346,-122.411213,-122.410988,-122.410944,-122.411198,-122.41099,-122.41,-122.408208,-122.406298,-122.4027,-122.400882,-122.397991,-122.394416,-122.39138,-122.38863,-122.382079,-122.378629,-122.372462,-122.370076,-122.362732,-122.35614,-122.354329,-122.34955,-122.343213,-122.340708,-122.334685,-122.333374,-122.328534,-122.325742,-122.32137,-122.318858,-122.317447,-122.311568,-122.308786,-122.306909,-122.302935,-122.300164,-122.292897,-122.288569,-122.282872,-122.278591,-122.276675,-122.27376,-122.274,-122.273067,-122.271886,-122.269612,-122.264381,-122.261423,-122.259394,-122.255448,-122.255066,-122.253592,-122.250044,-122.247582,-122.246528,-122.245971,-122.242203,-122.23706,-122.237408,-122.23292,-122.231438,-122.23037,-122.22769,-122.224659,-122.222145,-122.220719,-122.218413,-122.21445,-122.210663,-122.207421,-122.204021,-122.199334,-122.198685,-122.198046,-122.196732,-122.193924,-122.189405,-122.184557,-122.179739,-122.178684,-122.174251,-122.171843,-122.166572,-122.164191,-122.161118,-122.156292,-122.154325,-122.152774,-122.149224,-122.14237,-122.138702,-122.132685,-122.130972,-122.128698,-122.124247,-122.122466,-122.121442,-122.119821,-122.119828,-122.118702,-122.11344,-122.110688,-122.108719,-122.107563,-122.103815,-122.100326,-122.096559,-122.09404,-122.088617,-122.086244,-122.08412,-122.081091,-122.077104,-122.075401,-122.074393,-122.071823,-122.069796,-122.068144,-122.065765,-122.063939,-122.060621,-122.058813,-122.056484,-122.054415,-122.050762,-122.047028,-122.046094,-122.045304,-122.040875,-122.03598,-122.034171,-122.033006,-122.030498,-122.028916,-122.026339,-122.024106,-122.020851,-122.01847,-122.016709,-122.015715,-122.011684,-122.008804,-122.005291,-122.003216,-122.001009,-121.999761,-121.996208,-121.992926,-121.984527,-121.981681,-121.980176,-121.977179,-121.974303,-121.973503,-121.971604,-121.967345,-121.966375,-121.964997,-121.963805,-121.799562,-121.800402,-121.800929,-121.799675,-121.799241,-121.800345,-121.800936,-121.800563,-121.801611,-121.801092,-121.798296,-121.798435,-121.798805,-121.799036,-121.798969,-121.79865,-121.797993,-121.797622,-121.797991,-121.799566,-121.799432,-121.797945,-121.800054,-121.801352,-121.80273,-121.802244,-121.80419,-121.805488,-121.805763,-121.808206,-121.807491,-121.80941,-121.810189,-121.811566,-121.81069,-121.806559,-121.804756,-121.802325,-121.802162,-121.800331,-121.798646,-121.800926,-121.800216,-121.795192,-121.795273,-121.793895,-121.79518,-121.796859,-121.798363,-121.799965,-121.799081,-121.800051,-121.79921,-121.800617,-121.801265,-121.800708,-121.801798,-121.803133,-121.802093,-121.802801,-121.803286,-121.804825,-121.807092,-121.806817,-121.807657,-121.811331,-121.813604,-121.8138,-121.815832,-121.816317,-121.816073,-121.813482,-121.812509,-121.813074,-121.811212,-121.809419,-121.809382,-121.809865,-121.814698,-121.815638,-121.818283,-121.819453,-121.823104,-121.824155,-121.82561,-121.829007,-121.832405,-121.834668,-121.839796,-121.843914,-121.844861,-121.84688,-121.847359,-121.848875,-121.84938,-121.847034,-121.845971,-121.844366,-121.843049,-121.844256,-121.844453,-121.843955,-121.847093,-121.849512,-121.849462,-121.847634,-121.847291,-121.848791,-121.848139,-121.848677,-121.847502,-121.844408,-121.84291,-121.841128,-121.841535,-121.844711,-121.846615,-121.846191,-121.847578,-121.847561,-121.845745,-121.84552,-121.845334,-121.844403,-121.845531,-121.843146,-121.843244,-121.841332,-121.842528,-121.845745,-121.845128,-121.846519,-121.846756,-121.846123,-121.843218,-121.843138,-121.843906,-121.843159,-121.845488,-121.846471,-121.843678,-121.845412,-121.844616,-121.843342,-121.841952,-121.843679,-121.844914,-121.845989,-121.843458,-121.842406,-121.839822,-121.83738,-121.836875,-121.837076,-121.839415,-121.84041,-121.8439,-121.843443,-121.841828,-121.840536,-121.838253,-121.837607,-121.838718,-121.838718,-121.83956,-121.838263,-121.839298,-121.840783,-121.840443,-121.838989,-121.838745,-121.840333,-121.840437,-121.838501,-121.83719,-121.838672,-121.838296,-121.838676,-121.839829,-121.840178,-121.841105,-121.840588,-121.841346,-121.837029,-121.832349,-121.829123,-121.825631,-121.824693,-121.824493,-121.825031,-121.824508,-121.822017,-121.820794,-121.820058,-121.818602,-121.819172,-121.814002,-121.812668,-121.807791,-121.80525,-121.800871,-121.799426,-121.960126,-121.964517,-122.028016,-122.027996,-122.228368,-122.264527,-122.264527,-122.32715,-122.32949,-122.332446,-122.331478,-122.328531,-122.325744,-122.328729,-122.327313,-122.330673,-122.331857,-122.334249,-122.336791,-122.339923,-122.340612,-122.347714,-122.352623,-122.354488,-122.355447,-122.35689,-122.358069,-122.361244,-122.363745,-122.364257,-122.367197,-122.371128,-122.373799,-122.379589,-122.38457,-122.384561,-122.404781,-122.404748,-122.425089,-122.425081,-122.426446,-122.430218,-122.434885,-122.438796,-122.442879,-122.445272,-122.448436,-122.451074,-122.456337,-122.457892,-122.463518,-122.465628,-122.468798,-122.470829,-122.47368,-122.478045,-122.479635,-122.484305,-122.488381,-122.492272,-122.497,-122.499506,-122.503182,-122.507203,-122.510561,-122.511964,-122.512251,-122.513425,-122.519391,-122.522442,-122.528191,-122.529542,-122.531171,-122.532942,-122.532614,-122.533745,-122.535382,-122.539632,-122.543711,-122.545794,-122.548543,-122.549707,-122.551917,-122.554953,-122.558723,-122.562413,-122.565493,-122.567339,-122.570153,-122.573085,-122.577232,-122.57778,-122.575169,-122.5754,-122.57677,-122.579831,-122.582028,-122.585624,-122.588363,-122.591986,-122.593471,-122.599071,-122.604621,-122.608342,-122.611738,-122.617391,-122.622312,-122.624857,-122.631432,-122.637437,-122.639699,-122.640716,-122.644082,-122.64493,-122.645763,-122.644542,-122.64679,-122.646853,-122.651583,-122.652553,-122.655773,-122.657909,-122.663697,-122.665931,-122.668915,-122.670787,-122.674283,-122.676247,-122.678543,-122.680863,-122.683333,-122.686703,-122.689353,-122.692063,-122.693973,-122.696412,-122.696076,-122.700224,-122.704483,-122.706473,-122.710473,-122.71472,-122.717134,-122.721184,-122.722692,-122.724937,-122.725089,-122.725697,-122.727574,-122.731121,-122.738128,-122.742034,-122.744584,-122.746347,-122.749834,-122.753255,-122.758014,-122.758905,-122.762735,-122.768734,-122.771265,-122.774074,-122.776319,-122.779134,-122.781625,-122.784205,-122.788615,-122.791085,-122.795605,-122.798259,-122.802825,-122.804727,-122.807156,-122.811705,-122.814416,-122.817065,-122.819352,-122.823015,-122.82527,-122.829074,-122.828717,-122.830352,-122.830451,-122.833148,-122.835135,-122.837442,-122.839919,-122.843403,-122.845096,-122.846854,-122.849343,-122.852796,-122.856452,-122.860134,-122.861992,-122.865465,-122.865545,-122.872923,-122.884125,-122.903999,-122.905755,-122.979199,-122.97952,-122.985827,-123.038121,-123.038427,-123.040799,-123.060853,-123.07167,-123.127696,-123.165428,-123.166002,-123.164226,-123.160434,-123.15787,-123.15911,-123.155708,-123.152389,-123.150627,-123.15034,-123.1512,-123.153386,-123.156542,-123.159533,-123.163604,-123.166868,-123.169341,-123.171308,-123.174204,-123.175342,-123.17878,-123.178903,-123.177701,-123.17501,-123.174938,-123.174054,-123.174174,-123.175133,-123.175977,-123.179931,-123.180388,-123.183671,-123.187851,-123.191102,-123.193575,-123.193657,-123.190365,-123.18975,-123.190897,-123.193752,-123.193097,-123.193766,-123.197359,-123.200105,-123.204394,-123.211304,-123.214125,-123.216178,-123.217302,-123.216802,-123.217585,-123.21691,-123.220295,-123.224557,-123.229862,-123.236564,-123.239365,-123.244844,-123.245678,-123.245334,-123.240744,-123.237425,-123.232316,-123.229898,-123.228518,-123.228599,-123.229399,-123.230581,-123.233245,-123.235102,-123.235048,-123.23319,-123.229529,-123.226797,-123.222699,-123.219661,-123.219011,-123.221167,-123.223754,-123.22595,-123.230813,-123.23416,-123.239283,-123.242288,-123.244701,-123.245157,-123.244952,-123.242821,-123.238668,-123.235868,-123.233258,-123.229297,-123.223614,-123.22345,-123.225099,-123.227668,-123.22896,-123.229146,-123.229324,-123.229331,-123.229311,-123.226797,-123.222904,-123.220377,-123.219345,-123.21938,-123.222195,-123.225841,-123.227685,-123.228054,-123.227466,-123.224857,-123.21886,-123.215459,-123.212903,-123.209194,-123.207587,-123.205287,-123.206317,-123.208492,-123.209831,-123.211306,-123.211866,-123.211785,-123.213822,-123.216462,-123.216169,-123.213992,-123.213426,-123.214276,-123.219144,-123.220156,-123.221019,-123.219354,-123.214778,-123.214409,-123.215082,-123.214343,-123.211967,-123.212619,-123.214683,-123.218023,-123.222672,-123.22581,-123.228001,-123.231079,-123.233093,-123.238067,-123.240081,-123.245055,-123.250029,-123.251728,-123.253376,-123.250254,-123.248391,-123.24579,-123.241754,-123.242113,-123.24292,-123.247404,-123.250991,-123.260151,-123.260739,-123.260791],"lat":[44.557491,44.559351,44.566167,44.571477,44.572781,44.573848,44.574095,44.574626,44.581496,44.583056,44.584597,44.585376,44.586028,44.586063,44.585615,44.585814,44.587179,44.587298,44.590002,44.593077,44.594289,44.595583,44.595896,44.59756,44.599046,44.60042,44.602857,44.604953,44.60723,44.609246,44.611036,44.613029,44.616087,44.61745,44.619,44.619901,44.620036,44.621011,44.622674,44.624542,44.62779,44.628866,44.632428,44.634245,44.637507,44.637619,44.637269,44.637507,44.63787,44.637775,44.638056,44.639291,44.640363,44.640896,44.640594,44.639801,44.639262,44.63915,44.639202,44.639818,44.640814,44.641107,44.643195,44.646585,44.649613,44.652359,44.657331,44.659373,44.662326,44.665294,44.66814,44.672546,44.674727,44.675887,44.675959,44.674763,44.674826,44.675549,44.676966,44.678592,44.682083,44.684493,44.691353,44.693903,44.696014,44.700002,44.702178,44.70831,44.711407,44.714848,44.717047,44.720225,44.722689,44.72578,44.727611,44.731585,44.736145,44.738662,44.741157,44.743363,44.745741,44.747062,44.747632,44.748914,44.7488,44.749592,44.751258,44.752109,44.751372,44.751272,44.752475,44.753731,44.756922,44.758445,44.759483,44.759049,44.752966,44.751034,44.748844,44.746553,44.746215,44.746539,44.747551,44.747011,44.745997,44.743343,44.743073,44.743504,44.74615,44.748094,44.748042,44.747124,44.744883,44.743405,44.738869,44.737684,44.737034,44.737627,44.73849,44.738451,44.73808,44.737595,44.73726,44.736823,44.735833,44.735417,44.733589,44.731045,44.728972,44.725243,44.723498,44.721804,44.720551,44.72107,44.723951,44.725578,44.725376,44.723642,44.72213,44.721154,44.719877,44.71976,44.717341,44.714894,44.712904,44.710897,44.709128,44.707409,44.705776,44.704244,44.700354,44.699592,44.699336,44.698774,44.69816,44.697591,44.694116,44.69276,44.691887,44.691194,44.690794,44.690091,44.689732,44.68794,44.686898,44.687041,44.68809,44.688924,44.686916,44.687233,44.689016,44.690286,44.69212,44.694101,44.695699,44.696058,44.693872,44.693479,44.694026,44.695985,44.696526,44.696492,44.697578,44.698606,44.700518,44.702888,44.705845,44.707984,44.709874,44.713103,44.714277,44.715557,44.721094,44.720937,44.718634,44.717986,44.715479,44.714889,44.71578,44.716995,44.719301,44.720663,44.72222,44.721852,44.723703,44.724935,44.726906,44.728611,44.729806,44.732507,44.736472,44.737503,44.739187,44.739819,44.741044,44.743794,44.744958,44.743985,44.745129,44.747499,44.748623,44.750569,44.751034,44.751136,44.752291,44.75506,44.757137,44.758216,44.7583,44.758055,44.759186,44.760755,44.76229,44.767536,44.769308,44.772644,44.774063,44.77468,44.774362,44.770896,44.770616,44.770298,44.77072,44.771708,44.775523,44.778194,44.777942,44.779591,44.783213,44.785209,44.785434,44.786855,44.78903,44.789678,44.791578,44.791537,44.791563,44.793666,44.794422,44.79278,44.792603,44.793463,44.792765,44.793174,44.792586,44.791419,44.790249,44.790451,44.789642,44.787738,44.787808,44.789479,44.789109,44.789677,44.792106,44.793214,44.792929,44.791364,44.789338,44.781647,44.780196,44.778523,44.777245,44.777267,44.77602,44.775417,44.776088,44.777371,44.777923,44.777574,44.777719,44.780277,44.781136,44.781976,44.782401,44.784738,44.787054,44.787861,44.787851,44.789107,44.789213,44.788863,44.788271,44.784075,44.782461,44.778181,44.777804,44.777214,44.776476,44.775558,44.774732,44.774716,44.774001,44.771258,44.769646,44.768072,44.767942,44.768217,44.767362,44.766239,44.765619,44.764863,44.766226,44.766867,44.766805,44.764031,44.762046,44.760641,44.758945,44.755686,44.754101,44.753486,44.752692,44.750074,44.749763,44.751043,44.754001,44.755009,44.755819,44.75489,44.753934,44.752567,44.752096,44.752139,44.753742,44.755564,44.755633,44.755259,44.755009,44.754725,44.753858,44.753404,44.753528,44.755458,44.756134,44.754761,44.752751,44.751448,44.753528,44.752011,44.752512,44.752753,44.753124,44.753908,44.754134,44.754428,44.754739,44.755006,44.755047,44.753697,44.752316,44.753131,44.755029,44.754362,44.752082,44.752014,44.754975,44.756511,44.757428,44.757225,44.75766,44.75804,44.756864,44.755972,44.755412,44.756323,44.756705,44.758759,44.758822,44.759289,44.758914,44.75621,44.75611,44.75549,44.75525,44.754257,44.753979,44.753062,44.750634,44.747099,44.746135,44.741007,44.738496,44.735506,44.734203,44.732929,44.73179,44.729275,44.728796,44.725706,44.723565,44.722504,44.722005,44.720745,44.719361,44.717246,44.713068,44.706416,44.705106,44.70099,44.698465,44.697668,44.697071,44.696937,44.695981,44.694399,44.693239,44.694456,44.696236,44.695977,44.697184,44.69617,44.696784,44.700798,44.703218,44.703152,44.703685,44.705819,44.707001,44.708729,44.710244,44.713151,44.71368,44.715565,44.717039,44.717671,44.719643,44.724254,44.726127,44.7261,44.725179,44.721143,44.718005,44.718001,44.717151,44.715879,44.714143,44.713165,44.71193,44.710977,44.710107,44.708855,44.707172,44.706996,44.707611,44.707154,44.705825,44.704358,44.702552,44.702147,44.699471,44.698712,44.700608,44.700734,44.700448,44.698365,44.697478,44.697193,44.696426,44.696384,44.697513,44.697043,44.693644,44.692955,44.692841,44.692286,44.688731,44.688263,44.688084,44.687338,44.685799,44.685691,44.687201,44.688861,44.689948,44.690218,44.689988,44.690819,44.690836,44.690576,44.687317,44.686724,44.688618,44.68911,44.687445,44.687755,44.690406,44.689704,44.69226,44.693787,44.693635,44.691065,44.692141,44.691926,44.689168,44.685483,44.685564,44.684129,44.683888,44.683915,44.683013,44.67856,44.676467,44.672991,44.671413,44.665891,44.663489,44.660301,44.657456,44.654228,44.653849,44.653385,44.652762,44.652275,44.651538,44.650642,44.649507,44.64721,44.646223,44.643578,44.640313,44.639156,44.637365,44.63719,44.636033,44.633771,44.63302,44.631081,44.628211,44.623723,44.622239,44.617967,44.615767,44.61439,44.613731,44.611599,44.610439,44.608412,44.606225,44.605198,44.603152,44.600249,44.597702,44.596546,44.594056,44.592814,44.588985,44.582152,44.581321,44.579193,44.576399,44.573115,44.572228,44.570839,44.567833,44.566362,44.564929,44.562017,44.559782,44.555321,44.553353,44.551851,44.548444,44.546928,44.545235,44.54353,44.541745,44.539172,44.537376,44.534596,44.531585,44.527784,44.525157,44.519831,44.517546,44.514425,44.513812,44.513325,44.512108,44.512981,44.512045,44.511203,44.510048,44.50698,44.504256,44.502985,44.499335,44.495385,44.492775,44.491746,44.49109,44.488942,44.486706,44.484523,44.483275,44.483372,44.481512,44.479035,44.475957,44.473565,44.471833,44.470459,44.468364,44.466672,44.464364,44.462899,44.461925,44.459549,44.458411,44.454743,44.451388,44.447288,44.444912,44.441974,44.437707,44.433879,44.431791,44.430542,44.428753,44.426582,44.424733,44.420456,44.417873,44.414634,44.413395,44.4118,44.41103,44.409387,44.408824,44.407373,44.404103,44.4022,44.398504,44.395459,44.39263,44.390962,44.389094,44.387299,44.385609,44.383067,44.380153,44.376556,44.37563,44.372889,44.372037,44.370509,44.366867,44.365129,44.361769,44.359568,44.358276,44.357319,44.355981,44.35436,44.351721,44.346432,44.342144,44.340291,44.33971,44.336549,44.334022,44.331492,44.329789,44.327522,44.325139,44.322279,44.320984,44.318174,44.31418,44.312483,44.310141,44.308217,44.307229,44.303011,44.300168,44.299044,44.29663,44.293641,44.291095,44.289461,44.287955,44.285652,44.286844,44.285323,44.28498,44.283437,44.282624,44.280192,44.274814,44.273641,44.271389,44.26845,44.267804,44.263933,44.26195,44.260241,44.260656,44.260147,44.259495,44.25955,44.25828,44.257313,44.257238,44.256164,44.253818,44.253847,44.253847,44.25263,44.252841,44.249537,44.243382,44.240603,44.238506,44.237579,44.234719,44.231189,44.229606,44.227653,44.226938,44.227001,44.224454,44.221577,44.221659,44.220742,44.219183,44.217265,44.216311,44.213326,44.211748,44.211945,44.21102,44.20938,44.209667,44.210413,44.20944,44.211013,44.217063,44.216938,44.22058,44.220657,44.218198,44.218544,44.220296,44.221306,44.21871,44.218543,44.217388,44.216748,44.21805,44.219036,44.220805,44.222209,44.223039,44.222599,44.222878,44.222406,44.219196,44.219132,44.22148,44.221927,44.219967,44.222308,44.222611,44.22167,44.223448,44.2262,44.227819,44.22982,44.231535,44.230717,44.228581,44.226498,44.226715,44.228633,44.22987,44.231511,44.233706,44.23486,44.23431,44.235184,44.235022,44.235588,44.235344,44.232295,44.231089,44.230568,44.231617,44.230575,44.229347,44.228689,44.229146,44.228044,44.22979,44.234628,44.235358,44.236587,44.237819,44.238046,44.239178,44.24123,44.242953,44.244427,44.24447,44.244228,44.245298,44.246867,44.247801,44.249852,44.25002,44.249189,44.249458,44.249263,44.251096,44.252551,44.253458,44.25681,44.260088,44.264246,44.266384,44.267078,44.26881,44.269688,44.271093,44.270062,44.269093,44.268902,44.270633,44.271849,44.273535,44.27327,44.274128,44.274459,44.27373,44.273948,44.275387,44.275771,44.277019,44.278893,44.279938,44.27822,44.279319,44.27937,44.281603,44.280931,44.281778,44.282775,44.283162,44.285639,44.286668,44.286529,44.28823,44.285828,44.287467,44.286051,44.285909,44.28473,44.28724,44.289137,44.290066,44.290537,44.288119,44.286729,44.284609,44.283816,44.283909,44.2834,44.283459,44.28565,44.285866,44.285708,44.284724,44.284435,44.283952,44.284171,44.27983,44.276269,44.27639,44.275804,44.27432,44.276858,44.277106,44.278525,44.28097,44.282166,44.282285,44.283455,44.282129,44.281352,44.281187,44.283601,44.284282,44.284298,44.285539,44.285373,44.285586,44.286662,44.287317,44.25898,44.258952,44.258894,44.259129,44.200736,44.200616,44.200613,44.200572,44.200129,44.200745,44.200136,44.200077,44.200024,44.200016,44.200071,44.201877,44.204725,44.207989,44.211612,44.214094,44.219947,44.222689,44.2252,44.226627,44.228779,44.231343,44.233269,44.233078,44.235315,44.240113,44.245854,44.247537,44.248114,44.248645,44.251601,44.253056,44.255751,44.259514,44.261582,44.266608,44.267131,44.275152,44.277606,44.283431,44.283725,44.28493,44.285562,44.287587,44.290742,44.292272,44.294963,44.295892,44.29984,44.303354,44.305646,44.306974,44.308573,44.308829,44.308716,44.309222,44.309747,44.310808,44.313726,44.317272,44.32066,44.324952,44.32943,44.331266,44.330779,44.328999,44.329186,44.330984,44.332099,44.33363,44.337789,44.338879,44.339869,44.340852,44.342591,44.344606,44.345995,44.348468,44.352618,44.354622,44.356979,44.358396,44.359847,44.360124,44.359588,44.35993,44.362497,44.366149,44.36901,44.370322,44.371131,44.37205,44.374888,44.377715,44.380821,44.382254,44.384143,44.385352,44.384887,44.385229,44.386089,44.388135,44.393452,44.395505,44.39935,44.406912,44.41221,44.41312,44.414127,44.414213,44.415073,44.417256,44.416941,44.415712,44.416461,44.419436,44.422371,44.426664,44.42996,44.431889,44.433293,44.434126,44.434205,44.434638,44.434572,44.435239,44.437074,44.443038,44.445745,44.447397,44.448576,44.450269,44.452756,44.457143,44.460622,44.468473,44.471695,44.473803,44.476371,44.479649,44.481805,44.482585,44.484751,44.486962,44.488627,44.491014,44.494188,44.495079,44.501218,44.504978,44.507681,44.51022,44.510982,44.513286,44.516608,44.522623,44.524644,44.527969,44.528059,44.526172,44.525947,44.526486,44.52887,44.532434,44.536969,44.539654,44.544575,44.547324,44.548154,44.550583,44.551983,44.555148,44.556365,44.557491]}]],[[{"lng":[-123.664749,-123.648969,-123.645909,-123.64362,-123.642355,-123.64134,-123.641389,-123.64295,-123.644987,-123.650637,-123.65773,-123.659517,-123.663013,-123.664993,-123.664749],"lat":[46.24431,46.248461,46.248494,46.248936,46.248754,46.247981,46.247204,46.246304,46.246071,46.244072,46.243367,46.243493,46.242576,46.242691,46.24431]}],[{"lng":[-124.012634,-124.005028,-124.000212,-123.999324,-123.996234,-123.988866,-123.988429,-123.991718,-123.995997,-123.995521,-123.989817,-123.986252,-123.98031,-123.972942,-123.961739,-123.953971,-123.950506,-123.950413615329,-123.947417,-123.927038,-123.924050837444,-123.923582,-123.905277,-123.903064,-123.900449,-123.902501,-123.891762,-123.883336,-123.878821,-123.87478,-123.860943,-123.859272926153,-123.859049388323,-123.857591219399,-123.85574673717,-123.854801,-123.847572098271,-123.847209,-123.845341184316,-123.842849,-123.839603,-123.838415,-123.838415,-123.838415,-123.838415,-123.838415,-123.838415,-123.843644,-123.851904098175,-123.859911,-123.861859819695,-123.862896,-123.866643,-123.864209,-123.85776,-123.854941,-123.849652258608,-123.846209,-123.838801,-123.824412679777,-123.821834,-123.798702737971,-123.793936,-123.787774156994,-123.783204,-123.771027240351,-123.770201,-123.766873,-123.763308,-123.757589,-123.750569859726,-123.748097,-123.744294,-123.735733,-123.725279,-123.718149,-123.69343,-123.693131268615,-123.67865639816,-123.674178,-123.67538,-123.672039,-123.666751,-123.660868,-123.6535,-123.644231,-123.632347,-123.626436257279,-123.619512,-123.614521,-123.60196,-123.595982,-123.582434,-123.559617,-123.548156,-123.547659,-123.538092,-123.526391,-123.516188,-123.501245,-123.479644,-123.474844,-123.468743,-123.46455181596,-123.447592,-123.436254852847,-123.427629,-123.428054143685,-123.430987,-123.422645419531,-123.390404,-123.379541,-123.371433,-123.363743140809,-123.36375,-123.364023,-123.364329,-123.364652,-123.365152,-123.365677,-123.365373,-123.365968,-123.366516,-123.367438,-123.359614,-123.359489,-123.360303,-123.360564,-123.360427,-123.360365,-123.360627,-123.358826,-123.360794,-123.361003,-123.361622,-123.48513,-123.485086,-123.54582,-123.56717,-123.644355,-123.653642,-123.662297,-123.682896,-123.703567,-123.720001,-123.71984,-123.84338,-123.86475,-123.957356,-123.969078621366,-123.968018,-123.968984,-123.965982,-123.961544,-123.962232,-123.964606,-123.963968585885,-123.962515,-123.962736,-123.964284,-123.965946886424,-123.967231,-123.966477037815,-123.965629,-123.965756551586,-123.967625694786,-123.96763,-123.969864540348,-123.971516,-123.971831,-123.97413,-123.978446,-123.978286,-123.977933,-123.980423,-123.983825,-123.983734,-123.985063,-123.988716,-123.99304,-123.991272,-123.993703,-123.988391,-123.98571,-123.980835,-123.974998,-123.973854,-123.975067,-123.974074,-123.972927,-123.969991,-123.957438,-123.956212174103,-123.952063,-123.941831,-123.937578073856,-123.937471,-123.936976303464,-123.936393232754,-123.933810595383,-123.927891,-123.927931398902,-123.927973474601,-123.928928749063,-123.92933,-123.929984556436,-123.933366,-123.941611463287,-123.941929939178,-123.947531,-123.95919,-123.961625301618,-123.963419924031,-123.96377569977,-123.974124,-123.977403593384,-123.986469758432,-123.996766,-124.010344,-124.021428,-124.012634],"lat":[46.23685,46.23833,46.236416,46.233726,46.22978,46.22715,46.224132,46.220408,46.219092,46.216461,46.209224,46.208237,46.206921,46.212678,46.207916,46.207159,46.20577,46.2056637980039,46.202219,46.191617,46.1907284574343,46.190589,46.18069,46.176812,46.174343,46.168704,46.164978,46.168747,46.168089,46.162821,46.158597,46.1582557524132,46.1582100767413,46.1579121278649,46.1575352432675,46.157342,46.1586398125733,46.158705,46.1594863981209,46.160529,46.162163,46.166607,46.168457353916,46.168498,46.170013,46.1700320231959,46.171051,46.171545,46.1760307507397,46.180379,46.1823480586939,46.183395,46.187674,46.189527,46.190757,46.188465,46.1910179139907,46.19268,46.192211,46.1905845016097,46.190293,46.1952595302013,46.196283,46.1975788702633,46.19854,46.2040782109177,46.204454,46.206263,46.211033,46.213001,46.2078971118656,46.206099,46.203961,46.201257,46.195077,46.188989,46.189812,46.1899422023193,46.1962510864866,46.198203,46.212401,46.215474,46.218228,46.216296,46.214652,46.213172,46.213172,46.2141565865164,46.21531,46.217612,46.224749,46.226328,46.230525,46.243426,46.249018,46.259109,46.26061,46.263404,46.266153,46.271004,46.269131,46.267831,46.264531,46.2616183143491,46.249832,46.2381989727856,46.229348,46.2232991346567,46.181571,46.1759919270221,46.154428,46.150998,46.146372,46.1463246103232,46.135489,46.127255,46.125069,46.120724,46.111274,46.099071,46.08312,46.069546,46.058442,46.039528,46.039372,46.011211,45.953538,45.953402,45.879307,45.874827,45.866592,45.836657,45.808172,45.786853,45.779579,45.780021,45.775657,45.775055,45.775411,45.774548,45.77503,45.774656,45.77367,45.773735,45.77308,45.783218,45.783518,45.782754,45.783121,45.7830789476988,45.798472,45.802941,45.80642,45.837101,45.847203,45.856809,45.8589678554596,45.863891,45.869974,45.881946,45.8835462531041,45.884782,45.8883409650687,45.892344,45.8933296722535,45.9077737308722,45.907807,45.9091893558919,45.910211,45.915345,45.917156,45.918179,45.923825,45.928564,45.930863,45.931092,45.933217,45.935011,45.93575,45.938842,45.942494,45.946431,45.94906,45.951157,45.952828,45.956129,45.959261,45.961683,45.962858,45.966328,45.969139,45.974469,45.9747292171811,45.97561,45.97566,45.9772655771636,45.977306,45.978971753744,45.9809350830733,45.9896314000151,46.009564,46.010474,46.0114217704711,46.032939676254,46.041978,46.0467937578809,46.071672,46.0975516365884,46.0985512214542,46.116131,46.141675,46.1460979734688,46.1493573509761,46.1500035077577,46.168798,46.173895405281,46.1879867611841,46.20399,46.223514,46.230109,46.23685]}],[{"lng":[-124.035223,-124.032609,-124.031183,-124.025439,-124.025607,-124.02402,-124.021516,-124.020328,-124.016684,-124.013832,-124.008841,-124.008929,-124.011218,-124.018586,-124.025003,-124.028331,-124.036174,-124.035223],"lat":[46.285137,46.284973,46.28333,46.284567,46.290697,46.290834,46.286917,46.282975,46.279388,46.27331,46.26723,46.26557,46.265752,46.271995,46.274131,46.273967,46.281523,46.285137]}]],[[{"lng":[-121.805269,-121.804426,-121.80044,-121.798154,-121.793219,-121.788805,-121.784556,-121.781958,-121.781098,-121.781588,-121.781121,-121.778803,-121.779132,-121.779672,-121.78183,-121.781727,-121.779906,-121.778672,-121.770738,-121.766495,-121.755915,-121.752152,-121.751454,-121.749443,-121.744103,-121.740994,-121.737791,-121.735545,-121.730625,-121.725175,-121.720814,-121.717652,-121.716996,-121.718681,-121.718977,-121.722407,-121.722584,-121.715266,-121.714462,-121.710813,-121.707639,-121.699939,-121.698143,-121.697656,-121.696035,-121.693396,-121.691214,-121.688164,-121.683277,-121.680346,-121.672405,-121.660852,-121.65871,-121.66043,-121.660419,-121.660828,-121.659639,-121.656909,-121.653593,-121.652018,-121.651394,-121.652732,-121.653315,-121.652581,-121.652638,-121.653866,-121.657245,-121.660444,-121.661656,-121.662415,-121.662382,-121.662881,-121.664694,-121.665717,-121.667021,-121.677722,-121.682723,-121.685005,-121.687776,-121.69088,-121.693387,-121.695074,-121.696085,-121.699675,-121.69865,-121.700208,-121.702383,-121.706179,-121.70805,-121.708402,-121.710291,-121.71065,-121.710201,-121.710503,-121.711596,-121.712219,-121.715716,-121.718675,-121.723999,-121.725283,-121.727194,-121.728533,-121.729226,-121.730168,-121.731438,-121.732018,-121.733403,-121.736506,-121.738794,-121.740329,-121.743454,-121.746454,-121.747973,-121.748649,-121.749061,-121.748245,-121.74687,-121.741175,-121.738512,-121.736292,-121.73492,-121.73048,-121.727341,-121.719697,-121.715592,-121.714469,-121.712953,-121.711275,-121.710517,-121.709251,-121.705971,-121.703592,-121.69945,-121.698375,-121.697685,-121.691112,-121.689772,-121.685082,-121.682607,-121.684475,-121.686262,-121.685304,-121.684793,-121.681537,-121.682463,-121.680898,-121.689261,-121.691878,-121.696411,-121.696479,-121.635917,-121.614577,-121.481888,-121.480617,-121.480361,-121.480879,-121.480159,-121.481441,-121.481798,-121.481719,-121.482056,-121.481813,-121.481753,-121.482168,-121.440646,-121.440551,-121.441224595532,-121.423592,-121.401739,-121.383451776795,-121.372574,-121.365470443381,-121.351267011354,-121.33777,-121.312198,-121.294453886635,-121.287323,-121.251183,-121.215779,-121.204808148559,-121.200367,-121.196631142901,-121.195233,-121.196149220098,-121.196556,-121.183841,-121.170474994227,-121.167852,-121.145534,-121.140560367303,-121.139483,-121.131953,-121.129228277698,-121.123793795051,-121.123239617734,-121.1222,-121.120085996729,-121.117052,-121.120064,-121.084933,-121.071453407883,-121.06437,-121.033582,-121.007449,-120.983478,-120.977978,-120.953077,-120.943977,-120.915876,-120.915795173154,-120.914976,-120.914281,-120.912191,-120.909223,-120.907361,-120.904775,-120.903975,-120.904375,-120.906375,-120.911282,-120.911675,-120.909275,-120.906075,-120.901176,-120.898788,-120.896478,-120.895397,-120.895674,-120.896872,-120.903013,-120.904815,-120.905899,-120.905657,-120.906528,-120.908205,-120.909382,-120.908459,-120.903006,-120.899356,-120.898438,-120.896833,-120.890264,-120.884983,-120.884644,-120.884777,-120.884318,-120.882656,-120.877966,-120.874893,-120.869928,-120.865268,-120.864073,-120.854473,-120.853673,-120.841972,-120.838772,-120.833877,-120.827084,-120.825731,-120.82629,-120.828587,-120.834585,-120.836184,-120.837783,-120.838881,-120.838981,-120.83458,-120.833178,-120.833377,-120.838172,-120.839071,-120.839171,-120.837471,-120.837371,-120.835571,-120.836073,-120.837971,-120.845671,-120.847671,-120.856571,-120.859072,-120.860972,-120.861471,-120.861871,-120.862871,-120.865371,-120.865771,-120.865071,-120.863971,-120.859571,-120.856371,-120.851771,-120.84947,-120.84987,-120.852271,-120.854872,-120.85917,-120.86209,-120.86287,-120.86267,-120.86157,-120.86657,-120.86607,-120.868569,-120.868235,-120.866075,-120.865759,-120.866962,-120.868265,-120.872479,-120.877522,-120.879164,-120.881064,-120.883039,-120.883445,-120.889071,-120.89428,-120.898171,-120.899771,-120.899371,-120.901065,-120.904671,-120.909271,-120.914371,-120.918671,-120.920371,-120.920475,-120.919771,-120.920471,-120.921771,-120.923671,-120.930471,-120.934171,-120.938472,-120.939628,-120.939568,-120.935868,-120.933068,-120.932169,-120.93237,-120.93377,-120.935871,-120.938471,-120.940771,-120.946372,-120.949472,-120.953672,-120.955072,-120.955372,-120.953872,-120.946472,-120.945771,-120.946071,-120.947171,-120.954171,-120.955773,-120.956471,-120.959771,-120.963672,-120.966974,-120.969577,-120.97218,-120.973344,-120.974381,-120.97387,-120.972589,-120.973089,-120.979647,-120.982776,-120.985498,-120.986474,-120.988673,-120.990473,-120.992973,-120.997673,-121.000973,-121.005447,-121.007455,-121.01079,-121.01569,-121.017429,-121.018588,-121.018483,-121.019811,-121.022556,-121.024374,-121.026348,-121.031202,-121.03044,-121.028421,-121.020739,-121.017771,-121.017426,-121.021053,-121.024135,-121.024876,-121.023617,-121.019468,-121.018924,-121.020367,-121.022217,-121.024033,-121.022639,-121.023321,-121.022588,-121.022667,-121.0217,-121.023799,-121.023648,-121.025194,-121.025146,-121.022886,-121.022387,-121.020562,-121.024289,-121.022339,-121.020535,-121.019103,-121.02369,-121.023205,-121.020802,-121.021783,-121.023358,-121.024294,-121.024,-121.022616,-121.017866,-121.017603,-121.019213,-121.018916,-121.017818,-121.015251,-121.01339,-121.012758,-121.013426,-121.012104,-121.009205,-121.00779,-121.005607,-121.004846,-121.002122,-120.998011,-120.996341,-120.996115,-120.994305,-120.992661,-120.990604,-120.987691,-120.987364,-120.984454,-120.982904,-120.981623,-120.979915,-120.978751,-120.976906,-120.971202,-120.969286,-120.965499,-120.96269,-120.960641,-120.95377,-120.952936,-120.952541,-120.955009,-120.95345,-120.949477,-120.948817,-120.945892,-120.944643,-120.943269,-120.941741,-120.940399,-120.939568,-120.937582,-120.934796,-120.933105,-120.932135,-120.930986,-120.929924,-120.928255,-120.925671,-120.92356,-120.919952,-120.918168,-120.921218,-120.920404,-120.915516,-120.913498,-120.91103,-120.907903,-120.906598,-120.903867,-120.900336,-120.896262,-120.89586,-120.893665,-120.891826,-120.890777,-120.889357,-120.885464,-120.883252,-120.880732,-120.874104,-120.869892,-120.866917,-120.862649,-120.858274,-120.857412,-120.855029,-120.852133,-120.850241,-120.848278,-120.846485,-120.841194,-120.838408,-120.837282,-120.83473,-120.8339,-120.830944,-120.828702,-120.826779,-120.824421,-120.82114,-120.818038,-120.816572,-120.814098,-120.810337,-120.810019,-120.807057,-120.804459,-120.802598,-120.801544,-120.799513,-120.797512,-120.79614,-120.793721,-120.791689,-120.790705,-120.789015,-120.785207,-120.781447,-120.779175,-120.776469,-120.771887,-120.770957,-120.769803,-120.767269,-120.767914,-120.769379,-120.76907,-120.765987,-120.764167,-120.76099,-120.761838,-120.761281,-120.757615,-120.75508,-120.753057,-120.75116,-120.74927,-120.747881,-120.74657,-120.745747,-120.744025,-120.742358,-120.739885,-120.737715,-120.734189,-120.733197,-120.731003,-120.727515,-120.726786,-120.723166,-120.724375,-120.72332,-120.72414,-120.722779,-120.722032,-120.718645,-120.718381,-120.719022,-120.718099,-120.720072,-120.721768,-120.722581,-120.725299,-120.726605,-120.727736,-120.728455,-120.727052,-120.727391,-120.726329,-120.728574,-120.729487,-120.729292,-120.730182,-120.729792,-120.688617,-120.626232,-120.504419,-120.503733,-120.494548,-120.495748,-120.49516,-120.495548,-120.494048,-120.490647,-120.489647,-120.489347,-120.488547,-120.483347,-120.482647,-120.483647,-120.484947,-120.489047,-120.489747,-120.488046,-120.481046,-120.481346,-120.483446,-120.485646,-120.488946,-120.488946,-120.480945,-120.479545,-120.479645,-120.481745,-120.480864,-120.482573,-120.486545,-120.487646,-120.487246,-120.483767,-120.482877,-120.481248,-120.480046,-120.478688,-120.479487,-120.477168,-120.47751,-120.480902,-120.483766,-120.48367,-120.47929,-120.477712,-120.476773,-120.476778,-120.477292,-120.479707,-120.482025,-120.485982,-120.485821,-120.484919,-120.485083,-120.486572,-120.487029,-120.489133,-120.488231,-120.482655,-120.479385,-120.481685,-120.480293,-120.478641,-120.476528,-120.472884,-120.474898,-120.47708,-120.476621,-120.472776,-120.470495,-120.470127,-120.471271,-120.471074,-120.468709,-120.468899,-120.474136,-120.473566,-120.469777,-120.467323,-120.462494,-120.460798,-120.458259,-120.455771,-120.454775,-120.453485,-120.450991,-120.444521,-120.43946,-120.436328,-120.436139,-120.438784,-120.440553,-120.446918,-120.451259,-120.455737,-120.458764,-120.460126,-120.460353,-120.459592,-120.456202,-120.454706,-120.454163,-120.455204,-120.452471,-120.445746,-120.443361,-120.439561,-120.43628,-120.435567,-120.433469,-120.427549,-120.424464,-120.41846,-120.413864,-120.41258,-120.411979,-120.410794,-120.410061,-120.40829,-120.405558,-120.405045,-120.405023,-120.401587,-120.400495,-120.397282,-120.394199,-120.390315,-120.387086,-120.380249,-120.378686,-120.376617,-120.372173,-120.371441,-120.68959,-120.923309,-120.989505,-121.08948,-121.090568,-121.091897,-121.210841,-121.351973,-121.725068,-121.725068,-121.752994,-121.750261,-121.746671,-121.745258,-121.742441,-121.741864,-121.742406,-121.748587,-121.751069,-121.753182,-121.750034,-121.747874,-121.747741,-121.746221,-121.739922,-121.736936,-121.733528,-121.734223,-121.735253,-121.734396,-121.730737,-121.728208,-121.726138,-121.724519,-121.723013,-121.71822,-121.715592,-121.714854,-121.71456,-121.723005,-121.728994,-121.732821,-121.735372,-121.738297,-121.742614,-121.747297,-121.747324,-121.744585,-121.744453,-121.745436,-121.748452,-121.752417,-121.754124,-121.760379,-121.76256,-121.764083,-121.766527,-121.772236,-121.773775,-121.777156,-121.77977,-121.78285,-121.787028,-121.789703,-121.79511,-121.796127,-121.790661,-121.786735,-121.785612,-121.785593,-121.786147,-121.787787,-121.791112,-121.792162,-121.792475,-121.794783,-121.79603,-121.798502,-121.798684,-121.800131,-121.803345,-121.802626,-121.801623,-121.802935,-121.803471,-121.802547,-121.803163,-121.804406,-121.805667,-121.805269],"lat":[45.011496,45.012877,45.015183,45.01615,45.017471,45.016028,45.015132,45.015214,45.016312,45.018144,45.021486,45.026237,45.030126,45.031646,45.033698,45.034399,45.035136,45.037277,45.039837,45.03958,45.037218,45.036162,45.034836,45.034098,45.03385,45.034428,45.033616,45.034668,45.036182,45.036784,45.036915,45.037566,45.038037,45.039285,45.042325,45.044095,45.045432,45.051756,45.053214,45.055912,45.057054,45.05852,45.059579,45.061626,45.062866,45.06365,45.065692,45.067109,45.068012,45.068111,45.067683,45.066362,45.066355,45.069473,45.073623,45.075258,45.079635,45.082515,45.084943,45.086706,45.088803,45.097111,45.098582,45.099886,45.101992,45.102852,45.103177,45.104415,45.105425,45.107592,45.11335,45.114456,45.115172,45.11972,45.120519,45.12236,45.123572,45.12369,45.122474,45.11806,45.116934,45.117392,45.118883,45.12179,45.123789,45.127066,45.129102,45.131594,45.134055,45.137271,45.14039,45.143283,45.148733,45.150597,45.152824,45.153424,45.154039,45.156838,45.158354,45.159339,45.161556,45.164721,45.168594,45.170314,45.170633,45.170913,45.174913,45.176313,45.180374,45.182227,45.183795,45.18635,45.188995,45.1918,45.197559,45.2051,45.205997,45.206788,45.206156,45.206919,45.208963,45.211543,45.212044,45.211691,45.210941,45.21133,45.212368,45.215347,45.21847,45.21998,45.221466,45.2233,45.224054,45.226448,45.227391,45.229558,45.22965,45.228409,45.228988,45.230368,45.233301,45.235873,45.240067,45.243495,45.247204,45.250581,45.251348,45.254141,45.255359,45.25792,45.258059,45.257377,45.258128,45.272711,45.286679,45.294275,45.315542,45.34583,45.403625,45.435496,45.482753,45.490679,45.505055,45.519604,45.519394,45.53276,45.6973034385521,45.69399,45.692887,45.6992977172998,45.703111,45.7034861389801,45.7042362225356,45.704949,45.699925,45.6907187476547,45.687019,45.67839,45.671238,45.6559982544447,45.649829,45.6350456589765,45.629513,45.6206319670926,45.616689,45.606441,45.6061542691238,45.606098,45.607886,45.6112362771232,45.611962,45.609762,45.6115234451054,45.6150366628937,45.6153949206591,45.616067,45.6169088233693,45.618117,45.623134,45.647893,45.6509451315419,45.652549,45.650998,45.653217,45.648344,45.649345,45.656745,45.656445,45.641345,45.641301218792,45.636345,45.634693,45.632496,45.627939,45.626731,45.621645,45.617145,45.615745,45.613245,45.608839,45.605245,45.602445,45.600345,45.598387,45.596399,45.592333,45.589342,45.586685,45.585914,45.579033,45.576068,45.571842,45.568928,45.565662,45.564497,45.561148,45.558241,45.553406,45.549261,45.543979,45.54268,45.541614,45.539326,45.538782,45.531695,45.529435,45.527564,45.526771,45.526944,45.528391,45.528848,45.528746,45.523446,45.521846,45.517546,45.515946,45.515968,45.515307,45.514077,45.511466,45.509945,45.507742,45.506742,45.504841,45.502441,45.501841,45.497345,45.494646,45.493046,45.485645,45.483245,45.479546,45.475646,45.474546,45.471246,45.469146,45.467346,45.462746,45.461946,45.461546,45.459946,45.456246,45.454546,45.450346,45.448446,45.446046,45.445046,45.440546,45.439046,45.435846,45.434645,45.433645,45.431445,45.428545,45.427145,45.426945,45.428645,45.428414,45.427346,45.425346,45.422746,45.412746,45.409346,45.401146,45.397879,45.393451,45.391231,45.389224,45.38852,45.388216,45.391687,45.392414,45.392552,45.390457,45.387278,45.383145,45.378322,45.374445,45.370245,45.364245,45.361596,45.360745,45.362145,45.362645,45.361345,45.359344,45.356144,45.351645,45.349245,45.348045,45.347345,45.347745,45.347745,45.346845,45.345588,45.342046,45.340244,45.337843,45.336443,45.332443,45.331343,45.330844,45.331345,45.332645,45.336745,45.337645,45.337245,45.335645,45.334445,45.333445,45.331345,45.327145,45.325045,45.323445,45.316745,45.313445,45.310345,45.307945,45.306845,45.30694,45.307437,45.308635,45.309899,45.312945,45.316643,45.319027,45.320315,45.322652,45.321963,45.320256,45.318543,45.312644,45.309344,45.307444,45.306544,45.307644,45.309698,45.31006,45.309269,45.307148,45.30514,45.301504,45.297022,45.294684,45.291386,45.289725,45.288917,45.285857,45.28481,45.284328,45.28618,45.284738,45.281969,45.278573,45.27644,45.275176,45.271766,45.270476,45.268668,45.266282,45.264793,45.264107,45.261002,45.251226,45.249845,45.246643,45.245501,45.241928,45.241133,45.239548,45.23835,45.237762,45.236331,45.235346,45.232197,45.23038,45.229872,45.227813,45.225219,45.22377,45.222909,45.22145,45.220811,45.219531,45.218455,45.217972,45.217611,45.216733,45.215473,45.212678,45.212389,45.213307,45.212996,45.21213,45.210143,45.208977,45.211051,45.211071,45.209422,45.20822,45.20892,45.208369,45.206422,45.204881,45.203313,45.204362,45.204264,45.200376,45.198917,45.197788,45.20007,45.200164,45.198832,45.19887,45.200423,45.199855,45.200064,45.198167,45.198343,45.197026,45.196232,45.196589,45.199129,45.200533,45.201454,45.201916,45.200435,45.200171,45.200797,45.200084,45.198131,45.198147,45.199612,45.2006,45.200106,45.201543,45.203315,45.203523,45.200555,45.199781,45.20033,45.201783,45.20288,45.201804,45.198744,45.197811,45.198189,45.199505,45.199614,45.200337,45.203096,45.202794,45.203406,45.203031,45.202121,45.200704,45.201016,45.202158,45.202305,45.199802,45.200624,45.199481,45.198138,45.198991,45.196764,45.19465,45.195112,45.193862,45.193073,45.189711,45.190206,45.189509,45.1877,45.185869,45.184218,45.181246,45.180176,45.179206,45.178981,45.176743,45.175965,45.17698,45.175916,45.172811,45.172219,45.172641,45.170973,45.170074,45.167194,45.168318,45.167929,45.166442,45.165421,45.165388,45.164483,45.165086,45.164828,45.163302,45.163077,45.164184,45.162708,45.163256,45.162405,45.162694,45.162337,45.160367,45.158737,45.157141,45.156511,45.155435,45.153147,45.150189,45.149272,45.145745,45.144461,45.143845,45.144321,45.144024,45.142428,45.142267,45.140314,45.139557,45.137567,45.136322,45.136159,45.134805,45.1344,45.134533,45.135077,45.133054,45.132358,45.131673,45.130522,45.129578,45.127872,45.126089,45.124848,45.121757,45.119629,45.117583,45.114616,45.111056,45.106596,45.106348,45.105245,45.103616,45.100225,45.099715,45.097334,45.095639,45.093143,45.091092,45.089885,45.088765,45.086873,45.085907,45.083731,45.083695,45.083589,45.083477,45.083477,45.07465,45.07005,45.068279,45.06355,45.06295,45.06315,45.06095,45.05855,45.05785,45.05695,45.05635,45.05345,45.05195,45.04855,45.04715,45.04315,45.03895,45.03705,45.03415,45.03255,45.02915,45.02705,45.02115,45.01895,45.01525,45.01105,45.009024,45.007686,45.00615,45.002949,45.00165,45.000113,44.998224,44.992758,44.989763,44.988537,44.984596,44.981876,44.980374,44.978676,44.975432,44.972849,44.972941,44.972278,44.970088,44.967456,44.966344,44.965188,44.965194,44.962749,44.960692,44.959686,44.956472,44.955769,44.954047,44.951299,44.950682,44.949244,44.947337,44.945507,44.943142,44.942458,44.940262,44.935458,44.933343,44.932197,44.929493,44.927367,44.924502,44.922126,44.919343,44.916909,44.913847,44.913388,44.909661,44.908162,44.907436,44.907439,44.905528,44.903973,44.903736,44.905132,44.907264,44.908317,44.908663,44.904258,44.899629,44.894791,44.894064,44.888013,44.886701,44.884591,44.884215,44.88281,44.881199,44.878216,44.876113,44.874285,44.873867,44.872612,44.869667,44.865607,44.8644,44.863058,44.863812,44.863607,44.862316,44.860148,44.85675,44.853686,44.853468,44.853762,44.852907,44.852174,44.848417,44.845693,44.840381,44.839552,44.839274,44.838678,44.833779,44.830843,44.830109,44.829377,44.829201,44.829733,44.829257,44.826872,44.826877,44.825007,44.822846,44.821769,44.822491,44.822996,44.823135,44.823272,44.824093,44.825098,44.825067,44.8247,44.825519,44.829919,44.829919,44.832677,44.837387,44.841401,44.845514,44.847398,44.853292,44.855163,44.856706,44.86124,44.864573,44.869565,44.872298,44.875394,44.876673,44.879812,44.882059,44.88572,44.888473,44.88931,44.890799,44.891348,44.893142,44.895375,44.896167,44.89745,44.900018,44.90277,44.90613,44.906315,44.904814,44.906819,44.907761,44.910179,44.912122,44.914636,44.917166,44.91983,44.920925,44.923042,44.927539,44.93057,44.932036,44.938447,44.941233,44.941952,44.941721,44.93984,44.938213,44.936857,44.935153,44.935654,44.935457,44.934682,44.935668,44.937426,44.941371,44.945223,44.947412,44.950377,44.952248,44.95477,44.956569,44.95786,44.959666,44.964926,44.970487,44.973167,44.974963,44.976452,44.977103,44.981021,44.982743,44.987321,44.992173,44.995386,44.999614,45.002217,45.006124,45.011496]}]],[[{"lng":[-122.001944,-122.001623,-122.000095,-121.997755,-121.995526,-121.99214,-121.98666,-121.981146,-121.977014,-121.968364,-121.964918,-121.9657,-121.967951,-121.969516,-121.972147,-121.973742,-121.974541,-121.978135,-121.980509,-121.980619,-121.982442,-121.985633,-121.98691,-121.985717,-121.986267,-121.985716,-121.984519,-121.98475,-121.983119,-121.981099,-121.980832,-121.979319,-121.979573,-121.978224,-121.976117,-121.973488,-121.972889,-121.973084,-121.972422,-121.967826,-121.966917,-121.967179,-121.971795,-121.973498,-121.974607,-121.975179,-121.974629,-121.973125,-121.973588,-121.975842,-121.977,-121.978262,-121.977949,-121.975456,-121.973689,-121.975571,-121.975173,-121.978289,-121.979648,-121.981007,-121.981248,-121.975677,-121.974351,-121.974141,-121.970437,-121.971991,-121.970119,-121.968164,-121.967095,-121.963562,-121.961437,-121.965522,-121.969048,-121.969609,-121.968894,-121.96538,-121.962544,-121.960507,-121.964026,-121.966186,-121.96739,-121.967844,-121.967157,-121.967348,-121.968382,-121.966654,-121.964404,-121.964924,-121.964537,-121.963754,-121.967767,-121.97073,-121.974371,-121.97546,-121.975565,-121.974278,-121.974756,-121.973495,-121.973657,-121.975264,-121.976611,-121.977799,-121.976763,-121.976052,-121.975226,-121.974803,-121.975192,-121.9744,-121.974401,-121.976081,-121.976173,-121.974896,-121.97542,-121.975358,-121.975113,-121.972875,-121.972931,-121.968548,-121.965431,-121.962046,-121.961483,-121.959462,-121.9575,-121.956466,-121.95296,-121.95134,-121.951391,-121.952638,-121.952256,-121.947402,-121.94521,-121.943782,-121.94233,-121.937524,-121.932415,-121.931269,-121.931479,-121.93656,-121.939333,-121.936964,-121.934322,-121.931438,-121.929404,-121.928213,-121.923578,-121.920359,-121.916801,-121.916265,-121.913613,-121.911588,-121.907868,-121.905856,-121.904318,-121.901482,-121.899743,-121.898393,-121.893921,-121.892574,-121.891442,-121.888545,-121.884325,-121.876903,-121.871602,-121.869385,-121.868029,-121.86838,-121.866636,-121.865553,-121.865855,-121.869966,-121.868366,-121.86649,-121.864863,-121.865338,-121.861553,-121.862399,-121.861353,-121.861569,-121.860927,-121.858364,-121.858102,-121.859205,-121.858174,-121.858124,-121.859497,-121.859435,-121.858022,-121.85998,-121.859711,-121.857063,-121.853218,-121.851462,-121.848898,-121.84539,-121.841387,-121.836722,-121.841469,-121.84356,-121.84511,-121.845087,-121.843135,-121.837282,-121.835963,-121.83679,-121.835458,-121.832449,-121.828402,-121.830273,-121.831355,-121.833384,-121.829239,-121.829103,-121.827099,-121.825663,-121.824533,-121.824299,-121.822384,-121.822016,-121.823599,-121.825381,-121.825042,-121.825487,-121.827324,-121.828042,-121.82955,-121.832623,-121.832785,-121.835193,-121.834472,-121.832225,-121.830059,-121.825726,-121.821394,-121.820056,-121.817468,-121.815895,-121.814176,-121.81219,-121.805421,-121.802225,-121.801513,-121.799227,-121.796501,-121.793616,-121.790365,-121.789458,-121.789211,-121.787098,-121.784547,-121.779748,-121.779395,-121.777087,-121.776779,-121.773384,-121.772481,-121.771755,-121.772156,-121.771349,-121.769259,-121.769874,-121.769311,-121.770003,-121.769573,-121.768446,-121.76807,-121.769381,-121.771345,-121.770604,-121.771649,-121.771473,-121.773003,-121.772532,-121.773339,-121.772735,-121.779553,-121.782676,-121.78402,-121.783142,-121.78342,-121.781069,-121.781132,-121.782017,-121.77888,-121.776708,-121.772426,-121.772913,-121.771647,-121.773196,-121.777229,-121.778813,-121.779738,-121.777556,-121.776464,-121.77429,-121.773407,-121.774429,-121.774047,-121.774525,-121.777485,-121.7791,-121.781511,-121.78121,-121.782174,-121.781334,-121.780652,-121.782576,-121.78161,-121.78366,-121.785631,-121.785536,-121.783458,-121.785251,-121.78406,-121.779552,-121.777905,-121.778226,-121.780239,-121.783459,-121.785753,-121.785421,-121.786562,-121.78766,-121.787806,-121.789792,-121.790457,-121.78928,-121.789648,-121.793299,-121.794053,-121.797461,-121.799426,-121.800871,-121.80525,-121.807791,-121.812668,-121.814002,-121.819172,-121.818602,-121.820058,-121.820794,-121.822017,-121.824508,-121.825031,-121.824493,-121.824693,-121.825631,-121.829123,-121.832349,-121.837029,-121.841346,-121.840588,-121.841105,-121.840178,-121.839829,-121.838676,-121.838296,-121.838672,-121.83719,-121.838501,-121.840437,-121.840333,-121.838745,-121.838989,-121.840443,-121.840783,-121.839298,-121.838263,-121.83956,-121.838718,-121.838718,-121.837607,-121.838253,-121.840536,-121.841828,-121.843443,-121.8439,-121.84041,-121.839415,-121.837076,-121.836875,-121.83738,-121.839822,-121.842406,-121.843458,-121.845989,-121.844914,-121.843679,-121.841952,-121.843342,-121.844616,-121.845412,-121.843678,-121.846471,-121.845488,-121.843159,-121.843906,-121.843138,-121.776324,-121.776324,-121.674928,-121.673699,-121.636001,-121.596883,-121.59326,-121.533117,-121.473293,-121.405495,-121.291112,-121.242113,-121.2293,-121.229289,-121.199971,-121.189792,-121.149644,-121.130934,-121.107534,-121.108065,-121.108335,-121.108537,-121.102938,-121.102883,-121.102791,-121.102781,-121.102773,-121.09243,-121.028358,-120.987271,-120.987084,-120.986955,-120.986587,-120.918109,-120.748249,-120.747848,-120.37874,-120.378107,-120.298364,-120.258386,-120.257777,-120.237934,-119.897434,-119.896581,-120.225273,-120.37771,-120.377752,-120.871802,-120.87349,-120.974959,-120.974975,-121.332969,-121.39767,-121.398498,-121.464437,-121.547864,-121.600018,-121.642987,-122.002362,-122.001944],"lat":[43.616414,43.622528,43.626357,43.62704,43.626937,43.625893,43.625632,43.625894,43.625796,43.626385,43.627045,43.62779,43.627549,43.629837,43.631689,43.633715,43.635627,43.637181,43.639685,43.64254,43.644379,43.652527,43.653858,43.656292,43.661708,43.66425,43.665708,43.667019,43.670143,43.673038,43.676079,43.680825,43.683766,43.688021,43.690301,43.691409,43.692868,43.695848,43.69714,43.701406,43.702821,43.704254,43.705008,43.706227,43.708584,43.710661,43.714027,43.715821,43.7176,43.721911,43.722386,43.724446,43.725444,43.729102,43.730635,43.733585,43.735841,43.737692,43.739082,43.741516,43.742964,43.746965,43.748549,43.750364,43.750748,43.752983,43.756832,43.757767,43.759699,43.762525,43.763745,43.765176,43.76734,43.769542,43.774753,43.777706,43.77872,43.78124,43.782628,43.784709,43.78699,43.791207,43.793313,43.795743,43.800984,43.801924,43.803954,43.805798,43.808235,43.809736,43.812761,43.813036,43.811555,43.811768,43.812541,43.817418,43.821219,43.827147,43.829345,43.827875,43.827615,43.828526,43.830226,43.834914,43.83585,43.838518,43.83999,43.84128,43.843043,43.846044,43.848478,43.851243,43.851773,43.855444,43.85757,43.859351,43.861156,43.864554,43.865763,43.865003,43.866226,43.868195,43.868549,43.870083,43.871681,43.873938,43.875554,43.876552,43.878063,43.881049,43.882058,43.884603,43.886262,43.890663,43.894213,43.897504,43.898992,43.900588,43.900866,43.903343,43.904908,43.905543,43.907347,43.909181,43.908566,43.911171,43.911488,43.912347,43.912917,43.912326,43.913876,43.913363,43.914863,43.9159,43.914537,43.912269,43.910784,43.9109,43.908658,43.90867,43.907985,43.907841,43.911681,43.911859,43.914504,43.915837,43.917106,43.919789,43.920959,43.923286,43.923898,43.925795,43.930281,43.932315,43.935837,43.937103,43.939036,43.941197,43.943048,43.944787,43.945593,43.947384,43.948783,43.951404,43.952781,43.953806,43.954542,43.958507,43.961526,43.965248,43.966596,43.966335,43.967269,43.967175,43.969574,43.971232,43.972587,43.973445,43.975021,43.976239,43.979073,43.982647,43.984745,43.985983,43.987284,43.987296,43.988727,43.989247,43.990573,43.991094,43.994496,43.995395,43.99759,44.002135,44.004224,44.008066,44.010777,44.012359,44.016406,44.019426,44.021567,44.023129,44.024752,44.029158,44.03106,44.033319,44.035576,44.037024,44.039744,44.041599,44.041365,44.044147,44.047911,44.050905,44.051832,44.051201,44.052956,44.053164,44.052251,44.052691,44.05684,44.060089,44.061662,44.067131,44.071873,44.072607,44.075019,44.076541,44.077214,44.080121,44.082353,44.085138,44.088537,44.089686,44.091034,44.094858,44.095897,44.099603,44.10134,44.10395,44.106409,44.108132,44.110428,44.11205,44.115245,44.118178,44.123916,44.125254,44.12676,44.131314,44.133307,44.134981,44.137039,44.139831,44.145276,44.14625,44.148462,44.151746,44.154322,44.155202,44.158315,44.159765,44.160744,44.159933,44.16353,44.164798,44.167583,44.169488,44.171595,44.173127,44.17565,44.178687,44.181082,44.183762,44.185623,44.187627,44.190156,44.190792,44.192042,44.194255,44.194809,44.196545,44.198499,44.199392,44.201958,44.203014,44.205326,44.20542,44.207811,44.208394,44.209599,44.212595,44.215751,44.216985,44.218877,44.221483,44.224606,44.225653,44.229239,44.230903,44.233215,44.234981,44.240762,44.243505,44.245463,44.247071,44.249326,44.25152,44.252707,44.254613,44.25828,44.25955,44.259495,44.260147,44.260656,44.260241,44.26195,44.263933,44.267804,44.26845,44.271389,44.273641,44.274814,44.280192,44.282624,44.283437,44.28498,44.285323,44.286844,44.285652,44.287955,44.289461,44.291095,44.293641,44.29663,44.299044,44.300168,44.303011,44.307229,44.308217,44.310141,44.312483,44.31418,44.318174,44.320984,44.322279,44.325139,44.327522,44.329789,44.331492,44.334022,44.336549,44.33971,44.340291,44.342144,44.346432,44.351721,44.35436,44.355981,44.357319,44.358276,44.359568,44.361769,44.365129,44.366867,44.370509,44.372037,44.372889,44.37563,44.376556,44.380153,44.383067,44.385609,44.387299,44.389094,44.390962,44.39263,44.392829,44.393402,44.393387,44.393383,44.392413,44.392578,44.392612,44.393184,44.393464,44.393153,44.392893,44.392954,44.393036,44.390646,44.390631,44.390621,44.390647,44.390635,44.3906,44.32718,44.26204,44.218519,44.218487,44.20241,44.17139,44.169238,44.138125,44.137751,44.135452,44.134026,44.076292,44.047637,43.960852,43.959365,43.95731,43.871331,43.872362,43.785429,43.785545,43.785297,43.698762,43.697376,43.6982,43.611164,43.611656,43.611489,43.615946,43.615538,43.615535,43.615384,43.617437,43.616645,43.616295,43.616218,43.616607,43.616497,43.616443,43.616648,43.615498,43.616414]}]],[[{"lng":[-123.485441,-123.463883,-123.461962,-123.461849,-123.461575,-123.461181,-123.441119,-123.440737,-123.442721,-123.421968,-123.421935,-123.402146,-123.40205,-123.361147,-123.361194,-123.361131,-123.319997,-123.320211,-123.299258,-123.299438,-123.340332,-123.340499,-123.360373,-123.376916,-123.380663,-123.380216,-123.400895,-123.423273,-123.423002,-123.443849,-123.443752,-123.464087,-123.464329,-123.464357,-123.485124,-123.484725,-123.484726,-123.361028,-123.36141,-123.361046,-123.361657,-123.361225,-123.361622,-123.34041,-123.215543,-123.195899,-123.122083,-123.115179,-123.051181,-123.050674,-123.030873,-123.0317,-123.031837,-123.011137,-122.990344,-122.990368,-122.928901,-122.929146,-122.929122,-122.929145,-122.928956,-122.929193,-122.929128,-122.918725,-122.909078,-122.908992,-122.887837,-122.887963,-122.868303,-122.867495,-122.867592,-122.866745,-122.846849,-122.846905,-122.846978,-122.826342,-122.826222,-122.826005,-122.805481,-122.805432,-122.804585,-122.803132,-122.796057,-122.795914,-122.792699,-122.795111,-122.784771,-122.78477,-122.784769,-122.784768,-122.784864,-122.784232,-122.783624,-122.78234,-122.779838,-122.774659,-122.77215,-122.76609,-122.765076,-122.764412,-122.764436,-122.764439,-122.764458,-122.764459,-122.764472,-122.764486,-122.764464,-122.743862,-122.743859,-122.743859,-122.743856,-122.743847,-122.743828,-122.743815,-122.743813,-122.743805,-122.743803,-122.743785,-122.743809,-122.743799,-122.743798,-122.743758,-122.743746,-122.743745,-122.743711,-122.743681,-122.743671,-122.743626,-122.743654,-122.743663,-122.743672,-122.743667,-122.743659,-122.743649,-122.743668,-122.743673,-122.743691,-122.743703,-122.743718,-122.743721,-122.743991,-122.744006,-122.74406,-122.744029,-122.743974,-122.743963,-122.743956,-122.743942,-122.743941,-122.743848,-122.743939,-122.743942,-122.743926,-122.743921,-122.743919,-122.743915,-122.743922,-122.743933,-122.743923,-122.743923,-122.743856,-122.743798,-122.743811,-122.743868,-122.743741,-122.746817,-122.75407,-122.764942,-122.769123,-122.784896,-122.786266,-122.787507,-122.80547,-122.805556,-122.807188,-122.82066,-122.825967,-122.842499,-122.843407,-122.846494,-122.846485,-122.846503,-122.851912,-122.857175,-122.867891,-122.904945,-122.908867,-122.908861,-122.908796,-122.92113,-122.928873,-122.939204,-122.962566,-122.970229,-122.97024,-122.970294,-122.970523,-122.970332,-122.9703,-122.976592,-122.979806,-122.991396,-122.99139,-122.991393,-122.991388,-123.011653,-123.011645,-123.01129,-123.014476,-123.027879,-123.032294,-123.032161,-123.05267,-123.062894,-123.063593,-123.072998,-123.083758,-123.103125,-123.112032,-123.114641,-123.114696,-123.134658,-123.135231,-123.135427,-123.137607,-123.138987,-123.142683,-123.151954,-123.156018,-123.176888,-123.180951,-123.196977,-123.209265,-123.46488,-123.48608,-123.485441],"lat":[45.447136,45.44726,45.462109,45.466555,45.47729,45.49156,45.491273,45.50533,45.521115,45.521408,45.535376,45.535646,45.550068,45.549902,45.558462,45.578779,45.578684,45.592984,45.593017,45.607247,45.607455,45.622201,45.622502,45.622077,45.621985,45.635752,45.636083,45.636176,45.65062,45.650678,45.665126,45.66514,45.669573,45.679274,45.67925,45.694472,45.708764,45.708696,45.737128,45.743418,45.757741,45.76493,45.779579,45.779849,45.77994,45.779909,45.780154,45.780131,45.779371,45.779362,45.779159,45.765779,45.75142,45.751458,45.750835,45.736459,45.735688,45.721482,45.698697,45.69381,45.67835,45.671015,45.635313,45.635399,45.635228,45.620763,45.620466,45.606352,45.606223,45.606226,45.591878,45.591881,45.591836,45.581018,45.577516,45.577521,45.568063,45.563041,45.562911,45.555687,45.556182,45.555689,45.555695,45.552082,45.54935,45.548433,45.5484,45.545158,45.543979,45.54232,45.533994,45.533982,45.533971,45.533946,45.533897,45.533809,45.533815,45.533852,45.533858,45.533822,45.531344,45.531184,45.529727,45.529634,45.528166,45.526737,45.519562,45.519509,45.516665,45.515754,45.5144,45.512509,45.509582,45.508181,45.507886,45.507374,45.506834,45.505017,45.497618,45.494665,45.494401,45.488258,45.48725,45.487084,45.484201,45.477961,45.476442,45.476439,45.469466,45.467532,45.465576,45.458486,45.456685,45.454892,45.447693,45.447284,45.444663,45.442944,45.435079,45.433294,45.426072,45.421046,45.418855,45.415311,45.407918,45.406149,45.404972,45.402702,45.402592,45.396544,45.393033,45.391704,45.387483,45.386845,45.386122,45.381513,45.377431,45.375538,45.372181,45.371751,45.359577,45.355871,45.353992,45.346587,45.332067,45.332045,45.331994,45.331928,45.331909,45.331825,45.33182,45.33182,45.331772,45.34566,45.346276,45.346233,45.346249,45.346133,45.346154,45.34595,45.328151,45.317192,45.317228,45.317273,45.317345,45.317457,45.317476,45.338071,45.346185,45.346241,45.34628,45.346332,45.346415,45.346454,45.346919,45.348862,45.353193,45.353774,45.36077,45.360932,45.361013,45.361096,45.364991,45.368009,45.375468,45.376348,45.382183,45.390905,45.390993,45.390902,45.390891,45.404962,45.404727,45.404898,45.404896,45.405082,45.404517,45.404421,45.404393,45.404383,45.418957,45.418937,45.424348,45.433459,45.433468,45.433473,45.433489,45.433528,45.433541,45.433584,45.433599,45.433667,45.433707,45.433332,45.433199,45.447136]}]],[[{"lng":[-123.785332,-123.784207,-123.784134,-123.784497,-123.78454,-123.761994,-123.741719,-123.65482,-123.644356,-123.613925,-123.606416,-123.507617,-123.483026,-123.463518,-123.463051,-123.463132,-123.463101,-123.462321,-123.463692,-123.464112,-123.465734,-123.46488,-123.209265,-123.196977,-123.180951,-123.176888,-123.156018,-123.151954,-123.142683,-123.138987,-123.137607,-123.135427,-123.135231,-123.134658,-123.114696,-123.114641,-123.112032,-123.103125,-123.083758,-123.072998,-123.063593,-123.062894,-123.05267,-123.032161,-123.032294,-123.027879,-123.014476,-123.01129,-123.011645,-123.011653,-122.991388,-122.991393,-122.99139,-122.991396,-122.979806,-122.976592,-122.9703,-122.970332,-122.970523,-122.970294,-122.97024,-122.970229,-122.962566,-122.939204,-122.928873,-122.92113,-122.908796,-122.908861,-122.908867,-122.904945,-122.867891,-122.868073,-122.849925,-122.854691,-122.858823,-122.86352,-122.867179,-122.872906,-122.879136,-122.881015,-122.882494,-122.886812,-122.889006,-122.893198,-122.898048,-122.899528,-122.904219,-122.908708,-122.912621,-122.916561,-122.919112,-122.922836,-122.92513,-122.928984,-122.932081,-122.943419,-122.947317,-122.949691,-122.952144,-122.954429,-122.957273,-122.958818,-122.959922,-122.961195,-122.9623,-122.964021,-122.967579,-122.971659,-122.974699,-122.974911,-122.974957,-122.974937,-122.975052,-122.977037,-122.981086,-122.98831,-122.99097,-122.996046,-122.999265,-122.999811,-123.000788,-123.001497,-123.001527,-122.998984,-122.998455,-122.997702,-122.996469,-122.996087,-122.995576,-122.995366,-122.996221,-122.997737,-122.999659,-123.003867,-123.007632,-123.02609,-123.035667,-123.038475,-123.04117,-123.044146,-123.046867,-123.049012,-123.051106,-123.050918,-123.049662,-123.047009,-123.045896,-123.043892,-123.041321,-123.036649,-123.028675,-123.024949,-123.022219,-123.020521,-123.018777,-123.019124,-123.018862,-123.01624,-123.015382,-123.014505,-123.011189,-123.007746,-123.001883,-123.000726,-123.003569,-123.007346,-123.011513,-123.01801,-123.023019,-123.02705,-123.028875,-123.031407,-123.033173,-123.033292,-123.032467,-123.032027,-123.031676,-123.031177,-123.028136,-123.025303,-123.022368,-123.020187,-123.015037,-123.012235,-123.009878,-123.007494,-123.001054,-122.998002,-122.996444,-122.999042,-123.002309,-123.005564,-123.008255,-123.009998,-123.014574,-123.018118,-123.027643,-123.033439,-123.036121,-123.041478,-123.044916,-123.046115,-123.051936,-123.059397,-123.062251,-123.067619,-123.068627,-123.068271,-123.068667,-123.092128,-123.186276,-123.209454,-123.249322,-123.321413,-123.339945,-123.396679,-123.412698,-123.448934,-123.468746,-123.477905,-123.478264,-123.49442,-123.495414,-123.50222,-123.550602,-123.551215,-123.561352,-123.568496,-123.57142,-123.576563,-123.599208,-123.601657,-123.622159,-123.627081,-123.657202,-123.724368,-123.724362,-123.784016,-123.784135,-123.784487,-123.784259,-123.784192,-123.784157,-123.785567,-123.785332],"lat":[45.166922,45.173379,45.202101,45.202095,45.216294,45.216283,45.216266,45.216607,45.2171,45.217103,45.216555,45.216264,45.216134,45.216312,45.259918,45.274549,45.280192,45.338244,45.367548,45.374535,45.417388,45.433332,45.433707,45.433667,45.433599,45.433584,45.433541,45.433528,45.433489,45.433473,45.433468,45.433459,45.424348,45.418937,45.418957,45.404383,45.404393,45.404421,45.404517,45.405082,45.404896,45.404898,45.404727,45.404962,45.390891,45.390902,45.390993,45.390905,45.382183,45.376348,45.375468,45.368009,45.364991,45.361096,45.361013,45.360932,45.36077,45.353774,45.353193,45.348862,45.346919,45.346454,45.346415,45.346332,45.34628,45.346241,45.346185,45.338071,45.317476,45.317457,45.317345,45.259695,45.259697,45.257252,45.254719,45.253084,45.252972,45.253827,45.254425,45.254827,45.255211,45.256531,45.257491,45.257798,45.256622,45.256719,45.259435,45.262835,45.266203,45.267445,45.268065,45.268509,45.268635,45.268621,45.268499,45.267586,45.267485,45.26826,45.270488,45.273639,45.278695,45.280509,45.281837,45.282982,45.28388,45.284894,45.285083,45.283041,45.279979,45.279143,45.278081,45.276928,45.276226,45.273321,45.271011,45.268761,45.267714,45.264811,45.261554,45.26085,45.259347,45.257284,45.254877,45.242731,45.241311,45.239953,45.238752,45.238305,45.237426,45.233981,45.230698,45.226947,45.223696,45.22217,45.222137,45.223224,45.222789,45.222272,45.220788,45.21828,45.216583,45.214705,45.211305,45.209391,45.207266,45.204744,45.201105,45.199481,45.198918,45.199434,45.201943,45.202051,45.201121,45.199841,45.19584,45.191003,45.189247,45.181566,45.177017,45.175796,45.173053,45.170955,45.167365,45.16452,45.161321,45.159498,45.160252,45.162765,45.162905,45.161894,45.160852,45.15794,45.153831,45.150825,45.146614,45.145564,45.144999,45.144303,45.141313,45.140185,45.139431,45.138747,45.136757,45.133769,45.129273,45.127319,45.123249,45.120604,45.117631,45.114694,45.11311,45.111091,45.107235,45.105444,45.101967,45.100961,45.100555,45.098953,45.097729,45.094073,45.090273,45.089197,45.086332,45.083942,45.082673,45.078925,45.076586,45.074864,45.07486,45.074932,45.075013,45.074982,45.075073,45.075527,45.075495,45.075389,45.075365,45.075293,45.0752,45.075176,45.075175,45.075138,45.07513,45.075115,45.075553,45.075568,45.075733,45.075848,45.075899,45.075976,45.076016,45.07602,45.076056,45.076067,45.076118,45.076226,45.076777,45.076657,45.087581,45.08866,45.104049,45.130885,45.144694,45.159712,45.166922]}]],[[{"lng":[-117.977663335055,-117.717852,-117.62359560026,-117.60342451872,-117.603163,-117.504833,-117.480103,-117.479935132756,-117.47536,-117.475148,-117.439943,-117.390738,-117.382131203034,-117.353928,-117.337668,-117.280513327856,-117.216731,-117.214534,-117.212616,-117.090186778506,-117.070047,-117.051304,-116.985882,-116.940681,-116.915989,-116.911409,-116.900497,-116.892861,-116.894652,-116.89091,-116.886843,-116.880506,-116.87598,-116.874869,-116.875706,-116.873933,-116.870484,-116.869655,-116.866544,-116.859795,-116.857254,-116.84355,-116.830003,-116.819182,-116.814142,-116.796555004061,-116.796051,-116.794454975327,-116.790151,-116.787792,-116.78752,-116.788923,-116.789066,-116.788329,-116.782676,-116.7634,-116.759787,-116.755288,-116.750978,-116.745219,-116.740486,-116.736268,-116.715527,-116.711822,-116.70845,-116.698079,-116.697192,-116.687007,-116.680139,-116.665344,-116.659629,-116.646342,-116.639641,-116.635814,-116.632032,-116.60504,-116.593004,-116.577422,-116.559444,-116.553548,-116.549085,-116.546643,-116.543862684798,-116.537173,-116.535698,-116.538014,-116.536395,-116.535396,-116.528272,-116.523961,-116.512326,-116.49451,-116.487894,-116.487274,-116.487835,-116.487447,-116.484219,-116.483286,-116.482495,-116.48282653917,-116.482899,-116.482806,-116.481018,-116.475803,-116.472346,-116.471241,-116.472882,-116.469813,-116.46517,-116.463504,-116.463635,-116.471646,-116.474702,-116.476521,-116.480788,-116.483105,-116.483412,-116.481208,-116.481943,-116.48297,-116.490279,-116.502756,-116.503728,-116.503156,-116.503957,-116.506967,-116.510342,-116.513931,-116.517468,-116.522233,-116.525888,-116.527723,-116.528558,-116.52828,-116.526201,-116.523947,-116.523638,-116.527492979455,-116.535482,-116.543837,-116.548676,-116.5525,-116.554634,-116.556587,-116.557587,-116.556575,-116.554549,-116.553473,-116.553171,-116.558804,-116.558803,-116.55498,-116.554829,-116.561744,-116.563985,-116.575949,-116.581382,-116.588195,-116.592416,-116.597447,-116.619057,-116.626633,-116.653252,-116.673793,-116.674648,-116.672594,-116.672163,-116.672733,-116.674493,-116.675587,-116.681013,-116.687027,-116.687174152113,-116.695619,-116.698661,-116.703181,-116.704217,-116.708003,-116.70975,-116.708546,-116.709536,-116.724205,-116.724192007616,-116.724188,-116.725137,-116.727452,-116.728757,-116.729607,-116.731216,-116.734021,-116.742962,-116.745535,-116.746607,-116.748564,-116.752839,-116.754643,-116.774847,-116.782492,-116.783537,-116.784244,-116.783771926572,-117.022673,-117.022673,-117.091719,-117.266005,-117.266006,-117.266006,-117.320193,-117.373361,-117.476684,-117.476762,-117.496311,-117.501432,-117.520941,-117.520674,-117.522313,-117.522249,-117.542216,-117.542058,-117.561969,-117.562208,-117.582166,-117.582674,-117.582344,-117.622801,-117.622777,-117.643494,-117.643485,-117.663391,-117.664146,-117.68379,-117.683951,-117.683794,-117.683986,-117.727235,-117.727225,-117.730633,-117.745959,-117.746137,-117.767063,-117.766865,-117.787623,-117.788395,-117.74765,-117.747464,-117.747405,-117.747327,-117.97298,-117.977639,-117.977663335055],"lat":[46.0007234754428,45.999866,45.999061415294,45.9988892323573,45.998887,45.998317,45.99787,45.9978694691105,45.997855,45.997893,45.998633,45.998598,45.9980721459827,45.996349,45.998662,45.9985173847898,45.998356,45.99832,45.998321,45.9976245645994,45.99751,45.996849,45.996974,45.996274,45.995413,45.988912,45.982801,45.976373,45.969686,45.96001,45.958617,45.958508,45.95441,45.950253,45.945008,45.939894,45.932408,45.923799,45.916958,45.907264,45.904159,45.892273,45.886405,45.880938,45.877551,45.8590045012698,45.858473,45.8561406398762,45.849851,45.844267,45.840204,45.836741,45.833471,45.831928,45.825376,45.81658,45.816167,45.817061,45.818537,45.821394,45.82446,45.826179,45.826773,45.826267,45.825117,45.820852,45.820135,45.806319,45.79359,45.781998,45.780016,45.779815,45.781274,45.783642,45.784979,45.781018,45.778541,45.76753,45.755189,45.753388,45.752735,45.750972,45.7469544885719,45.737288,45.734231,45.714929,45.69665,45.691734,45.681473,45.677639,45.670224,45.655679,45.649769,45.647675,45.644302,45.643682,45.642322,45.641529,45.639916,45.6367721223766,45.636085,45.633595,45.632152,45.6317,45.629409,45.627669,45.624884,45.620604,45.617986,45.615785,45.602785,45.593647,45.59179,45.589673,45.587942,45.58516,45.582615,45.580597,45.577898,45.577008,45.574499,45.566608,45.565102,45.562754,45.560953,45.558427,45.556809,45.556281,45.55679,45.555626,45.553734,45.551818,45.551078,45.54989,45.549482,45.548234,45.54661,45.539602100419,45.525079,45.514193,45.510385,45.508311,45.507856,45.506232,45.503217,45.501388,45.500154,45.499107,45.495932,45.481188,45.480076,45.472801,45.46293,45.461213,45.460169,45.452522,45.448984,45.44292,45.427356,45.41277,45.39821,45.388037,45.351084,45.321511,45.314342,45.298023,45.288938,45.283183,45.276349,45.274867,45.27072,45.267857,45.2676428484611,45.255353,45.245552,45.2408,45.227972,45.222317,45.217243,45.207356,45.203015,45.171501,45.164945960344,45.162924,45.159072,45.156023,45.144381,45.142091,45.139934,45.138289,45.134898,45.133038,45.124878,45.122945,45.121768,45.113972,45.105536,45.09579,45.093605,45.088128,45.078265731912,45.079167,45.079734,45.080158,45.08057,45.152442,45.166539,45.166537,45.16654,45.166539,45.209973,45.209977,45.210148,45.209768,45.223598,45.253458,45.267731,45.267424,45.295956,45.295879,45.310219,45.310184,45.324359,45.338096,45.338171,45.336789,45.33687,45.365322,45.365749,45.428344,45.428365,45.441917,45.506771,45.51523,45.51478,45.61699,45.61692,45.616635,45.660736,45.660227,45.689605,45.689567,45.773515,45.773625,45.833238,45.850523,45.861072,45.860595,45.860602,46.0007234754428]}]],[[{"lng":[-120.005565,-120.005124,-120.004752,-120.004859,-120.004783,-119.999242,-119.998172,-119.998161,-119.999501176112,-119.965744,-119.908917240841,-119.907461,-119.876144,-119.868272037091,-119.868135,-119.802655,-119.772927,-119.729909361077,-119.672199870904,-119.669877,-119.623393,-119.600549,-119.571584,-119.536946521092,-119.524632,-119.487829,-119.456238441501,-119.450256,-119.432149953782,-119.432128,-119.432181,-119.432054,-119.434665,-119.434772,-119.435024,-119.434695,-119.434788,-119.434603,-119.434622,-119.43455,-119.434644,-119.434606,-119.43464,-119.248547,-119.248444,-119.248214,-119.145144,-119.14561,-119.148243,-119.147264,-119.146789,-119.146424,-119.163037,-119.162966,-119.306043,-119.306611,-119.544565,-119.552894,-119.593374,-119.603647,-119.667065,-119.672228,-119.770244,-119.781719,-119.791162,-119.790961,-119.790699,-119.790831,-119.760731,-119.759759,-119.883914,-119.882356,-119.882346,-119.897751,-120.006555,-120.005565],"lat":[45.350553,45.385771,45.501959,45.502468,45.517157,45.517539,45.68439,45.687968,45.8124817188485,45.824365,45.8280408039571,45.828135,45.834718,45.8359407146783,45.835962,45.84753,45.845578,45.8502905291199,45.8566125323665,45.856867,45.905639,45.919581,45.925456,45.913024662526,45.908605,45.906307,45.9155950765374,45.917354,45.918250445405,45.90729,45.879312,45.865421,45.864893,45.828536,45.826207,45.805961,45.802167,45.756429,45.746143,45.704977,45.704411,45.621409,45.602985,45.601935,45.573187,45.516076,45.515909,45.428579,45.255939,45.255936,45.171034,45.08294,45.082943,44.996241,44.995696,44.995993,44.995689,44.995311,44.99531,44.994539,44.994664,44.995117,44.995193,44.994816,44.994755,45.023517,45.067823,45.081253,45.081278,45.169211,45.169152,45.25596,45.256916,45.257017,45.257706,45.350553]}]],[[{"lng":[-121.3513,-121.349315,-121.349247,-121.348471,-121.332413,-121.332609,-121.332969,-120.974975,-120.974959,-120.87349,-120.871802,-120.377752,-120.37771,-120.225273,-119.896581,-119.895163,-119.895056,-119.896465,-119.896969,-119.932611,-119.931944,-119.931595,-119.943504,-119.943441,-119.943779,-119.706005,-119.705858,-119.365337,-119.365156,-119.363896,-119.363648,-119.363579,-119.359446,-119.360121480893,-119.360177,-119.444598,-119.72573,-119.790087,-119.848907,-119.872929,-119.876054,-119.986801,-119.999234,-120.046745935305,-120.088176,-120.159409852771,-120.160711,-120.188026,-120.272095999129,-120.276920753459,-120.284045,-120.325751,-120.326387,-120.328538964699,-120.328540043301,-120.413985011427,-120.489013,-120.508434445763,-120.564863,-120.61589,-120.680984,-120.786166,-120.819216277206,-120.878231,-120.879925977229,-120.879805,-120.880501,-120.880436,-120.882106,-120.882106,-120.883327,-120.899236,-120.996696,-120.996685,-121.131887,-121.349679,-121.350007,-121.35053,-121.35055,-121.3513],"lat":[42.919989,43.089928,43.111683,43.356753,43.356663,43.473058,43.616645,43.617437,43.615384,43.615535,43.615538,43.615946,43.611489,43.611656,43.611164,43.592745,43.568127,43.353816,43.179017,43.178963,42.976439,42.917005,42.917079,42.753671,42.746371,42.746605,42.748791,42.748958,42.661822,42.487079,42.220094,42.137231,42.13723,41.9943837248054,41.994384,41.995478,41.996296,41.997544,41.997281,41.997641,41.997199,41.995709,41.994944,41.9948937861312,41.99485,41.994566063361,41.9945608770155,41.994452,41.9929801905817,41.9928957238404,41.992771,41.993143,41.992586,41.9925995898795,41.992599596691,41.9931391904968,41.993613,41.9935136523275,41.993225,41.993029,41.99357,41.993809,41.9937957174251,41.993772,41.9937643415584,41.996882,42.428587,42.483263,42.483262,42.486559,42.744214,42.743806,42.743688,42.746349,42.746775,42.746644,42.833905,42.91669,42.919989,42.919989]}]],[[{"lng":[-124.015851,-124.012163,-124.006057,-124.004863,-123.996836,-123.989529,-123.987671142877,-123.97734943563,-123.976188590439,-123.975425,-123.972855462376,-123.970461,-123.968660474861,-123.968232789041,-123.968187,-123.968560618402,-123.972529,-123.976507,-123.971328,-123.970173135164,-123.964276,-123.958061,-123.962607,-123.963217724763,-123.964127353106,-123.964169,-123.964380552095,-123.968982320543,-123.972899,-123.978671,-124.007756,-124.007494,-123.979715,-123.978955013993,-123.973398,-123.965728,-123.960557,-123.961131916315,-123.962035,-123.962528536153,-123.964074,-123.974665,-123.974302867085,-123.971997014932,-123.971892,-123.970804752809,-123.970154,-123.970139671867,-123.970121,-123.973381,-123.97409492245,-123.976647761464,-123.97865,-123.978534795427,-123.976544,-123.970794,-123.96634,-123.962095,-123.957568,-123.94944,-123.949468,-123.951155,-123.951567332492,-123.95319628028,-123.956711,-123.952264,-123.949998649289,-123.949787395219,-123.947632127365,-123.944234559771,-123.942805782962,-123.941981614177,-123.941433103909,-123.939964,-123.937358469373,-123.937272,-123.940394,-123.939653,-123.940874071402,-123.941568,-123.942219645651,-123.942937192789,-123.943121,-123.943567208808,-123.946027,-123.952045022158,-123.954899774688,-123.957689,-123.962908,-123.967425,-123.967841,-123.964335,-123.965567651763,-123.970272,-123.978679,-123.981732,-123.983029,-123.979597,-123.978804,-123.974456,-123.973555,-123.969302,-123.969078621366,-123.957356,-123.86475,-123.84338,-123.71984,-123.720001,-123.703567,-123.682896,-123.662297,-123.653642,-123.644355,-123.56717,-123.54582,-123.485086,-123.48513,-123.361622,-123.361225,-123.361657,-123.361046,-123.36141,-123.361028,-123.484726,-123.484725,-123.485124,-123.464357,-123.464329,-123.464087,-123.443752,-123.443849,-123.423002,-123.423273,-123.400895,-123.380216,-123.380663,-123.376916,-123.360373,-123.340499,-123.340332,-123.299438,-123.299258,-123.320211,-123.319997,-123.361131,-123.361194,-123.361147,-123.40205,-123.402146,-123.421935,-123.421968,-123.442721,-123.440737,-123.441119,-123.461181,-123.461575,-123.461849,-123.461962,-123.463883,-123.485441,-123.48608,-123.46488,-123.465734,-123.464112,-123.463692,-123.462321,-123.463101,-123.463132,-123.463051,-123.463518,-123.483026,-123.507617,-123.606416,-123.613925,-123.644356,-123.65482,-123.741719,-123.761994,-123.78454,-123.784497,-123.784134,-123.784207,-123.785332,-123.785567,-123.784157,-123.784192,-123.784259,-123.784487,-123.784135,-123.784016,-123.724362,-123.724368,-123.724663,-123.784759,-123.801472,-123.895988,-123.911026,-123.955007,-123.967184,-123.967191,-123.986688,-124.008880714497,-124.009069,-124.00977,-124.015011,-124.017991,-124.015851],"lat":[45.064759,45.076921,45.084736,45.084232,45.090167,45.094045,45.1008197766356,45.1384584412288,45.1426915261005,45.145476,45.159582575209,45.172728,45.1952852386477,45.2006433482882,45.201217,45.2025015176212,45.216145,45.21933,45.226849,45.2341520625869,45.271444,45.278013,45.281073,45.2951302262423,45.3160674015395,45.317026,45.3175073597732,45.3279780961366,45.33689,45.338854,45.336813,45.33974,45.347724,45.3485742170505,45.354791,45.386242,45.430778,45.4356126650042,45.443207,45.4446362942545,45.449112,45.467333,45.4678668620106,45.4712661853439,45.471421,45.4724857265356,45.473123,45.476818355795,45.481634,45.482538,45.4831227958426,45.4852139048169,45.486854,45.4870114900121,45.489733,45.493507,45.493417,45.497175,45.510399,45.545389,45.564829,45.565544,45.5659713979159,45.5676598626949,45.571303,45.586296,45.5986233755376,45.5997729583602,45.6115012952122,45.6299898636449,45.6377648488614,45.6422497341726,45.6452345665112,45.653229,45.6562826586659,45.656384,45.662926,45.688975,45.7035959750661,45.711905,45.7182519363268,45.7252407438024,45.727031,45.7279857578689,45.733249,45.737627056936,45.7397038636989,45.741733,45.74362,45.751041,45.755753,45.758296,45.7595095505395,45.764141,45.762156,45.76251,45.768044,45.768968,45.772913,45.774836,45.777508,45.779837,45.7830789476988,45.783121,45.782754,45.783518,45.783218,45.77308,45.773735,45.77367,45.774656,45.77503,45.774548,45.775411,45.775055,45.775657,45.780021,45.779579,45.76493,45.757741,45.743418,45.737128,45.708696,45.708764,45.694472,45.67925,45.679274,45.669573,45.66514,45.665126,45.650678,45.65062,45.636176,45.636083,45.635752,45.621985,45.622077,45.622502,45.622201,45.607455,45.607247,45.593017,45.592984,45.578684,45.578779,45.558462,45.549902,45.550068,45.535646,45.535376,45.521408,45.521115,45.50533,45.491273,45.49156,45.47729,45.466555,45.462109,45.44726,45.447136,45.433199,45.433332,45.417388,45.374535,45.367548,45.338244,45.280192,45.274549,45.259918,45.216312,45.216134,45.216264,45.216555,45.217103,45.2171,45.216607,45.216266,45.216283,45.216294,45.202095,45.202101,45.173379,45.166922,45.159712,45.144694,45.130885,45.104049,45.08866,45.087581,45.076657,45.076777,45.076226,45.044432,45.04473,45.044913,45.045552,45.045679,45.04572,45.045727,45.044843,45.044634,45.0449987048377,45.045114,45.047266,45.047969,45.049808,45.064759]}]],[[{"lng":[-121.919685,-121.911695,-121.908793,-121.901879,-121.902678,-121.903291,-121.902915,-121.906325,-121.907176,-121.908329,-121.907326,-121.910309,-121.912619,-121.913911,-121.913019,-121.911443,-121.910516,-121.910547,-121.91549,-121.918386,-121.918095,-121.915803,-121.915913,-121.914551,-121.915527,-121.915184,-121.913115,-121.915478,-121.916509,-121.918698,-121.922051,-121.922028852172,-121.908267,-121.904448014441,-121.900858,-121.900897392331,-121.901855,-121.877908566384,-121.875695401271,-121.867167,-121.858205244407,-121.838112759325,-121.811304,-121.735104,-121.711711588727,-121.707358,-121.675958711965,-121.668362,-121.638119011462,-121.631167,-121.609320387848,-121.562727136099,-121.534252432855,-121.533106,-121.531983021128,-121.523685853632,-121.522392,-121.511087960406,-121.499153,-121.494687797672,-121.494686798243,-121.483672986716,-121.481489451388,-121.467065281238,-121.462849,-121.441224595532,-121.440551,-121.440646,-121.482168,-121.481753,-121.481813,-121.482056,-121.481719,-121.481798,-121.481441,-121.480159,-121.480879,-121.480361,-121.480617,-121.481888,-121.614577,-121.635917,-121.696479,-121.695032,-121.692134,-121.690732,-121.690481,-121.689008,-121.687532,-121.685033,-121.68505,-121.684562,-121.681973,-121.68,-121.679888,-121.680813,-121.679232,-121.679081,-121.68159,-121.683547,-121.685262,-121.687945,-121.687276,-121.688772,-121.689975,-121.691752,-121.693809,-121.697615,-121.698691,-121.700932,-121.702476,-121.70326,-121.702846,-121.703592,-121.704567,-121.704223,-121.70326,-121.703546,-121.701957,-121.70123,-121.702141,-121.700918,-121.700709,-121.699231,-121.700209,-121.69756,-121.696925,-121.698113,-121.699988,-121.700473,-121.704123,-121.705532,-121.708575,-121.714579,-121.716979,-121.720904,-121.723201,-121.72419,-121.726508,-121.730946,-121.732298,-121.735074,-121.738405,-121.744622,-121.756938,-121.762165,-121.766144,-121.773181,-121.776204,-121.780122,-121.783928,-121.785633,-121.790802,-121.792696,-121.793651,-121.794539,-121.796434,-121.799679,-121.802589,-121.80456,-121.806916,-121.806939,-121.807908,-121.805791,-121.80559,-121.807583,-121.807559,-121.805977,-121.806845,-121.810726,-121.814319,-121.815501,-121.819587,-121.821485,-121.824922,-121.828898,-121.831765,-121.83527,-121.836809,-121.842521,-121.844301,-121.846764,-121.846821,-121.847872,-121.850403,-121.854653,-121.85882,-121.860323,-121.86337,-121.861111,-121.860137,-121.859828,-121.860873,-121.864656,-121.866919,-121.868187,-121.869342,-121.870166,-121.874665,-121.878538,-121.881862,-121.885605,-121.888674,-121.891749,-121.89392,-121.895902,-121.902817,-121.906688,-121.906924,-121.909746,-121.911443,-121.911614,-121.913087,-121.913761,-121.913216,-121.91644,-121.922136,-121.919685],"lat":[45.547614,45.548941,45.549992,45.55619,45.55686,45.559517,45.561121,45.561935,45.56255,45.564983,45.566723,45.566826,45.568211,45.571163,45.575168,45.576484,45.579733,45.581241,45.582447,45.585484,45.587287,45.589685,45.591609,45.593684,45.597109,45.598698,45.601297,45.605163,45.607635,45.608288,45.610761,45.6491618990508,45.654399,45.6583215914573,45.662009,45.662353021086,45.670716,45.6862907085108,45.6877301463022,45.693277,45.6954401547252,45.7002900029046,45.706761,45.694039,45.6946881803028,45.694809,45.7030807428963,45.705082,45.7047364355389,45.704657,45.7095324475309,45.7199305336331,45.7262851537756,45.726541,45.7263456264124,45.7249021020319,45.724677,45.7228135043382,45.720846,45.7184501847691,45.718449648523,45.7125401610082,45.7113685797871,45.7036292560113,45.701367,45.6973034385521,45.53276,45.519394,45.519604,45.505055,45.490679,45.482753,45.435496,45.403625,45.34583,45.315542,45.294275,45.286679,45.272711,45.258128,45.257377,45.258059,45.25792,45.263859,45.268412,45.271641,45.275625,45.276153,45.279234,45.281798,45.283681,45.286259,45.287942,45.290025,45.292672,45.294816,45.295895,45.297177,45.299775,45.300714,45.30306,45.30503,45.306251,45.309477,45.316379,45.319453,45.321348,45.322947,45.323929,45.327889,45.329188,45.331267,45.334258,45.338957,45.339223,45.344448,45.346629,45.349016,45.35187,45.356172,45.363389,45.364545,45.366277,45.368338,45.369899,45.371963,45.373564,45.373838,45.376309,45.378531,45.381733,45.383545,45.383619,45.386754,45.387131,45.3894,45.39177,45.393648,45.393784,45.394798,45.395593,45.395664,45.397131,45.397261,45.401105,45.402844,45.403433,45.402457,45.402672,45.407275,45.4101,45.412164,45.415202,45.415174,45.418572,45.424228,45.427171,45.427854,45.431927,45.432929,45.435494,45.440485,45.442561,45.443096,45.444307,45.448983,45.450143,45.451832,45.454649,45.455518,45.457968,45.459678,45.461675,45.46333,45.465469,45.467466,45.470184,45.472492,45.474619,45.476109,45.476188,45.47907,45.481329,45.483377,45.486502,45.486638,45.489006,45.489377,45.492844,45.495096,45.496923,45.499168,45.501814,45.504495,45.506786,45.508715,45.514103,45.514598,45.515751,45.514295,45.513125,45.512408,45.512252,45.512631,45.513388,45.514896,45.51853,45.520828,45.524655,45.526749,45.529082,45.530303,45.532567,45.535329,45.537275,45.543205,45.546673,45.547614]}]],[[{"lng":[-119.434772,-119.434665,-119.432054,-119.432181,-119.432128,-119.432149953782,-119.364396,-119.356927874882,-119.322509,-119.312779611952,-119.265781460289,-119.25715,-119.225745,-119.204349373269,-119.19553,-119.169496,-119.141390171444,-119.12612,-119.093221,-119.061462,-119.027056,-119.008558,-118.987196090377,-118.987129,-118.977787096598,-118.941242,-118.86812798659,-118.788694725992,-118.785765634062,-118.725242193351,-118.67787,-118.658717,-118.639332,-118.637725,-118.606789334728,-118.590497392025,-118.579906,-118.57571,-118.569392,-118.554902302619,-118.537119,-118.497027,-118.470756,-118.424027212824,-118.415326658626,-118.403817114887,-118.387301768013,-118.387293095034,-118.37836,-118.36779,-118.36716827519,-118.340494051998,-118.314982,-118.283526,-118.256368,-118.25253,-118.23666752911,-118.236584,-118.228941,-118.146028,-118.131019,-118.126197,-117.99694971271,-117.996911,-117.977663335055,-117.977639,-117.97298,-117.972948,-118.045003,-118.045102,-118.054666,-118.066506,-118.066465,-118.066513,-118.066383,-118.117194,-118.117121,-118.116844,-118.11836,-118.116309,-118.116355,-118.116362,-118.116461,-118.117464,-118.197955,-118.197876,-118.241668,-118.241665,-118.267614,-118.366326,-118.366522,-118.384117,-118.38422,-118.392817,-118.404849,-118.404806,-118.428539,-118.428539,-118.428329,-118.469471,-118.506172,-118.506296,-118.536194,-118.572271,-118.577354,-118.613107,-118.613254,-118.613243,-118.633925,-118.656266,-118.656251,-118.697766,-118.697013,-118.696986,-118.656102,-118.655992,-118.546632,-118.547652,-118.518687,-118.519022,-118.518689,-118.675353,-118.946612,-119.002263,-119.162966,-119.163037,-119.146424,-119.146789,-119.147264,-119.148243,-119.14561,-119.145144,-119.248214,-119.248444,-119.248547,-119.43464,-119.434606,-119.434644,-119.43455,-119.434622,-119.434603,-119.434788,-119.434695,-119.435024,-119.434772],"lat":[45.828536,45.864893,45.865421,45.879312,45.90729,45.918250445405,45.921605,45.9236692670188,45.933183,45.9341867678607,45.9390355038675,45.939926,45.932725,45.9292871126004,45.92787,45.927603,45.9310086675325,45.932859,45.942745,45.958527,45.969134,45.97927,45.9997905520367,45.999855,46.0000013775916,46.000574,46.0006742162676,46.0007830942314,46.0007871090932,46.0008700676541,46.000935,46.000955,46.000994,46.00097,46.0008886734271,46.0008458436429,46.000818,46.000718,46.000773,46.0008030811739,46.00084,46.00062,46.000632,46.0006026668075,46.0005972051842,46.0005899802661,46.0005796130411,46.0005796075968,46.000574,46.000622,46.0006200103111,46.0005346455232,46.000453,46.000787,46.000439,46.000459,46.0004182147682,46.000418,46.000421,46.000701,46.00028,46.000282,46.0007868487855,46.000787,46.0007234754428,45.860602,45.860595,45.816896,45.817073,45.773538,45.773563,45.77346,45.769522,45.737574,45.688395,45.688607,45.673797,45.600729,45.514664,45.514652,45.498842,45.49282,45.470732,45.470702,45.4704,45.427204,45.427391,45.428841,45.429103,45.428951,45.43531,45.435246,45.44258,45.442554,45.44255,45.429013,45.429076,45.428951,45.35519,45.355164,45.354867,45.354632,45.354518,45.354767,45.354773,45.354951,45.345788,45.339884,45.340006,45.340337,45.345146,45.345647,45.259928,45.257715,45.257729,45.196928,45.196898,45.080753,45.08069,45.010173,44.995877,44.997662,44.997439,44.996558,44.996241,45.082943,45.08294,45.171034,45.255936,45.255939,45.428579,45.515909,45.516076,45.573187,45.601935,45.602985,45.621409,45.704411,45.704977,45.746143,45.756429,45.802167,45.805961,45.826207,45.828536]}]],[[{"lng":[-124.1152,-124.110793224148,-124.10907,-124.109042455264,-124.108102657969,-124.108088,-124.109556,-124.109059,-124.106518,-124.104537939304,-124.100587,-124.098696003703,-124.092633,-124.09257772478,-124.092463110466,-124.086872,-124.084686,-124.084403674725,-124.0837,-124.083714,-124.083554722423,-124.083475419185,-124.08331,-124.084429,-124.083601,-124.077996,-124.077599366608,-124.076387,-124.075399,-124.071469543556,-124.070986189155,-124.070659499243,-124.069662181446,-124.067223499261,-124.06635,-124.066510728242,-124.066565382567,-124.067251,-124.06914,-124.068732391746,-124.068382456744,-124.068251,-124.066393894948,-124.06635,-124.067045,-124.065008,-124.063293560589,-124.062121498473,-124.058312330843,-124.058281,-124.060043,-124.063498,-124.066467,-124.07409,-124.078026,-124.079249,-124.072012,-124.068445,-124.065315427968,-124.063406,-124.059857,-124.057901,-124.058181453278,-124.058539,-124.06017,-124.064816,-124.064279,-124.06429,-124.068112,-124.066325,-124.069158,-124.075473,-124.074586244664,-124.073235024702,-124.073012,-124.073077,-124.074049344185,-124.074066,-124.067760724008,-124.067437,-124.063735,-124.063592299854,-124.063589011661,-124.063498,-124.063770144253,-124.067883,-124.067772,-124.067730713109,-124.067712670147,-124.06756,-124.067345158107,-124.066622,-124.061048,-124.059095250869,-124.054151,-124.053756784081,-124.048814,-124.045903377286,-124.037694989725,-124.032296,-124.025447618374,-124.025427720548,-124.025136,-124.025416882061,-124.025678,-124.024993086351,-124.024981927707,-124.024189142756,-124.023943285941,-124.023834,-124.02050369952,-124.017168554748,-124.017091597529,-124.016595443995,-124.016305243106,-124.015243,-124.014452951513,-124.013141309957,-124.012547595484,-124.012053555073,-124.011979123524,-124.0105900194,-124.009462791521,-124.009179,-124.010183,-124.012184,-124.011662,-124.00627,-124.005504,-124.008880714497,-123.986688,-123.967191,-123.967184,-123.955007,-123.911026,-123.895988,-123.801472,-123.784759,-123.724663,-123.725337,-123.725396,-123.725771,-123.724599,-123.724659,-123.724782,-123.724231,-123.724858,-123.724842,-123.725394,-123.725188,-123.725079,-123.725001,-123.716062,-123.704578,-123.704467,-123.602609,-123.603143,-123.602794,-123.602817,-123.596929,-123.596919,-123.596674,-123.596134,-123.597233,-123.59763,-123.597677,-123.608115,-123.648669,-123.66875,-123.679097,-123.68952,-123.699976,-123.720071,-123.720065,-123.72014,-123.715866,-123.715675,-123.715538,-123.735153,-123.734996,-123.816709,-123.816525,-123.775789,-123.775598,-123.798955,-123.941075,-123.941072,-124.063259,-124.063303,-124.083717,-124.114043752426,-124.113261,-124.113139093471,-124.111747,-124.1152],"lat":[44.286486,44.2988659489304,44.303707,44.3038814406453,44.3098331711722,44.309926,44.314545,44.318391,44.321848,44.3252125340905,44.331926,44.3411180393286,44.37059,44.3709219295689,44.371610192405,44.405185,44.420221,44.423136738616,44.430404,44.440011,44.4549692934339,44.4624169275216,44.477952,44.486927,44.501123,44.521985,44.5242600339205,44.531214,44.531606,44.5596389307304,44.5630872042146,44.5654178257118,44.5725327387105,44.589930414375,44.596162,44.59828090129,44.599001416354,44.60804,44.612979,44.615277011887,44.6172498737895,44.617991,44.6221223504817,44.62222,44.627851,44.632504,44.6392226043931,44.6438157219045,44.658743219609,44.658866,44.669361,44.672442,44.673061,44.673183,44.67565,44.6772,44.677917,44.683094,44.6955669500131,44.703177,44.716027,44.735163,44.7377481813923,44.741044,44.745076,44.746081,44.748465,44.753678,44.760618,44.762671,44.767806,44.771403,44.778483350406,44.7892722460794,44.791053,44.794318,44.7980431891997,44.798107,44.8043190617745,44.804638,44.80531,44.8094729907543,44.8095689172014,44.812224,44.8123385053927,44.814069,44.817815,44.8191507867329,44.8197345446305,44.824674,44.8260228314602,44.830563,44.834438,44.8355124791867,44.838233,44.839102683012,44.850007,44.8589587771585,44.8842041158734,44.900809,44.9269839736841,44.9270600245102,44.928175,44.9325110520331,44.936542,44.9414756811252,44.9415560608816,44.9472667780803,44.9490377737797,44.949825,44.9626480717717,44.9754897961224,44.9757861141132,44.977696516016,44.9788139127335,44.982904,44.9873098492237,44.9946244571541,44.9979354140053,45.0006905203016,45.0011056013856,45.0088521934298,45.0151383849173,45.016721,45.023823,45.026111,45.033485,45.038214,45.042931,45.0449987048377,45.044634,45.044843,45.045727,45.04572,45.045679,45.045552,45.044913,45.04473,45.044432,45.025068,45.023601,45.000746,45.00076,44.984273,44.962958,44.955493,44.94753,44.911745,44.88599,44.764328,44.753939,44.739046,44.739018,44.73898,44.721154,44.721154,44.709242,44.702125,44.651159,44.651139,44.545624,44.541804,44.477454,44.477454,44.46932,44.433109,44.433671,44.43342,44.432935,44.433928,44.433582,44.433788,44.433374,44.432329,44.389506,44.389495,44.379969,44.360458,44.36035,44.345778,44.344622,44.315303,44.316167,44.283547,44.283304,44.282951,44.277375,44.277178,44.275094,44.276117,44.2769899702691,44.277953,44.2783783845383,44.283236,44.286486]}]],[[{"lng":[-123.366516,-123.365968,-123.365373,-123.365677,-123.365152,-123.364652,-123.364329,-123.364023,-123.36375,-123.363743140809,-123.360561,-123.346252,-123.340655,-123.332335,-123.302588994244,-123.301034,-123.280166,-123.251233,-123.242026,-123.230813,-123.22243,-123.213054,-123.166414,-123.119730298412,-123.115904,-123.105021,-123.072955001104,-123.051064,-123.041297,-123.03382,-123.022885224802,-123.022147,-123.009436,-123.004233,-122.966694913215,-122.962681,-122.939676274918,-122.937415175285,-122.930461538264,-122.904119,-122.902954826569,-122.885933339972,-122.884478,-122.88307501286,-122.881327583221,-122.878092,-122.87766154657,-122.864284541462,-122.856158,-122.850300357308,-122.845875047125,-122.838578021636,-122.837638,-122.833420843631,-122.813998,-122.812215297032,-122.811841461838,-122.806193,-122.811204257205,-122.81151,-122.81006272961,-122.808350897773,-122.799082951662,-122.798091,-122.796820712691,-122.794675088814,-122.785026,-122.785121333263,-122.785299579417,-122.785515,-122.785696,-122.795963,-122.79572928967,-122.795605,-122.778983853061,-122.77064606136,-122.769532,-122.761451,-122.760974137953,-122.760108,-122.762189526428,-122.762437,-122.784663,-122.784735,-122.863423,-122.87539,-122.885463,-122.929146,-122.928901,-122.990368,-122.990344,-123.011137,-123.031837,-123.0317,-123.030873,-123.050674,-123.051181,-123.115179,-123.122083,-123.195899,-123.215543,-123.34041,-123.361622,-123.361003,-123.360794,-123.358826,-123.360627,-123.360365,-123.360427,-123.360564,-123.360303,-123.359489,-123.359614,-123.367438,-123.366516],"lat":[46.058442,46.069546,46.08312,46.099071,46.111274,46.120724,46.125069,46.127255,46.135489,46.1463246103232,46.146305,46.145065,46.146183,46.146132,46.1447065181102,46.144632,46.144843,46.156452,46.160968,46.164287,46.167682,46.172541,46.188973,46.1855486659199,46.185268,46.177676,46.1633673272527,46.153599,46.146351,46.144336,46.1394405031111,46.13911,46.136043,46.133823,46.1076189726297,46.104817,46.0965350318481,46.0957210097251,46.0932176196546,46.083734,46.0823438200884,46.0620178719878,46.06028,46.0539089971682,46.0459738715663,46.031281,46.0309510655119,46.0206978417551,46.014469,46.0038262451976,45.9957858962594,45.9825279259201,45.98082,45.9772814418892,45.960984,45.9544589188486,45.9530906006144,45.932416,45.9138572891451,45.912725,45.9096628567015,45.9060409527215,45.8864317772246,45.884333,45.8827157050054,45.8799839554795,45.867699,45.8643529779321,45.8580968659956,45.850536,45.844216,45.825024,45.815216,45.81,45.7912471031523,45.7818399456152,45.780583,45.759163,45.7503749615244,45.734413,45.7285767375573,45.728665,45.72865,45.720946,45.721416,45.721418,45.721378,45.721482,45.735688,45.736459,45.750835,45.751458,45.75142,45.765779,45.779159,45.779362,45.779371,45.780131,45.780154,45.779909,45.77994,45.779849,45.779579,45.786853,45.808172,45.836657,45.866592,45.874827,45.879307,45.953402,45.953538,46.011211,46.039372,46.039528,46.058442]}]],[[{"lng":[-120.49516,-120.309328,-120.131926,-120.128661,-120.086479,-120.028785,-120.005372,-120.000045,-119.91054,-119.910536,-119.876525,-119.850941,-119.790699,-119.790961,-119.791162,-119.781719,-119.770244,-119.672228,-119.671532,-119.652431,-119.653184,-119.653347,-119.653476,-119.653538,-119.653885,-119.653673,-119.653832,-119.653696,-119.655108,-119.655248,-119.655517,-119.899002,-119.899283,-119.960375,-119.970532,-120.000617,-120.010547,-120.020708,-120.021621,-120.101166,-120.143544,-120.36646,-120.386074,-120.385775,-120.387186,-120.386561,-120.385768,-120.386378,-120.385687,-120.387642,-120.388118,-120.387452,-120.387782,-120.389667,-120.393046,-120.398603,-120.399248,-120.397984,-120.394825,-120.394254,-120.394668,-120.39737,-120.400743,-120.404685,-120.404676,-120.401654,-120.399226,-120.398292,-120.395872,-120.394109,-120.393173,-120.390987,-120.385062,-120.385877,-120.381376,-120.379794,-120.379005,-120.380814,-120.384813,-120.385489,-120.386498,-120.386035,-120.38353,-120.377797,-120.377062,-120.380711,-120.379053,-120.372635,-120.371441,-120.372173,-120.376617,-120.378686,-120.380249,-120.387086,-120.390315,-120.394199,-120.397282,-120.400495,-120.401587,-120.405023,-120.405045,-120.405558,-120.40829,-120.410061,-120.410794,-120.411979,-120.41258,-120.413864,-120.41846,-120.424464,-120.427549,-120.433469,-120.435567,-120.43628,-120.439561,-120.443361,-120.445746,-120.452471,-120.455204,-120.454163,-120.454706,-120.456202,-120.459592,-120.460353,-120.460126,-120.458764,-120.455737,-120.451259,-120.446918,-120.440553,-120.438784,-120.436139,-120.436328,-120.43946,-120.444521,-120.450991,-120.453485,-120.454775,-120.455771,-120.458259,-120.460798,-120.462494,-120.467323,-120.469777,-120.473566,-120.474136,-120.468899,-120.468709,-120.471074,-120.471271,-120.470127,-120.470495,-120.472776,-120.476621,-120.47708,-120.474898,-120.472884,-120.476528,-120.478641,-120.480293,-120.481685,-120.479385,-120.482655,-120.488231,-120.489133,-120.487029,-120.486572,-120.485083,-120.484919,-120.485821,-120.485982,-120.482025,-120.479707,-120.477292,-120.476778,-120.476773,-120.477712,-120.47929,-120.48367,-120.483766,-120.480902,-120.47751,-120.477168,-120.479487,-120.478688,-120.480046,-120.481248,-120.482877,-120.483767,-120.487246,-120.487646,-120.486545,-120.482573,-120.480864,-120.481745,-120.479645,-120.479545,-120.480945,-120.488946,-120.488946,-120.485646,-120.483446,-120.481346,-120.481046,-120.488046,-120.489747,-120.489047,-120.484947,-120.483647,-120.482647,-120.483347,-120.488547,-120.489347,-120.489647,-120.490647,-120.494048,-120.495548,-120.49516],"lat":[45.068279,45.06779,45.067354,45.065453,45.065398,45.065224,45.065582,45.065591,45.066927,45.067928,45.067866,45.067783,45.067823,45.023517,44.994755,44.994816,44.995193,44.995117,44.823343,44.823299,44.762701,44.652252,44.652251,44.621785,44.534131,44.461288,44.454961,44.38917,44.389206,44.34547,44.307045,44.30662,44.389575,44.389457,44.388968,44.389104,44.389727,44.389687,44.438793,44.43821,44.437751,44.437015,44.436083,44.476624,44.476624,44.564009,44.578606,44.653068,44.761175,44.761979,44.763229,44.767886,44.769866,44.771638,44.773307,44.776973,44.778767,44.78073,44.782665,44.784272,44.786038,44.788414,44.789951,44.792695,44.794719,44.797861,44.799835,44.802357,44.803969,44.802712,44.797013,44.795784,44.796406,44.798474,44.800721,44.80298,44.806314,44.807352,44.807041,44.809674,44.809966,44.810985,44.8119,44.812034,44.814826,44.817938,44.819357,44.82037,44.821769,44.822846,44.825007,44.826877,44.826872,44.829257,44.829733,44.829201,44.829377,44.830109,44.830843,44.833779,44.838678,44.839274,44.839552,44.840381,44.845693,44.848417,44.852174,44.852907,44.853762,44.853468,44.853686,44.85675,44.860148,44.862316,44.863607,44.863812,44.863058,44.8644,44.865607,44.869667,44.872612,44.873867,44.874285,44.876113,44.878216,44.881199,44.88281,44.884215,44.884591,44.886701,44.888013,44.894064,44.894791,44.899629,44.904258,44.908663,44.908317,44.907264,44.905132,44.903736,44.903973,44.905528,44.907439,44.907436,44.908162,44.909661,44.913388,44.913847,44.916909,44.919343,44.922126,44.924502,44.927367,44.929493,44.932197,44.933343,44.935458,44.940262,44.942458,44.943142,44.945507,44.947337,44.949244,44.950682,44.951299,44.954047,44.955769,44.956472,44.959686,44.960692,44.962749,44.965194,44.965188,44.966344,44.967456,44.970088,44.972278,44.972941,44.972849,44.975432,44.978676,44.980374,44.981876,44.984596,44.988537,44.989763,44.992758,44.998224,45.000113,45.00165,45.002949,45.00615,45.007686,45.009024,45.01105,45.01525,45.01895,45.02115,45.02705,45.02915,45.03255,45.03415,45.03705,45.03895,45.04315,45.04715,45.04855,45.05195,45.05345,45.05635,45.05695,45.05785,45.05855,45.06095,45.06315,45.06295,45.06355,45.068279]}]],[[{"lng":[-123.231001,-123.230969,-123.230951,-123.231093,-123.229167,-123.229851,-123.2299,-123.229901,-123.229761,-123.229402,-123.229284,-123.229271,-123.229545,-123.229676,-123.229526,-123.229581,-123.229619,-123.229635,-123.210392,-123.209912,-123.200424,-123.200419,-123.190504,-123.190456,-123.180551,-123.180512,-123.152023,-123.152233,-123.112652,-123.112688,-123.009765,-123.009744,-122.990728,-122.990035,-122.970492,-122.970829,-122.95119,-122.951199,-122.9451,-122.93175,-122.9178,-122.911925,-122.868692,-122.852943,-122.853707,-122.833971,-122.814413,-122.794776,-122.794811,-122.785493,-122.784914,-122.775044,-122.775223,-122.756079,-122.756033,-122.736367,-122.736329,-122.716699,-122.716657,-122.69701,-122.697017,-122.677198,-122.677181,-122.637695,-122.637812,-122.621665,-122.600251,-122.600202,-122.580094,-122.580049,-122.560299,-122.560273,-122.520741,-122.520525,-122.460224,-122.46021,-122.440505,-122.440535,-122.420863,-122.420844,-122.401077,-122.401041,-122.401025,-122.40031,-122.385922,-122.28273,-122.282708,-122.283792,-122.283778,-122.283449,-122.284689,-122.287818,-122.287686,-122.28769,-122.287177,-122.287458,-122.28747,-122.289972,-122.289748006076,-122.320293,-122.368051522242,-122.378511,-122.403459336051,-122.416638,-122.493322,-122.548911,-122.61541287471,-122.634696,-122.672521,-122.713058,-122.75363522358,-122.813845,-122.867298,-122.870830789468,-122.875515469317,-122.884017334375,-122.889935,-122.893590970866,-122.961670756599,-122.963801,-122.988318483577,-123.043997,-123.062882,-123.080938,-123.102698940572,-123.125165,-123.145735,-123.183923,-123.23111258448,-123.231001],"lat":[42.004931,42.082066,42.098876,42.128069,42.128331,42.280466,42.287434,42.290816,42.312847,42.355665,42.420299,42.429362,42.495623,42.551766,42.626212,42.668065,42.70261,42.709956,42.709983,42.717161,42.717236,42.724474,42.724495,42.731703,42.731655,42.737765,42.737721,42.755835,42.75575,42.752218,42.752144,42.75941,42.759538,42.76095,42.760945,42.768116,42.767555,42.774773,42.774805,42.774874,42.774753,42.774704,42.774541,42.774603,42.781766,42.780653,42.780511,42.778221,42.792721,42.792712,42.806845,42.806831,42.8288,42.828689,42.823195,42.823496,42.837661,42.837671,42.85211,42.852099,42.866572,42.866603,42.88108,42.881141,42.89699,42.896812,42.895693,42.911073,42.9108,42.924651,42.92469,42.939185,42.939077,42.93976,42.939873,42.954373,42.95442,42.968923,42.968927,42.983439,42.983458,42.993456,42.996632,42.996632,42.996644,42.996499,42.910928,42.910926,42.901702,42.707455,42.4745,42.4745,42.395348,42.392086,42.288838,42.202994,42.127168,42.127156,42.0081011637255,42.008609,42.0093276173603,42.009485,42.0087619451744,42.00838,42.008121,42.007518,42.0055939147516,42.005036,42.004687,42.004211,42.0041828177379,42.004141,42.003945,42.0039200299812,42.0038869183156,42.0038268265009,42.003785,42.0037712404909,42.0035150173241,42.003507,42.003377680638,42.003084,42.00482,42.005064,42.0065873199631,42.00816,42.008761,42.005789,42.0039324384249,42.004931]}]],[[{"lng":[-123.725396,-123.725337,-123.724663,-123.724368,-123.657202,-123.627081,-123.622159,-123.601657,-123.599208,-123.576563,-123.57142,-123.568496,-123.561352,-123.551215,-123.550602,-123.50222,-123.495414,-123.49442,-123.478264,-123.477905,-123.468746,-123.448934,-123.412698,-123.396679,-123.339945,-123.321413,-123.249322,-123.209454,-123.186276,-123.092128,-123.068667,-123.068271,-123.068079,-123.066732,-123.06603,-123.065974,-123.067043,-123.067835,-123.068849,-123.068975,-123.070654,-123.072732,-123.073539,-123.074284,-123.075113,-123.075174,-123.075577,-123.074723,-123.071977,-123.069219,-123.068685,-123.066938,-123.065415,-123.064261,-123.058089,-123.055299,-123.05465,-123.053762,-123.051824,-123.047081,-123.042938,-123.041717,-123.040853,-123.040529,-123.040164,-123.037897,-123.037374,-123.037594,-123.037779,-123.037807,-123.037316,-123.036985,-123.037566,-123.038923,-123.037897,-123.038095,-123.039822,-123.04148,-123.042127,-123.042906,-123.043631,-123.044433,-123.0496,-123.054933,-123.060074,-123.062005,-123.067478,-123.06993,-123.071687,-123.072813,-123.076574,-123.081694,-123.082998,-123.091347,-123.093008,-123.105091,-123.109725,-123.111472,-123.112769,-123.1123,-123.110396,-123.108165,-123.107108,-123.108792,-123.11321,-123.116542,-123.120462,-123.123769,-123.125287,-123.128245,-123.13017,-123.132383,-123.13309,-123.134498,-123.13733,-123.141485,-123.144973,-123.146617,-123.147995,-123.147924,-123.149402,-123.152597,-123.155436,-123.1616,-123.16781,-123.170891,-123.174215,-123.178468,-123.180532,-123.180908,-123.180944,-123.180122,-123.179857,-123.179881,-123.180117,-123.18001,-123.179829,-123.179758,-123.179677,-123.179555,-123.179387,-123.17778,-123.173863,-123.169856,-123.166472,-123.158928,-123.154541,-123.152849,-123.151364,-123.149254,-123.143754,-123.140136,-123.131734,-123.126252,-123.118528,-123.1114,-123.109462,-123.103566,-123.101167,-123.093335,-123.091479,-123.091349,-123.09199,-123.095698,-123.097713,-123.102131,-123.110229,-123.117983,-123.122064,-123.124779,-123.125807,-123.126787,-123.128571,-123.129627,-123.131328,-123.132924,-123.133628,-123.137656,-123.140101,-123.144012,-123.145812,-123.14752,-123.148333,-123.148411,-123.147833,-123.145463,-123.143843,-123.140884,-123.137757,-123.135106,-123.1327,-123.132445,-123.133529,-123.137819,-123.146582,-123.150429,-123.150763,-123.150297,-123.149025,-123.182025,-123.201917,-123.221593,-123.23521,-123.240276,-123.301882,-123.316612,-123.339138,-123.409764,-123.414116,-123.438419,-123.47056,-123.54132,-123.580966,-123.602609,-123.704467,-123.704578,-123.716062,-123.725001,-123.725079,-123.725188,-123.725394,-123.724842,-123.724858,-123.724231,-123.724782,-123.724659,-123.724599,-123.725771,-123.725396],"lat":[45.023601,45.025068,45.044432,45.076226,45.076118,45.076067,45.076056,45.07602,45.076016,45.075976,45.075899,45.075848,45.075733,45.075568,45.075553,45.075115,45.07513,45.075138,45.075175,45.075176,45.0752,45.075293,45.075365,45.075389,45.075495,45.075527,45.075073,45.074982,45.075013,45.074932,45.07486,45.074864,45.074288,45.071438,45.069102,45.068042,45.060738,45.054188,45.046709,45.041493,45.036599,45.033397,45.031314,45.02584,45.021657,45.017489,45.014513,45.012533,45.008897,45.000505,44.998378,44.995005,44.990718,44.989778,44.989368,44.989826,44.989868,44.989928,44.990302,44.991041,44.990026,44.989381,44.98877,44.988502,44.988153,44.984421,44.981139,44.979621,44.977463,44.975841,44.972795,44.967428,44.965581,44.961154,44.958779,44.95657,44.95165,44.948114,44.947098,44.945975,44.94495,44.944231,44.942701,44.940694,44.937885,44.936207,44.932214,44.92905,44.928107,44.927686,44.926914,44.926878,44.927167,44.930297,44.930541,44.93044,44.930863,44.930161,44.928728,44.926012,44.923826,44.92249,44.920337,44.917505,44.914782,44.913242,44.912185,44.910536,44.909273,44.904764,44.90073,44.894683,44.891904,44.889368,44.887259,44.88374,44.877305,44.870722,44.866795,44.863181,44.861254,44.860059,44.860009,44.861579,44.864022,44.864462,44.863534,44.861006,44.858765,44.857553,44.855601,44.851647,44.845611,44.844667,44.841506,44.839568,44.837984,44.837131,44.836601,44.83612,44.835729,44.833332,44.83042,44.829041,44.828733,44.830236,44.830219,44.829536,44.827607,44.826506,44.825398,44.825503,44.826479,44.826079,44.822803,44.821691,44.82098,44.818847,44.817768,44.814044,44.811523,44.80953,44.806642,44.800848,44.799099,44.797542,44.796516,44.794537,44.793774,44.792666,44.791961,44.79117,44.789249,44.787897,44.785587,44.779867,44.778736,44.775272,44.773729,44.771832,44.770231,44.765404,44.760578,44.755137,44.751446,44.749516,44.748914,44.747632,44.747062,44.745741,44.743363,44.741157,44.738662,44.736145,44.731585,44.727611,44.72578,44.722689,44.720225,44.720085,44.720099,44.720125,44.720146,44.719914,44.719835,44.719994,44.720059,44.720531,44.720552,44.720622,44.720722,44.72127,44.719415,44.721154,44.721154,44.73898,44.739018,44.739046,44.753939,44.764328,44.88599,44.911745,44.94753,44.955493,44.962958,44.984273,45.00076,45.000746,45.023601]}]],[[{"lng":[-124.462619,-124.455669,-124.448625230642,-124.446875,-124.436198,-124.434655,-124.436655,-124.434312105988,-124.434213,-124.433542433297,-124.432236,-124.435157,-124.433357,-124.433641,-124.434527236125,-124.43785,-124.437373631068,-124.434451,-124.434419666916,-124.429253343926,-124.427595577081,-124.425024028606,-124.424113,-124.401726,-124.395302,-124.395338287504,-124.397382,-124.395607,-124.38246,-124.384117648066,-124.38708,-124.388891,-124.393988,-124.395536,-124.400404,-124.402814,-124.394143,-124.38972,-124.387642,-124.385296,-124.384603,-124.376997,-124.373037,-124.353332,-124.343247,-124.330671,-124.315012,-124.286896,-124.279473391428,-124.2782229273,-124.255609,-124.232025,-124.231975100174,-124.218966377223,-124.183435,-124.180894,-124.146347,-124.100765,-124.062969,-123.979004,-123.949565,-123.949573,-123.875698,-123.875628,-123.816657,-123.817154,-123.817614,-123.769016,-123.764884,-123.761528,-123.762801,-123.761983,-123.762289,-123.764496,-123.763917,-123.764339,-123.764356,-123.704752,-123.704456,-123.703862,-123.703568,-123.703417,-123.703655,-123.702167,-123.702131,-123.702139,-123.702144,-123.707059,-123.707057,-123.761333,-123.761384,-123.761594,-123.821118,-123.821121,-123.821513,-123.820515,-123.819496,-123.81915,-123.819144,-123.820439,-123.811789,-123.811553,-123.849858,-123.84989,-123.868282,-123.868491,-123.925717,-123.925942,-123.937268,-123.937288,-123.957026,-123.956985,-123.976631,-123.976677,-123.996296,-123.996291,-124.070314,-124.089872,-124.089872,-124.1192,-124.119228,-124.128073,-124.128049,-124.132918,-124.132926,-124.138748,-124.138686,-124.138655,-124.159966,-124.159895,-124.160163,-124.164887,-124.164225,-124.164889,-124.160149,-124.160658,-124.141185,-124.141475,-124.146344,-124.146377,-124.151235,-124.151209,-124.156491,-124.156629,-124.162074,-124.161288,-124.160976,-124.161308,-124.180704,-124.180706,-124.18531,-124.185291,-124.189907,-124.189984,-124.199692,-124.199717,-124.204529,-124.204851,-124.214201,-124.214393,-124.209522,-124.209708,-124.219416,-124.219623,-124.239394,-124.239129,-124.24387,-124.243779,-124.253317,-124.253467,-124.258274,-124.258388,-124.269254,-124.296347,-124.41539,-124.415423,-124.434245,-124.438676,-124.479636362958,-124.462619],"lat":[42.99143,43.008349,43.0271390597407,43.031808,43.071312,43.081469,43.085816,43.0895749921129,43.089734,43.0923284181646,43.097383,43.104678,43.108563,43.111397,43.111948449848,43.114016,43.114292094968,43.115986,43.1160189545965,43.1214526390494,43.123196196692,43.1259008249145,43.126859,43.184896,43.211101,43.2112497264283,43.219626,43.223908,43.270167,43.2727944798235,43.27749,43.290523,43.29926,43.30224,43.302121,43.305872,43.315651,43.323216,43.325968,43.32773,43.332848,43.334231,43.338953,43.342667,43.351517,43.366559,43.388389,43.436296,43.4519245921396,43.454557493182,43.502172,43.562393,43.5625784778939,43.6109319633736,43.610925,43.611445,43.611216,43.611244,43.609641,43.609363,43.609265,43.608472,43.608407,43.515947,43.516449,43.459594,43.431306,43.431695,43.431548,43.422294,43.387997,43.358748,43.351419,43.344799,43.287099,43.2636,43.258054,43.257741,43.243253,43.214139,43.186134,43.177696,43.170579,43.17059,43.113946,43.112458,43.087083,43.087067,43.083457,43.08316,43.054511,42.996318,42.996291,42.965284,42.924483,42.909675,42.909661,42.885135,42.884356,42.824112,42.824101,42.788837,42.788994,42.781821,42.781921,42.77484,42.774514,42.73971,42.739666,42.729097,42.729051,42.714569,42.714558,42.700118,42.7001,42.685651,42.685327,42.685454,42.678208,42.678339,42.671129,42.671123,42.666684,42.666697,42.671119,42.671115,42.729928,42.739956,42.739947,42.768326,42.790087,42.790006,42.804038,42.817825,42.817761,42.828288,42.828475,42.850586,42.850511,42.862081,42.862067,42.86581,42.8658,42.869642,42.86973,42.874824,42.876642,42.883499,42.88245,42.885998,42.885919,42.893047,42.893032,42.896696,42.896656,42.900275,42.900327,42.90391,42.904006,42.911141,42.911125,42.918227,42.918156,42.933782,42.933751,42.940948,42.940652,42.9443,42.943809,42.951314,42.951152,42.954946,42.954877,42.954621,42.955232,42.953769,42.95369,42.953817,42.9543325389089,42.99143]}]]],null,"cnty - estimate",{"crs":{"crsClass":"L.CRS.EPSG3857","code":null,"proj4def":null,"projectedBounds":null,"options":{}},"pane":"polygon","stroke":true,"color":"#333333","weight":0.5,"opacity":[0.9,0.9,0.9,0.9,0.9,0.9,0.9,0.9,0.9,0.9,0.9,0.9,0.9,0.9,0.9,0.9,0.9,0.9,0.9,0.9,0.9,0.9,0.9,0.9,0.9,0.9,0.9,0.9,0.9,0.9,0.9,0.9,0.9,0.9,0.9,0.9],"fill":true,"fillColor":["#3C3777","#46236A","#491763","#491763","#46236A","#009197","#491763","#009F94","#008298","#46236A","#422D71","#46236A","#46236A","#33407D","#DDE12C","#491763","#3C3777","#491763","#33407D","#46236A","#46236A","#005A8C","#00C278","#33407D","#491763","#491763","#491763","#46236A","#46236A","#422D71","#422D71","#422D71","#491763","#006290","#3C3777","#422D71"],"fillOpacity":[0.6,0.6,0.6,0.6,0.6,0.6,0.6,0.6,0.6,0.6,0.6,0.6,0.6,0.6,0.6,0.6,0.6,0.6,0.6,0.6,0.6,0.6,0.6,0.6,0.6,0.6,0.6,0.6,0.6,0.6,0.6,0.6,0.6,0.6,0.6,0.6],"smoothFactor":1,"noClip":false},["<div class='scrollableContainer'><table class= id='popup'><tr class='coord'><td><\/td><th><b>Feature ID <\/b><\/th><td>1 <\/td><\/tr><tr><td>1<\/td><th>NAME <\/th><td>Josephine County, Oregon <\/td><\/tr><tr><td>2<\/td><th>estimate <\/th><td> 65703 <\/td><\/tr><\/table><\/div>","<div class='scrollableContainer'><table class= id='popup'><tr class='coord'><td><\/td><th><b>Feature ID <\/b><\/th><td>2 <\/td><\/tr><tr><td>1<\/td><th>NAME <\/th><td>Malheur County, Oregon <\/td><\/tr><tr><td>2<\/td><th>estimate <\/th><td> 20497 <\/td><\/tr><\/table><\/div>","<div class='scrollableContainer'><table class= id='popup'><tr class='coord'><td><\/td><th><b>Feature ID <\/b><\/th><td>3 <\/td><\/tr><tr><td>1<\/td><th>NAME <\/th><td>Baker County, Oregon <\/td><\/tr><tr><td>2<\/td><th>estimate <\/th><td> 12415 <\/td><\/tr><\/table><\/div>","<div class='scrollableContainer'><table class= id='popup'><tr class='coord'><td><\/td><th><b>Feature ID <\/b><\/th><td>4 <\/td><\/tr><tr><td>1<\/td><th>NAME <\/th><td>Gilliam County, Oregon <\/td><\/tr><tr><td>2<\/td><th>estimate <\/th><td> 1477 <\/td><\/tr><\/table><\/div>","<div class='scrollableContainer'><table class= id='popup'><tr class='coord'><td><\/td><th><b>Feature ID <\/b><\/th><td>5 <\/td><\/tr><tr><td>1<\/td><th>NAME <\/th><td>Curry County, Oregon <\/td><\/tr><tr><td>2<\/td><th>estimate <\/th><td> 19116 <\/td><\/tr><\/table><\/div>","<div class='scrollableContainer'><table class= id='popup'><tr class='coord'><td><\/td><th><b>Feature ID <\/b><\/th><td>6 <\/td><\/tr><tr><td>1<\/td><th>NAME <\/th><td>Lane County, Oregon <\/td><\/tr><tr><td>2<\/td><th>estimate <\/th><td>264813 <\/td><\/tr><\/table><\/div>","<div class='scrollableContainer'><table class= id='popup'><tr class='coord'><td><\/td><th><b>Feature ID <\/b><\/th><td>7 <\/td><\/tr><tr><td>1<\/td><th>NAME <\/th><td>Harney County, Oregon <\/td><\/tr><tr><td>2<\/td><th>estimate <\/th><td> 5499 <\/td><\/tr><\/table><\/div>","<div class='scrollableContainer'><table class= id='popup'><tr class='coord'><td><\/td><th><b>Feature ID <\/b><\/th><td>8 <\/td><\/tr><tr><td>1<\/td><th>NAME <\/th><td>Clackamas County, Oregon <\/td><\/tr><tr><td>2<\/td><th>estimate <\/th><td>300373 <\/td><\/tr><\/table><\/div>","<div class='scrollableContainer'><table class= id='popup'><tr class='coord'><td><\/td><th><b>Feature ID <\/b><\/th><td>9 <\/td><\/tr><tr><td>1<\/td><th>NAME <\/th><td>Marion County, Oregon <\/td><\/tr><tr><td>2<\/td><th>estimate <\/th><td>230076 <\/td><\/tr><\/table><\/div>","<div class='scrollableContainer'><table class= id='popup'><tr class='coord'><td><\/td><th><b>Feature ID <\/b><\/th><td>10 <\/td><\/tr><tr><td>1<\/td><th>NAME <\/th><td>Jefferson County, Oregon <\/td><\/tr><tr><td>2<\/td><th>estimate <\/th><td> 17060 <\/td><\/tr><\/table><\/div>","<div class='scrollableContainer'><table class= id='popup'><tr class='coord'><td><\/td><th><b>Feature ID <\/b><\/th><td>11 <\/td><\/tr><tr><td>1<\/td><th>NAME <\/th><td>Klamath County, Oregon <\/td><\/tr><tr><td>2<\/td><th>estimate <\/th><td> 48771 <\/td><\/tr><\/table><\/div>","<div class='scrollableContainer'><table class= id='popup'><tr class='coord'><td><\/td><th><b>Feature ID <\/b><\/th><td>12 <\/td><\/tr><tr><td>1<\/td><th>NAME <\/th><td>Crook County, Oregon <\/td><\/tr><tr><td>2<\/td><th>estimate <\/th><td> 18626 <\/td><\/tr><\/table><\/div>","<div class='scrollableContainer'><table class= id='popup'><tr class='coord'><td><\/td><th><b>Feature ID <\/b><\/th><td>13 <\/td><\/tr><tr><td>1<\/td><th>NAME <\/th><td>Union County, Oregon <\/td><\/tr><tr><td>2<\/td><th>estimate <\/th><td> 17596 <\/td><\/tr><\/table><\/div>","<div class='scrollableContainer'><table class= id='popup'><tr class='coord'><td><\/td><th><b>Feature ID <\/b><\/th><td>14 <\/td><\/tr><tr><td>1<\/td><th>NAME <\/th><td>Douglas County, Oregon <\/td><\/tr><tr><td>2<\/td><th>estimate <\/th><td> 82360 <\/td><\/tr><\/table><\/div>","<div class='scrollableContainer'><table class= id='popup'><tr class='coord'><td><\/td><th><b>Feature ID <\/b><\/th><td>15 <\/td><\/tr><tr><td>1<\/td><th>NAME <\/th><td>Multnomah County, Oregon <\/td><\/tr><tr><td>2<\/td><th>estimate <\/th><td>598188 <\/td><\/tr><\/table><\/div>","<div class='scrollableContainer'><table class= id='popup'><tr class='coord'><td><\/td><th><b>Feature ID <\/b><\/th><td>16 <\/td><\/tr><tr><td>1<\/td><th>NAME <\/th><td>Grant County, Oregon <\/td><\/tr><tr><td>2<\/td><th>estimate <\/th><td> 5609 <\/td><\/tr><\/table><\/div>","<div class='scrollableContainer'><table class= id='popup'><tr class='coord'><td><\/td><th><b>Feature ID <\/b><\/th><td>17 <\/td><\/tr><tr><td>1<\/td><th>NAME <\/th><td>Benton County, Oregon <\/td><\/tr><tr><td>2<\/td><th>estimate <\/th><td> 58369 <\/td><\/tr><\/table><\/div>","<div class='scrollableContainer'><table class= id='popup'><tr class='coord'><td><\/td><th><b>Feature ID <\/b><\/th><td>18 <\/td><\/tr><tr><td>1<\/td><th>NAME <\/th><td>Sherman County, Oregon <\/td><\/tr><tr><td>2<\/td><th>estimate <\/th><td> 1368 <\/td><\/tr><\/table><\/div>","<div class='scrollableContainer'><table class= id='popup'><tr class='coord'><td><\/td><th><b>Feature ID <\/b><\/th><td>19 <\/td><\/tr><tr><td>1<\/td><th>NAME <\/th><td>Linn County, Oregon <\/td><\/tr><tr><td>2<\/td><th>estimate <\/th><td> 89890 <\/td><\/tr><\/table><\/div>","<div class='scrollableContainer'><table class= id='popup'><tr class='coord'><td><\/td><th><b>Feature ID <\/b><\/th><td>20 <\/td><\/tr><tr><td>1<\/td><th>NAME <\/th><td>Clatsop County, Oregon <\/td><\/tr><tr><td>2<\/td><th>estimate <\/th><td> 30595 <\/td><\/tr><\/table><\/div>","<div class='scrollableContainer'><table class= id='popup'><tr class='coord'><td><\/td><th><b>Feature ID <\/b><\/th><td>21 <\/td><\/tr><tr><td>1<\/td><th>NAME <\/th><td>Wasco County, Oregon <\/td><\/tr><tr><td>2<\/td><th>estimate <\/th><td> 18770 <\/td><\/tr><\/table><\/div>","<div class='scrollableContainer'><table class= id='popup'><tr class='coord'><td><\/td><th><b>Feature ID <\/b><\/th><td>22 <\/td><\/tr><tr><td>1<\/td><th>NAME <\/th><td>Deschutes County, Oregon <\/td><\/tr><tr><td>2<\/td><th>estimate <\/th><td>147063 <\/td><\/tr><\/table><\/div>","<div class='scrollableContainer'><table class= id='popup'><tr class='coord'><td><\/td><th><b>Feature ID <\/b><\/th><td>23 <\/td><\/tr><tr><td>1<\/td><th>NAME <\/th><td>Washington County, Oregon <\/td><\/tr><tr><td>2<\/td><th>estimate <\/th><td>417204 <\/td><\/tr><\/table><\/div>","<div class='scrollableContainer'><table class= id='popup'><tr class='coord'><td><\/td><th><b>Feature ID <\/b><\/th><td>24 <\/td><\/tr><tr><td>1<\/td><th>NAME <\/th><td>Yamhill County, Oregon <\/td><\/tr><tr><td>2<\/td><th>estimate <\/th><td> 73347 <\/td><\/tr><\/table><\/div>","<div class='scrollableContainer'><table class= id='popup'><tr class='coord'><td><\/td><th><b>Feature ID <\/b><\/th><td>25 <\/td><\/tr><tr><td>1<\/td><th>NAME <\/th><td>Wallowa County, Oregon <\/td><\/tr><tr><td>2<\/td><th>estimate <\/th><td> 5608 <\/td><\/tr><\/table><\/div>","<div class='scrollableContainer'><table class= id='popup'><tr class='coord'><td><\/td><th><b>Feature ID <\/b><\/th><td>26 <\/td><\/tr><tr><td>1<\/td><th>NAME <\/th><td>Morrow County, Oregon <\/td><\/tr><tr><td>2<\/td><th>estimate <\/th><td> 7712 <\/td><\/tr><\/table><\/div>","<div class='scrollableContainer'><table class= id='popup'><tr class='coord'><td><\/td><th><b>Feature ID <\/b><\/th><td>27 <\/td><\/tr><tr><td>1<\/td><th>NAME <\/th><td>Lake County, Oregon <\/td><\/tr><tr><td>2<\/td><th>estimate <\/th><td> 6130 <\/td><\/tr><\/table><\/div>","<div class='scrollableContainer'><table class= id='popup'><tr class='coord'><td><\/td><th><b>Feature ID <\/b><\/th><td>28 <\/td><\/tr><tr><td>1<\/td><th>NAME <\/th><td>Tillamook County, Oregon <\/td><\/tr><tr><td>2<\/td><th>estimate <\/th><td> 20699 <\/td><\/tr><\/table><\/div>","<div class='scrollableContainer'><table class= id='popup'><tr class='coord'><td><\/td><th><b>Feature ID <\/b><\/th><td>29 <\/td><\/tr><tr><td>1<\/td><th>NAME <\/th><td>Hood River County, Oregon <\/td><\/tr><tr><td>2<\/td><th>estimate <\/th><td> 16735 <\/td><\/tr><\/table><\/div>","<div class='scrollableContainer'><table class= id='popup'><tr class='coord'><td><\/td><th><b>Feature ID <\/b><\/th><td>30 <\/td><\/tr><tr><td>1<\/td><th>NAME <\/th><td>Umatilla County, Oregon <\/td><\/tr><tr><td>2<\/td><th>estimate <\/th><td> 52883 <\/td><\/tr><\/table><\/div>","<div class='scrollableContainer'><table class= id='popup'><tr class='coord'><td><\/td><th><b>Feature ID <\/b><\/th><td>31 <\/td><\/tr><tr><td>1<\/td><th>NAME <\/th><td>Lincoln County, Oregon <\/td><\/tr><tr><td>2<\/td><th>estimate <\/th><td> 39183 <\/td><\/tr><\/table><\/div>","<div class='scrollableContainer'><table class= id='popup'><tr class='coord'><td><\/td><th><b>Feature ID <\/b><\/th><td>32 <\/td><\/tr><tr><td>1<\/td><th>NAME <\/th><td>Columbia County, Oregon <\/td><\/tr><tr><td>2<\/td><th>estimate <\/th><td> 38085 <\/td><\/tr><\/table><\/div>","<div class='scrollableContainer'><table class= id='popup'><tr class='coord'><td><\/td><th><b>Feature ID <\/b><\/th><td>33 <\/td><\/tr><tr><td>1<\/td><th>NAME <\/th><td>Wheeler County, Oregon <\/td><\/tr><tr><td>2<\/td><th>estimate <\/th><td> 1101 <\/td><\/tr><\/table><\/div>","<div class='scrollableContainer'><table class= id='popup'><tr class='coord'><td><\/td><th><b>Feature ID <\/b><\/th><td>34 <\/td><\/tr><tr><td>1<\/td><th>NAME <\/th><td>Jackson County, Oregon <\/td><\/tr><tr><td>2<\/td><th>estimate <\/th><td>160008 <\/td><\/tr><\/table><\/div>","<div class='scrollableContainer'><table class= id='popup'><tr class='coord'><td><\/td><th><b>Feature ID <\/b><\/th><td>35 <\/td><\/tr><tr><td>1<\/td><th>NAME <\/th><td>Polk County, Oregon <\/td><\/tr><tr><td>2<\/td><th>estimate <\/th><td> 57222 <\/td><\/tr><\/table><\/div>","<div class='scrollableContainer'><table class= id='popup'><tr class='coord'><td><\/td><th><b>Feature ID <\/b><\/th><td>36 <\/td><\/tr><tr><td>1<\/td><th>NAME <\/th><td>Coos County, Oregon <\/td><\/tr><tr><td>2<\/td><th>estimate <\/th><td> 48945 <\/td><\/tr><\/table><\/div>"],{"maxWidth":800,"minWidth":50,"autoPan":true,"keepInView":false,"closeButton":true,"closeOnClick":true,"className":""},["65703","20497","12415","1477","19116","264813","5499","300373","230076","17060","48771","18626","17596","82360","598188","5609","58369","1368","89890","30595","18770","147063","417204","73347","5608","7712","6130","20699","16735","52883","39183","38085","1101","160008","57222","48945"],{"interactive":false,"permanent":false,"direction":"auto","opacity":1,"offset":[0,0],"textsize":"10px","textOnly":false,"className":"","sticky":true},{"stroke":true,"weight":1,"opacity":0.9,"fillOpacity":0.84,"bringToFront":false,"sendToBack":false}]},{"method":"addScaleBar","args":[{"maxWidth":100,"metric":true,"imperial":true,"updateWhenIdle":true,"position":"bottomleft"}]},{"method":"addHomeButton","args":[-124.566244,41.991794,-116.463504,46.290834,true,"cnty___estimate","Zoom to cnty___estimate","<strong> cnty___estimate <\/strong>","bottomright"]},{"method":"addLayersControl","args":[["CartoDB.Positron","CartoDB.DarkMatter","OpenStreetMap","Esri.WorldImagery","OpenTopoMap"],"cnty - estimate",{"collapsed":true,"autoZIndex":true,"position":"topleft"}]},{"method":"addLegend","args":[{"colors":["#4B0055 , #353E7C 16.5635828614591%, #007094 33.3115609618029%, #009C95 50.0595390621467%, #00BF7C 66.8075171624906%, #98D84A 83.5554952628344%, #FDE333 "],"labels":["100,000","200,000","300,000","400,000","500,000"],"na_color":null,"na_label":"NA","opacity":1,"position":"topright","type":"numeric","title":"cnty - estimate","extra":{"p_1":0.1656358286145905,"p_n":0.8355549526283439},"layerId":null,"className":"info legend","group":"cnty - estimate"}]}],"limits":{"lat":[41.991794,46.290834],"lng":[-124.566244,-116.463504]},"fitBounds":[41.991794,-124.566244,46.290834,-116.463504,[]]},"evals":[],"jsHooks":{"render":[{"code":"function(el, x, data) {\n return (\n function(el, x, data) {\n // get the leaflet map\n var map = this; //HTMLWidgets.find('#' + el.id);\n // we need a new div element because we have to handle\n // the mouseover output separately\n // debugger;\n function addElement () {\n // generate new div Element\n var newDiv = $(document.createElement('div'));\n // append at end of leaflet htmlwidget container\n $(el).append(newDiv);\n //provide ID and style\n newDiv.addClass('lnlt');\n newDiv.css({\"position\":\"relative\",\"bottomleft\":\"0px\",\"background-color\":\"rgba(255, 255, 255, 0.7)\",\"box-shadow\":\"0 0 2px #bbb\",\"background-clip\":\"padding-box\",\"margin\":\"0\",\"padding-left\":\"5px\",\"padding-right\":\"5px\",\"color\":\"#333\",\"font-size\":\"9px\",\"font-family\":\"\\\"Helvetica Neue\\\", Arial, Helvetica, sans-serif\",\"text-align\":\"left\",\"z-index\":\"700\"});\n return newDiv;\n }\n\n\n // check for already existing lnlt class to not duplicate\n var lnlt = $(el).find('.lnlt');\n\n if(!lnlt.length) {\n lnlt = addElement();\n\n // grab the special div we generated in the beginning\n // and put the mousmove output there\n\n map.on('mousemove', function (e) {\n if (e.originalEvent.ctrlKey) {\n if (document.querySelector('.lnlt') === null) lnlt = addElement();\n lnlt.text(\n ' lon: ' + (e.latlng.lng).toFixed(5) +\n ' | lat: ' + (e.latlng.lat).toFixed(5) +\n ' | zoom: ' + map.getZoom() +\n ' | x: ' + L.CRS.EPSG3857.project(e.latlng).x.toFixed(0) +\n ' | y: ' + L.CRS.EPSG3857.project(e.latlng).y.toFixed(0) +\n ' | epsg: 3857 ' +\n ' | proj4: +proj=merc +a=6378137 +b=6378137 +lat_ts=0.0 +lon_0=0.0 +x_0=0.0 +y_0=0 +k=1.0 +units=m +nadgrids=@null +no_defs ');\n } else {\n if (document.querySelector('.lnlt') === null) lnlt = addElement();\n lnlt.text(\n ' lon: ' + (e.latlng.lng).toFixed(5) +\n ' | lat: ' + (e.latlng.lat).toFixed(5) +\n ' | zoom: ' + map.getZoom() + ' ');\n }\n });\n\n // remove the lnlt div when mouse leaves map\n map.on('mouseout', function (e) {\n var strip = document.querySelector('.lnlt');\n if( strip !==null) strip.remove();\n });\n\n };\n\n //$(el).keypress(67, function(e) {\n map.on('preclick', function(e) {\n if (e.originalEvent.ctrlKey) {\n if (document.querySelector('.lnlt') === null) lnlt = addElement();\n lnlt.text(\n ' lon: ' + (e.latlng.lng).toFixed(5) +\n ' | lat: ' + (e.latlng.lat).toFixed(5) +\n ' | zoom: ' + map.getZoom() + ' ');\n var txt = document.querySelector('.lnlt').textContent;\n console.log(txt);\n //txt.innerText.focus();\n //txt.select();\n setClipboardText('\"' + txt + '\"');\n }\n });\n\n }\n ).call(this.getMap(), el, x, data);\n}","data":null},{"code":"function(el, x, data) {\n return (function(el,x,data){\n var map = this;\n\n map.on('keypress', function(e) {\n console.log(e.originalEvent.code);\n var key = e.originalEvent.code;\n if (key === 'KeyE') {\n var bb = this.getBounds();\n var txt = JSON.stringify(bb);\n console.log(txt);\n\n setClipboardText('\\'' + txt + '\\'');\n }\n })\n }).call(this.getMap(), el, x, data);\n}","data":null}]}}</script> --- class: inverse-blue center middle # A few other things of note --- # statebins ``` r library(statebins) statebins(states, state_col = "NAME", value_col = "estimate") + theme_void() ``` 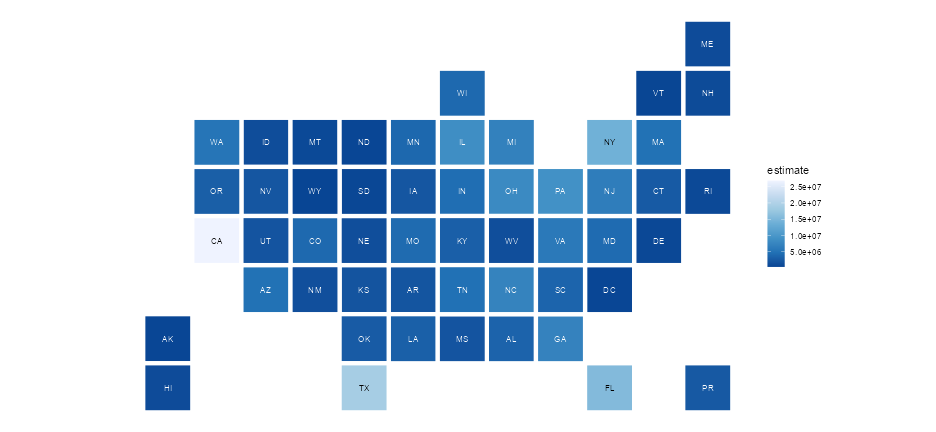<!-- --> --- # Cartograms ``` r library(cartogram) or_county_pop <- get_acs( geography = "county", state = "OR", variables = "B01003_001", year = 2022, geometry = TRUE ) or_county_pop <- st_transform(or_county_pop, crs = 2992) carto_counties <- cartogram_cont(or_county_pop, "estimate") ``` --- # Compare .pull-left[ ``` r ggplot(or_county_pop) + geom_sf(fill = "#BCD8EB") ``` 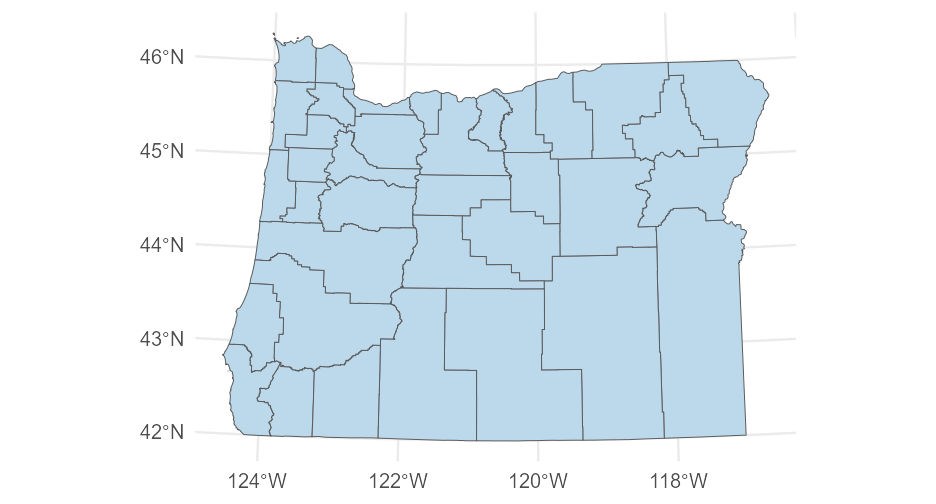<!-- --> ] .pull-right[ ``` r ggplot(carto_counties) + geom_sf(fill = "#D5FFFA") ``` <!-- --> ] --- # US cartogram by population ``` r state_pop <- get_acs( geography = "state", variables = "B01003_001", year = 2022, geometry = TRUE ) state_pop <- st_transform(state_pop, crs = 2163) carto_states <- cartogram_cont(state_pop, "estimate") ``` --- ``` r ggplot(carto_states) + geom_sf() ``` <!-- --> --- # Last note You may or may not like cartograms. -- Just be careful not to lie with maps.  --- class: inverse-green # Next time: Shiny App+ Some final presentations!