class: center, middle, inverse, title-slide .title[ # Wrap-up Week 5 + HTML Stuff ] .subtitle[ ## Theming, Fonts, & Dashboards ] .author[ ### Maithreyi Gopalan ] .date[ ### Week 6 ] --- layout: true <script> feather.replace() </script> <div class="slides-footer"> <span> <a class = "footer-icon-link" href = "https://github.com/maithgopalan/c2-dataviz-2026/raw/main/static/slides/w6.pdf"> <i class = "footer-icon" data-feather="download"></i> </a> <a class = "footer-icon-link" href = "https://dataviz-win2026.netlify.app/slides/w6.html"> <i class = "footer-icon" data-feather="link"></i> </a> <a class = "footer-icon-link" href = "https://github.com/maithgopalan/c2-dataviz-2026"> <i class = "footer-icon" data-feather="github"></i> </a> </span> </div> --- # Agenda * Fonts w/ggplot2 * Flexdashboards (R Markdown) * Quarto Dashboards (the modern approach) + What's new in 2025: `_brand.yml`, value boxes, light/dark mode + You'll build one step-by-step in Lab 6 * Some customization w/CSS (including fonts) + If we don't get to this today, we'll come back to it on Week 9 * Lab 4 and 5 review * Quick refresher on troubleshooting html rendering --- class:inverse-blue center middle # Fonts --- # General advice * Match your plot fonts to your text body font -- * Use different fonts to distinguish things + Specifically code + Consider for different heading levels -- * **Always** choose a sans-serif font for code -- * Explore and try - it makes a big impact on the overall look/feel -- * Try not to get sucked into too deep of a rabbit hole --- # {ragg} ``` r #install.packages("ragg") ``` Alternative device to Cairo, png, etc. See the announcement [here](https://www.tidyverse.org/blog/2021/02/modern-text-features/) -- After install, be sure to set *Global Options > General > Graphics* to *AGG* Use with RMarkdown with `knitr::opts_chunk$set(dev = "ragg_png")` -- Will automatically detect fonts you have installed on your computer --- ``` r ggplot(mtcars, aes(wt, mpg)) + geom_point() + labs(title = "Fuel Efficiency of 32 Cars", x = "Weight (x1000 lb)", y = "Miles per Gallon") + * theme(text = element_text(family = "Luminari", size = 30)) ``` <img src="w6_new_files/figure-html/extrafont-plot-1.png" width="720" /> --- # Support for lots of things! Ligatures and font-awesome icons ``` r ggplot() + geom_text( aes(x = 0, y = 2, label = "x <- y != z"), family = "Fira Code" ) + labs(title = "twitter") + theme( plot.title = element_text( family = "Font Awesome 5 brands" ) ) ``` --- <img src="w6_new_files/figure-html/unnamed-chunk-5-1.png" width="720" /> --- # emojis ``` r ggplot(mtcars, aes(disp, mpg)) + geom_text(label = "🎉", family = "Apple Color Emoji", size = 10) ``` <img src="w6_new_files/figure-html/unnamed-chunk-6-1.png" width="720" /> --- # Google fonts https://fonts.google.com * Open source, designed for the web * Good place to explore fonts * Can be incorporated via the `{showtext}` package! --- # {showtext} example ``` r devtools::install_github("yixuan/showtext") library(showtext) font_add_google('Monsieur La Doulaise', "mld") font_add_google('Special Elite', "se") showtext_auto() ggplot(mtcars, aes(disp, mpg)) + geom_point() + labs(title = "An amazing title", subtitle = "with the world's most boring dataset") + * theme(plot.subtitle = element_text(size = 18, family = "se"), * plot.title = element_text(size = 22, family = "mld"), * axis.title = element_text(size = 18, family = "mld"), * axis.text.x = element_text(size = 12, family = "se"), * axis.text.y = element_text(size = 12, family = "se")) ``` --- background-image:url("img/font-change.png") background-size: contain --- # Try experimenting with new fonts! * Create a simple plot * Change the font to something on your computer (e.g., "Arial") * Try importing and using a google font with **showtext** * Try using different fonts for the title and subtitle --- class: inverse-blue center middle # Why fonts matter ### A few examples of epic fails --- # Megaflicks - LOL .center[  ] --- background-image: url(https://i.redd.it/38jjcgaqu1g11.jpg) --- background-image: url(img/always-mine.png) --- # Quick aside ### Change the font of your R Markdown! Create a CSS code chunk - write tiny bit of CSS - voila! ``` css @import url('https://fonts.googleapis.com/css?family=Akronim&display=swap'); body { font-family: 'Akronim', cursive; } ``` See the CSS slides for more information. --- # Render!  --- # Aside I actually did this for the table slides to make them a bit smaller!  --- # Resource for learning more * I'm not an expert on fonts. I have mostly just picked what looks nice to me. * Consider the accesibility of the font ([good resource here](https://venngage.com/blog/accessible-fonts/)) -- * But don't get sucked into the rabbit hole of fonts! {height="50%"} --- Best I've heard of is [practical typography](https://practicaltypography.com) {width="75%"} --- # Identify fonts Use others work to help you - I found the font for these slides from Daniel's theme and he used one that he liked. Use google chrome's developer tools to help! Also consider downloading fonts (from google or wherever) and using them directly. Check out this [great blog post](https://yjunechoe.github.io/posts/2021-06-24-setting-up-and-debugging-custom-fonts/) by June Choe. --- class: inverse-red middle # Dashboards! --- # Two approaches to dashboards in R | | **flexdashboard** (R Markdown) | **Quarto Dashboards** | |---|---|---| | Format | `.Rmd` | `.qmd` | | Available since | 2016 | Quarto v1.4 (2024) | | Layout syntax | Markdown headers + `{data-width}` | Markdown headers + YAML attributes | | Interactivity | `runtime: shiny` | `server: shiny` | | Theming | Bootstrap themes, custom CSS | `_brand.yml`, Bootstrap, CSS | | Value boxes | `flexdashboard::valueBox()` | Native chunk option `#| content: valuebox` | | Status | Stable, maintained | Actively developed | -- We'll cover **both** — flexdashboard first (since we're in R Markdown land), then the Quarto way. --- class: inverse-red middle center # Part 1: flexdashboard --- # The definitive source! https://rmarkdown.rstudio.com/flexdashboard/ 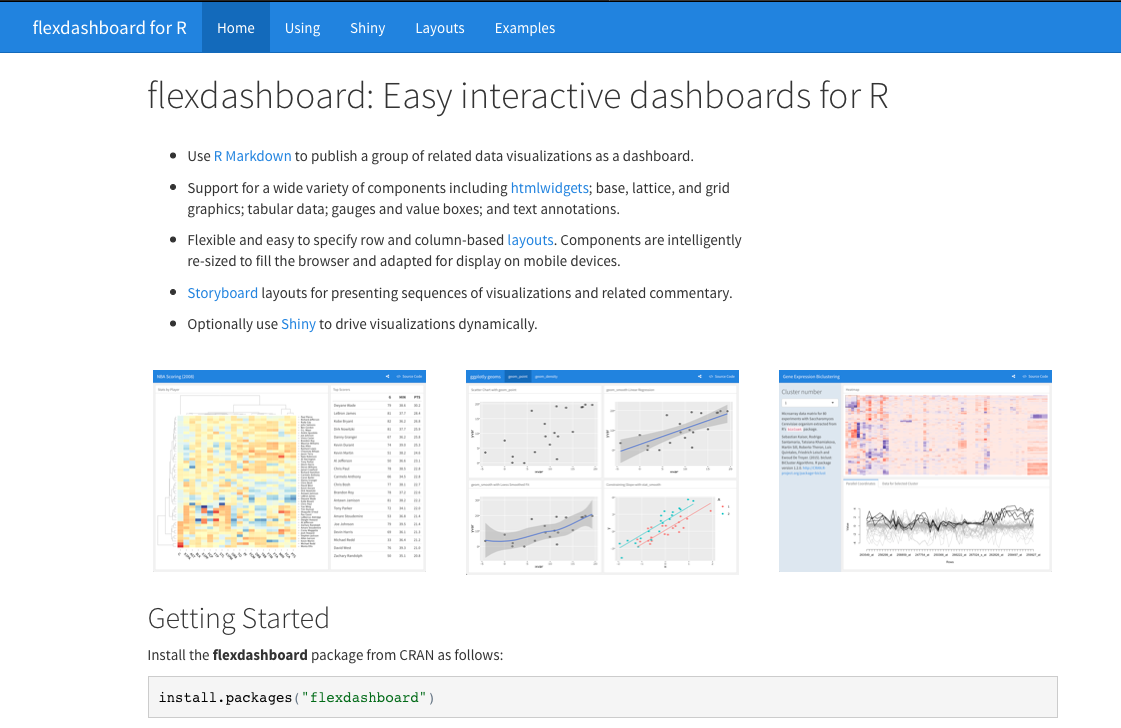{width="75%"} --- # Example 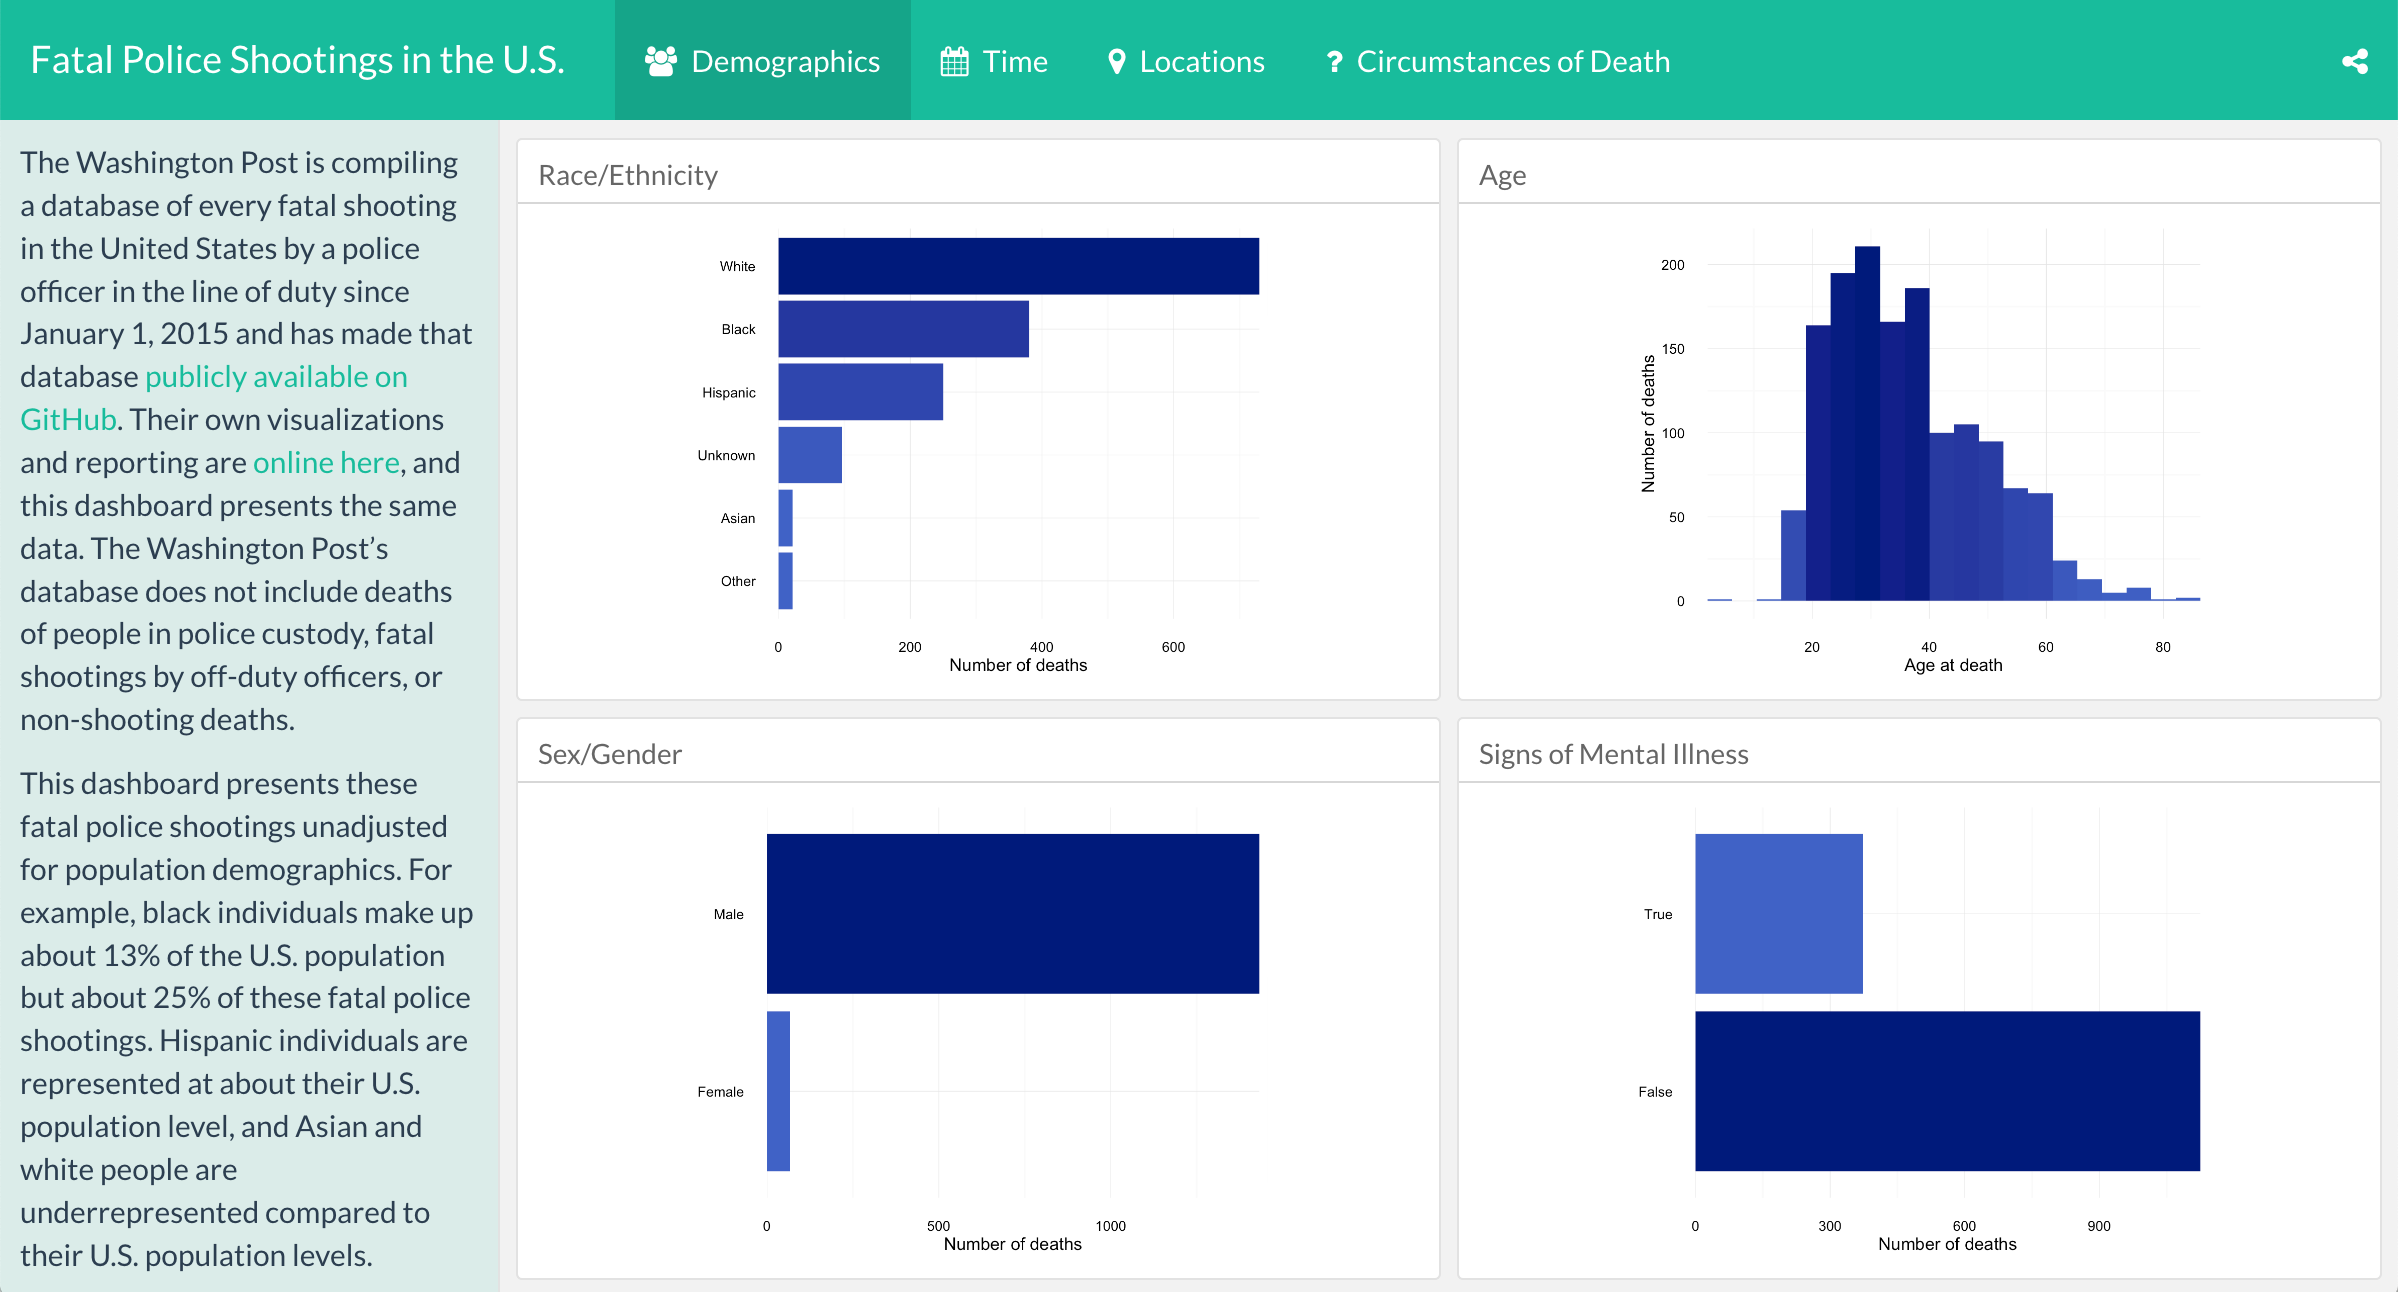 .footnote[Credit: This example from [Alison Hill's rstudio::conf(2019L) class]()] -- By [Julia Silge](https://juliasilge.com) (see the [blog post](https://juliasilge.com/blog/fatal-shootings/), [dashboard](https://beta.rstudioconnect.com/juliasilge/policeshooting/policeshooting.html), and [source code](https://gist.github.com/juliasilge/9acbe97c549502bac85404779edceba0)) --- # Another example 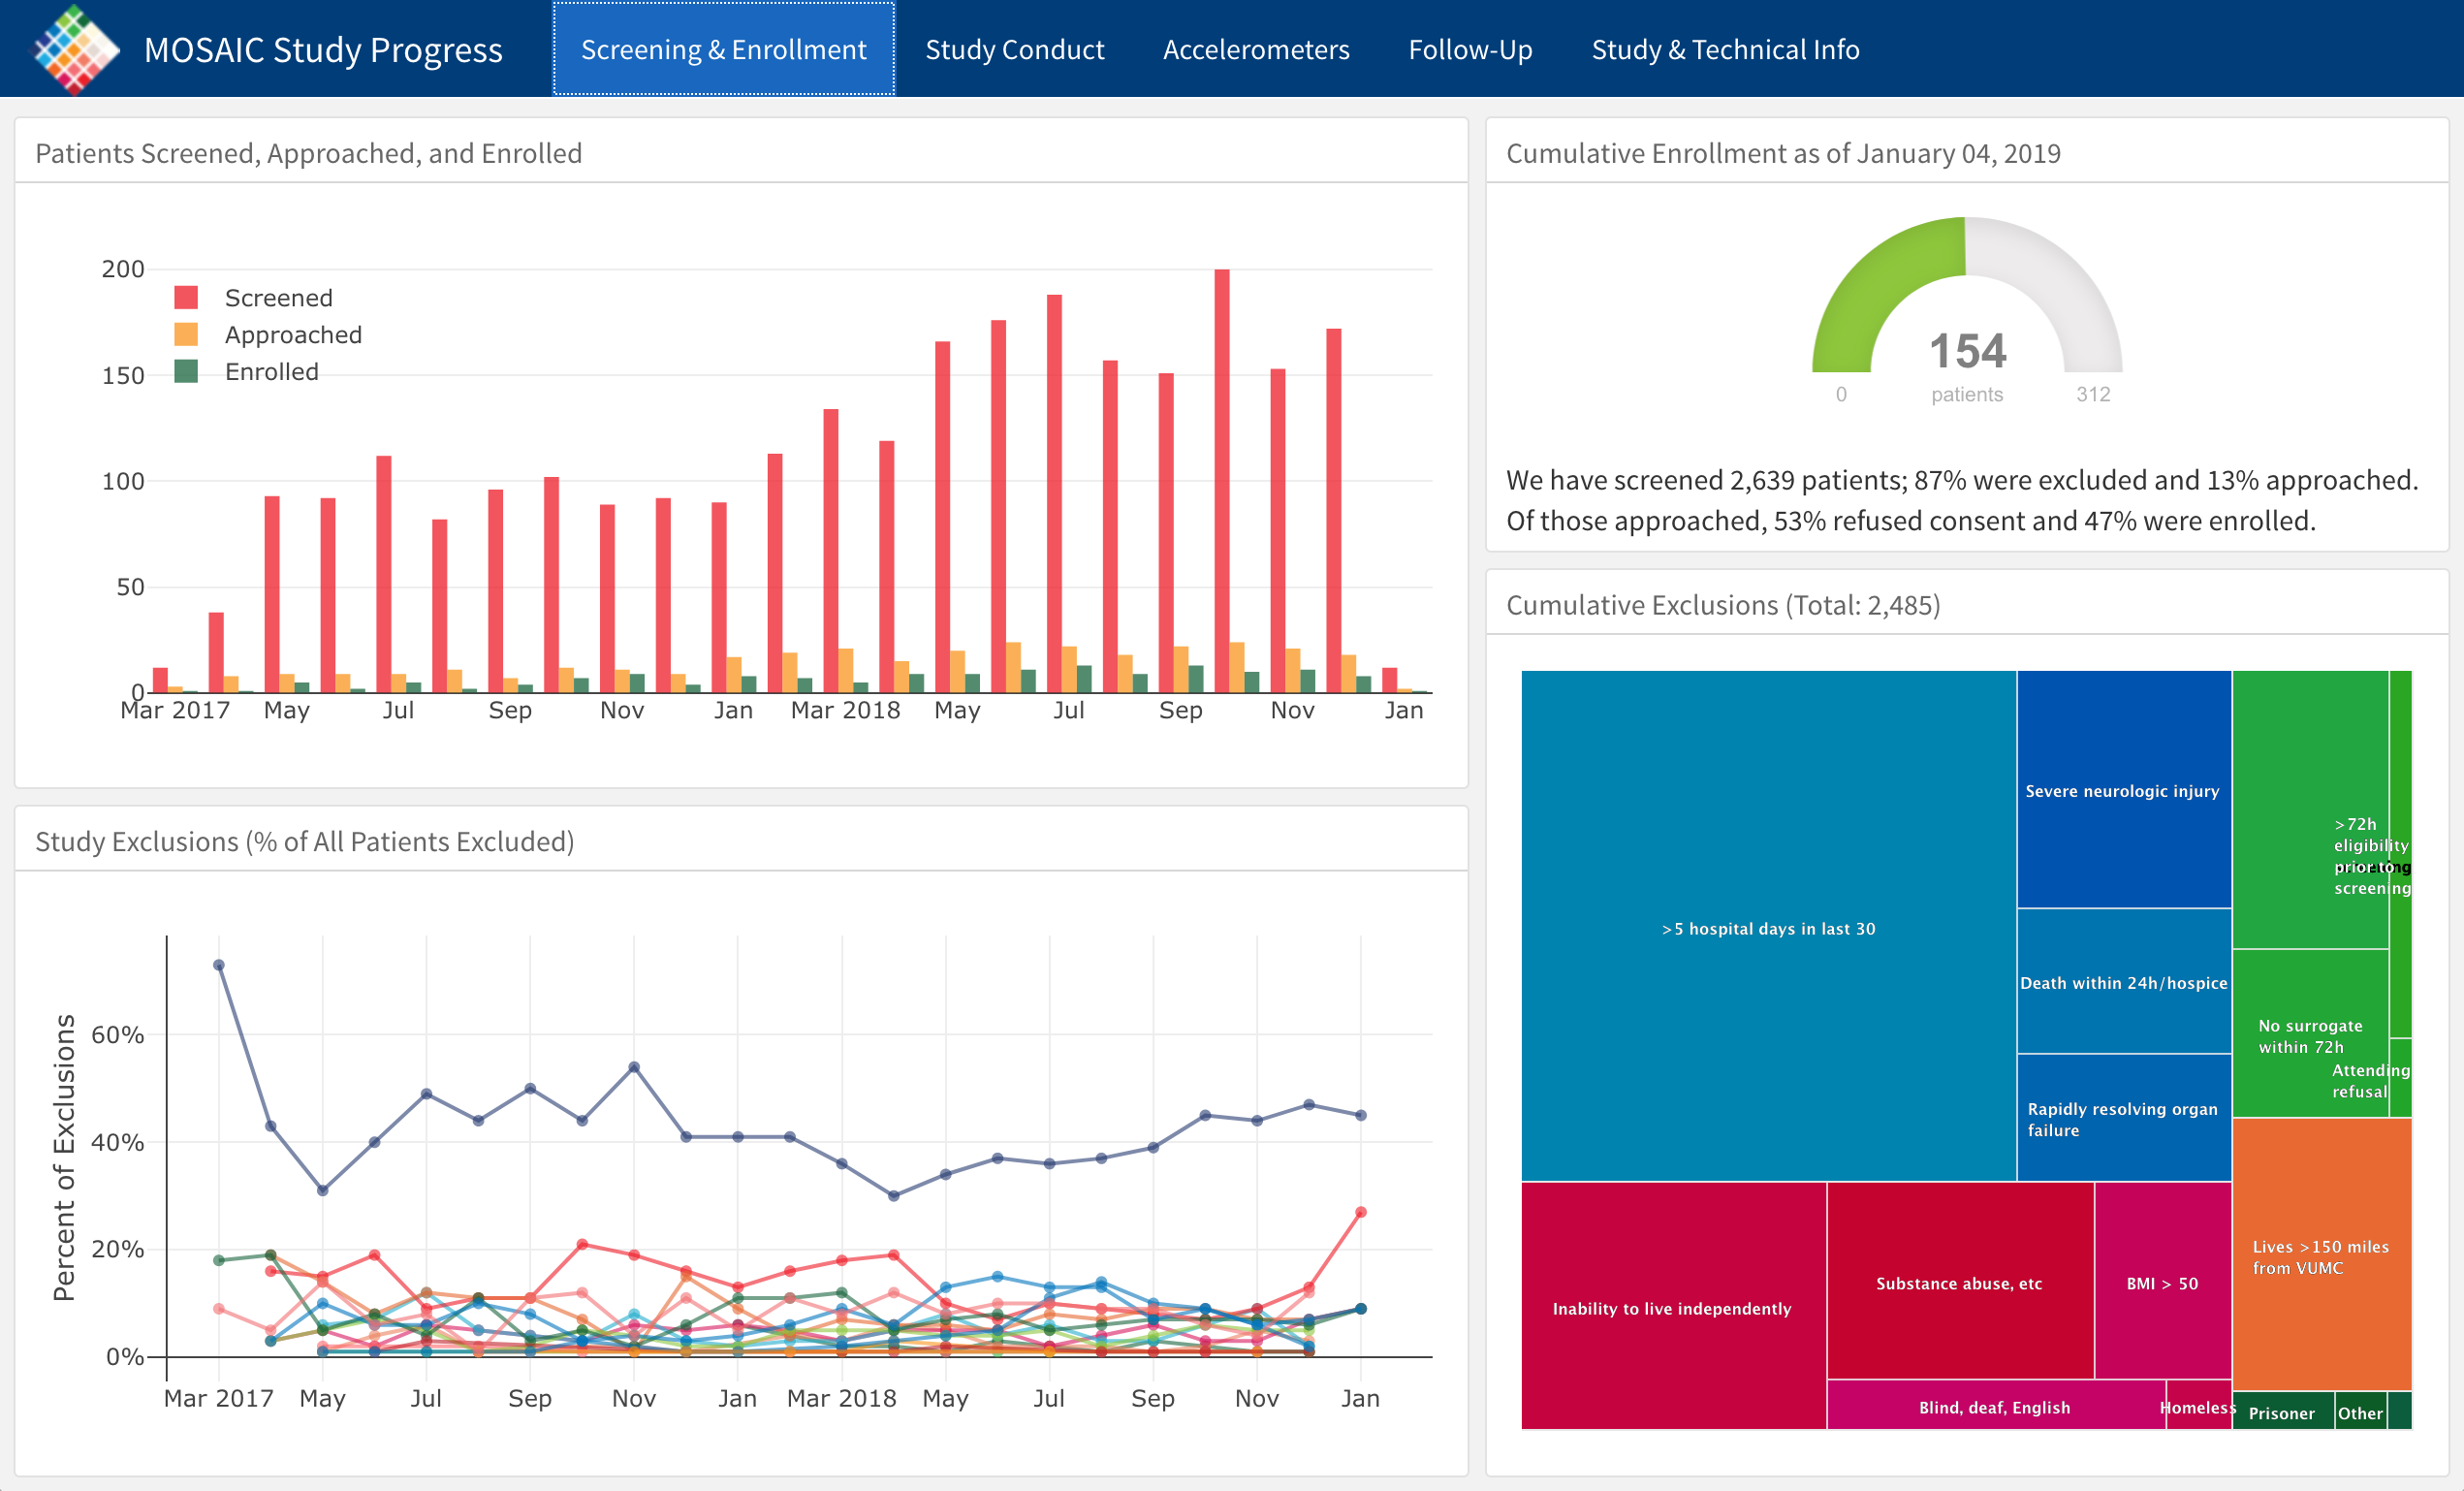{width="75%"} .footnote[Credit: This example from [Alison Hill's rstudio::conf(2019L) class]()] --- # One more... By [Jennifer Thompson](https://jenthompson.me) (see the [blog post](https://jenthompson.me/2018/02/09/flexdashboards-monitoring/), [dashboard](https://jenthompson.me/examples/progressdash.html), and [source code](https://github.com/jenniferthompson/MOSAICProgress)) --- # Step 1: Create a new flexdashboard ``` r #install.packages("flexdashboard") ``` 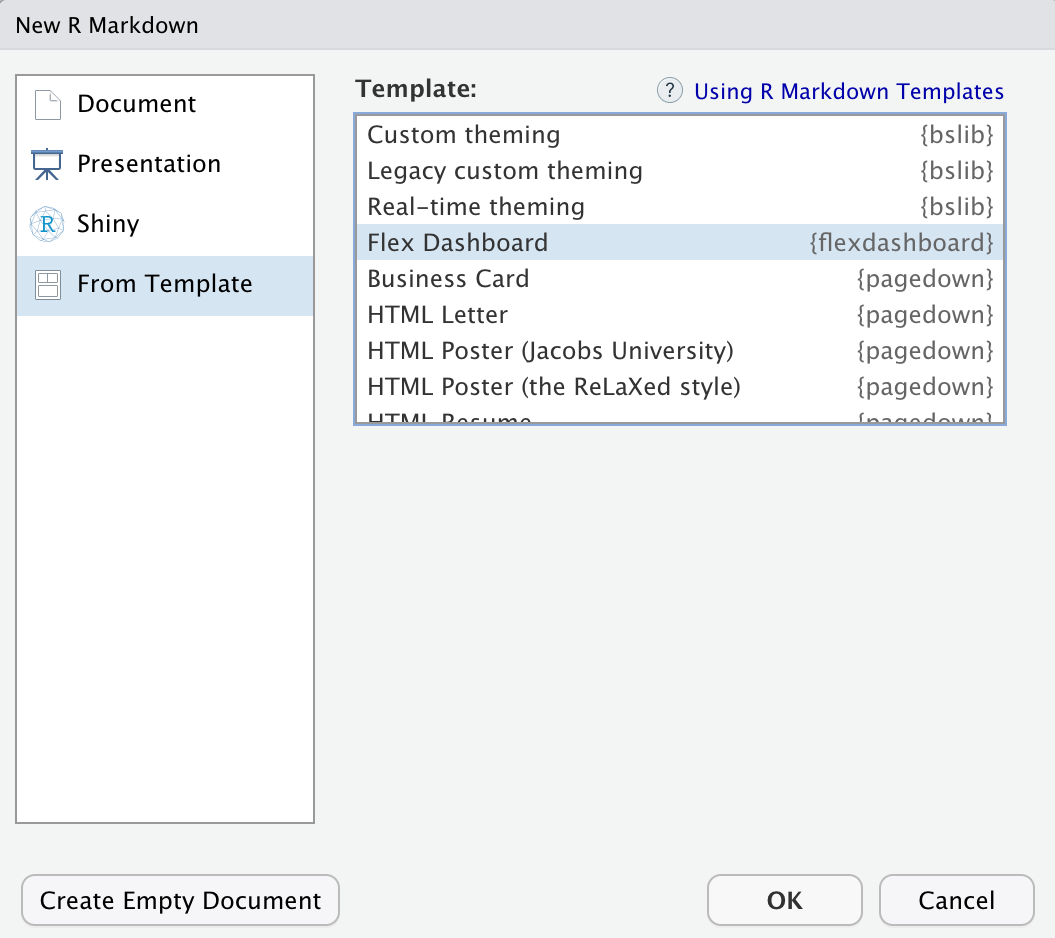{width="50%"} --- # Step 2: Look at the default YAML When you create a new flexdashboard from the template, you get this: ```yaml --- title: "My Dashboard" output: flexdashboard::flex_dashboard: orientation: columns vertical_layout: fill --- ``` -- Two key YAML options to know right away: * **`orientation`**: `columns` (default) or `rows` — controls how content is laid out * **`vertical_layout`**: `fill` (stretch to fit) or `scroll` (allow scrolling) --- # Step 3: Knit right away! Before adding anything, **knit the template** so you know what the default looks like. -- You should see a page with placeholder content split into two columns. -- Now let's understand *why* it looks the way it does... --- # Understanding the layout model flexdashboard uses **markdown headers** to define structure: | Header Level | What it creates | |---|---| | `# Page Title` | A new **page** (tab in the nav bar) | | `Column` or `Row` (with dashes) | A new **column** or **row** | | `### Box Title` | A new **card/box** within the column/row | -- Think of it as nesting: **Pages > Columns/Rows > Boxes** --- # Columns * Define new column with ``` Column ---------------------------------- ``` * Optionally specify the width with `{data-width}` -- * Annoyingly, be careful with spacing! `{data-width=650}` will work ### but `{data-width = 650}` will not work --- # Step 4: A two-column layout Here's the pattern you'll use most often: ```md Column {data-width=650} ---------------------------- ### Chart A < r code chunk > Column {data-width=350} ---------------------------- ### Chart B < r code chunk > ### Chart C < r code chunk > ``` -- * The left column gets 65% of the width, with one chart * The right column gets 35%, split evenly between two charts --- # New boxes ``` md ### Box title < r code chunk > ``` * Each time you add a box it will split the area evenly among all the boxes in that column --- # Thinking in rows * Change the YAML to ```md output: flexdashboard::flex_dashboard: orientation: rows ``` -- * Now `###` will create a new column *within* a row -- * Add new rows with ```md Row ---------------------------------- ``` -- * Modify height with `{data-height=XXX}` --- # Step 5: Add a second page You can easily specify multiple pages by just specifying a Level 1 Header ```md # Page 1 Column {data-width=650} ---------------------------- ### Chart A < r code> Column {data-width=350} ---------------------------- ### Chart B < r code> ### Chart C < r code> # Page 2 ``` --- # Step 6: Make it interactive with tabsets This is actually a standard R Markdown feature, but you can use it with flexdashboards as well ```md Column {.tabset} ---------------------------------------------------------------------- ### Chart 1 < r code> ### Chart 2 < r code> ### Data Table < r code> ``` -- No comma between multiple column arguments --- .pull-left[ ### Good ``` Column {.tabset data-width=650} ``` ] .pull-right[ ### bad ``` Column {.tabset, data-width=650} ``` ] --- # Step 7: Add a sidebar Julia Silge's dashboard had a nice sidebar where she explained things... You can have this too! ```md Sidebar Title {.sidebar} -------- Your text here. You can use markdown syntax, including [links](http://blah.com), *italics*, **bolding**, etc. ``` -- * Multiple pages? Change the separator to keep the sidebar global: ```md Sidebar {.sidebar} ============ Your text here. You can use markdown syntax, including [links](http://blah.com), *italics*, **bolding**, etc. ``` --- # A brief aside on interactivity * Things like `reactable::reactable` and `plotly::ggplotly` can help give your dashboard some nice interactvity. --- # Steps to interactivity ### With multipage layouts Add `runtime: shiny` to your YAML ``` --- title: "My amazing dashboard" runtime: shiny output: flexdashboard::flex_dashboard: orientation: columns vertical_layout: fill --- ``` -- Save your interactive piece into an object, and call the corresponding `render*` fucntion. .pull-left[ ``` r p <- ggplot(...) renderPlotly(p) ``` ] .pull-right[ ``` r tbl <- reactable(...) renderReactable(tbl) ``` ] --- # Icons * Probably not the most important thing, but fun * Use Font awesome! ```md # Years {data-icon="fa-calendar"} ``` --- # HTML Widgets Add a touch of interactivity * Plenty of HTML widgets for R out there (see https://www.htmlwidgets.org/showcase_leaflet.html) * {plotly} is cool ``` r #install.packages("plotly") library(plotly) p <- ggplot(mpg, aes(displ, cty)) + geom_point() + geom_smooth() *ggplotly(p) ``` --- # Including Text * If you want to include text about an overall figure, just put the text in the R Markdown doc like you normally would ```md # Base {data-icon="fa-calendar"} Here's a description about the plot that follows ### A base R plot < r code> ``` --- # What if you have tabsets? * Works great if you want to describe all the plots/tables/content in the tabset * If you want to provide text for an individual plot, use `>` ```md Column {.tabset data-width=350} ------------------- This text will describe the full tabset ### Chart 1 < r code> > Here's some text for Chart 1 ### Table 1 < r code> > Here's some text for Table 1 ``` --- # Storyboarding * A little bit advanced, but pretty cool * First, change the YAML ```md output: flexdashboard::flex_dashboard: storyboard: true ``` --- ```md # Method {.storyboard} ### Sample Descriptives {data-commentary-width=400} < r code> **** This is some text describing what's going on with the sample, and how we moved from the raw data to the analytic sample. ### Correlation Matrix {data-commentary-width=200} < r code> **** There is less to say here so I made the commentary box smaller # Results {.storyboard} ### Plot 1 {data-commentary-width=600} < r code> **** Lots to say here. There is important ### Plot 2 {data-commentary-width=200} **** Move along ``` --- # Customization * Add font-awesome stuff * Change the [theme](https://rmarkdown.rstudio.com/flexdashboard/using.html#appearance) ```md flexdashboard::flex_dashboard: theme: readable ``` --- # CSS More on this in later slides Change the navigation bar to bright pink with thin blue border ```css .navbar-inverse { background-color: #FE08A5; border-color: #0822FE; } ``` --- Save the previous code in "custom.css" then specify in the YAML ```md flexdashboard::flex_dashboard: css: custom.css ``` Making sure "custom.css" is in the same directory as your flexdashboard Rmd. --- # Add a logo and favicon ```md output: flexdashboard::flex_dashboard: logo: logo.png favicon: favicon.png ``` --- # Deploying flexdashboard to GitHub Pages Since flexdashboard knits to a **single HTML file** (self-contained by default), deployment is simple: -- **Option 1: Manual (quick and dirty)** 1. Knit your `.Rmd` → produces a `.html` file 2. Rename it to `index.html` 3. Push to a GitHub repo 4. Go to *Settings > Pages* → set source to the branch/folder containing `index.html` --- # Deploying flexdashboard to GitHub Pages **Option 2: `docs/` folder (cleaner)** 1. Add `knit_dir` or just save/move your `.html` into a `docs/` folder 2. Push to GitHub 3. In *Settings > Pages*, set source to **`/docs`** on your main branch --- # Deploying flexdashboard to GitHub Pages **Option 3: GitHub Actions (automated)** * Use a workflow that runs `rmarkdown::render()` and deploys the output * More setup, but re-renders automatically on every push -- No special server needed — it's just an HTML file! --- class: inverse-blue # Data viz in the wild Everett Dodjivi ### America and Rachel on Deck next week --- class: inverse-blue middle # Part 2: Quarto Dashboards ### The modern approach (Quarto ≥ 1.4) --- # Why Quarto Dashboards? flexdashboard is great, and it's not going anywhere. But Quarto Dashboards offer some compelling advantages: -- * **Multi-language**: Works with R, Python, Julia, and Observable -- * **Native value boxes**: No package function needed — just a chunk option -- * **`_brand.yml` theming** (new in Quarto 1.6+): Define colors, fonts, and logos in one YAML file and apply across all your Quarto outputs -- * **Light/dark mode toggle** (Quarto 1.7+): Built-in, automatic -- * **Accessibility checks** (Quarto 1.8): Axe-core engine built in -- * **No special package to install** — it's a native Quarto format --- # The simplest Quarto dashboard Create a `.qmd` file with this YAML: ```yaml --- title: "My Dashboard" format: dashboard --- ``` That's it. Every code chunk becomes a **card**. -- Compare to flexdashboard, where you need: ```yaml output: flexdashboard::flex_dashboard: orientation: columns vertical_layout: fill ``` --- # Layout: Same mental model, cleaner syntax The mapping from flexdashboard → Quarto: | flexdashboard | Quarto Dashboard | |---|---| | `# Page Title` | `# Page Title` | | `Column {data-width=650}` | `## Column {width=650}` | | `### Chart Title` | Code chunk with `#| title: "Chart Title"` | | `{data-height=400}` | `{height=400}` | -- Key difference: Quarto uses `##` for rows/columns (not the dashed line convention) --- # A Quarto dashboard layout ```md --- title: "My Dashboard" format: dashboard --- ## Row {height=70%} ```{r} #| title: "Main Chart" ggplot(mtcars, aes(wt, mpg)) + geom_point() ``` ## Row {height=30%} ```{r} #| title: "Table" knitr::kable(head(mtcars)) ``` ```{r} #| title: "Summary" summary(mtcars$mpg) ``` ``` --- # Value Boxes One of the best features of Quarto Dashboards — **native value boxes** In flexdashboard, you'd write: ```r flexdashboard::valueBox(42, caption = "Articles", icon = "fa-file") ``` -- In Quarto, you use chunk options: ```md ```{r} #| content: valuebox #| title: "Total Articles" #| icon: file-text #| color: primary list(value = 42) ``` ``` -- Or even **pure markdown** (no code at all!): ```md ::: {.valuebox icon="file-text" color="primary"} Total Articles 42 ::: ``` --- # Value box colors Quarto value boxes support semantic colors that adapt to your theme: | Color | Meaning | |---|---| | `primary` | Main brand color | | `secondary` | Subdued | | `success` | Green — something good | | `info` | Blue — informational | | `warning` | Yellow/orange — caution | | `danger` | Red — alert | | `light` / `dark` | Light or dark backgrounds | -- You can also use any hex color: `color: "#6C4675"` --- # Value boxes: a full example row ```md ## Row {height="25%"} ```{r} #| label: calculate-values n_schools <- nrow(school_data) avg_score <- round(mean(school_data$score), 1) pct_proficient <- paste0(round(mean(school_data$proficient) * 100), "%") ``` ```{r} #| content: valuebox #| title: "Schools in Sample" #| icon: building #| color: primary list(value = n_schools) ``` ```{r} #| content: valuebox #| title: "Avg. Score" #| icon: bar-chart #| color: info list(value = avg_score) ``` ```{r} #| content: valuebox #| title: "Proficient" #| icon: check-circle #| color: success list(value = pct_proficient) ``` ``` --- # Pages, Sidebars, and Tabsets ### Multiple pages ```md # Overview ## Row ... # Details ## Row ... ``` -- ### Sidebar (page-level) ```md # Page 1 ## {.sidebar} Filter controls or explanatory text here. ## Column ... ``` -- ### Tabsets ```md ## Row {.tabset} ```{r} #| title: "Plot" ``` ```{r} #| title: "Table" ``` ``` --- # Theming with`_brand.yml` New in **Quarto 1.6** and enhanced in **1.7–1.8**, `_brand.yml` lets you define your visual identity in one place. --- # Theming with`_brand.yml` Create a `_brand.yml` file in your project root: ```yaml color: palette: uoregon-green: "#154733" uoregon-yellow: "#FEE123" foreground: "#333333" background: "#FFFFFF" primary: "#154733" typography: base: family: "Source Sans Pro" headings: family: "Source Serif Pro" weight: 600 logo: medium: logo.png ``` -- Quarto automatically picks this up — no extra YAML needed in your `.qmd`! --- # Light/Dark mode (Quarto 1.7+) Provide a light and dark theme and Quarto adds a **toggle automatically**: ```yaml --- title: "My Dashboard" format: dashboard: theme: light: flatly dark: darkly --- ``` -- Or with `_brand.yml` (Quarto 1.8+): ```yaml # _brand.yml color: foreground: light: "#333333" dark: "#EEEEEE" background: light: "#FFFFFF" dark: "#1a1a2e" logo: medium: light: logo.png dark: logo-white.png ``` --- # Accessibility checks (Quarto 1.8) Add the `axe` option to your dashboard to run automated accessibility checks: ```yaml --- title: "My Dashboard" format: dashboard: axe: true --- ``` -- When you render, Quarto will show warnings directly in the preview if there are accessibility violations (missing alt text, color contrast issues, etc.) -- This is especially useful for **education policy dashboards** that need to be accessible to broad audiences. --- # Quick theming with Bootstrap Just like flexdashboard, Quarto dashboards support Bootswatch themes: ```yaml format: dashboard: theme: cosmo ``` Available themes: `cosmo`, `flatly`, `journal`, `lumen`, `minty`, `pulse`, `sandstone`, `simplex`, `united`, `yeti`, and more. -- You can layer a custom SCSS file on top: ```yaml format: dashboard: theme: [flatly, custom.scss] ``` --- # Navigation bar options ```yaml --- title: "Education Dashboard" author: "Maithreyi Gopalan" format: dashboard: logo: images/logo.png nav-buttons: - icon: github href: https://github.com/username/repo - icon: linkedin href: https://linkedin.com/in/username --- ``` -- Social links in the nav bar — no extra work needed! --- # Deploying Quarto dashboards Because Quarto dashboards render to **static HTML** by default: * **Same: Just like flexdashboard - rename index.html and push * **GitHub Pages**: `quarto publish gh-pages` * **Netlify**: Drag and drop the `_site/` folder, or connect to your repo * **Posit Connect / Connect Cloud**: `quarto publish connect` -- We will discuss other deployments next week! --- # flexdashboard → Quarto: migration cheatsheet | flexdashboard | Quarto Dashboard | |---|---| | `output: flexdashboard::flex_dashboard:` | `format: dashboard` | | `orientation: rows` | `orientation: rows` (same!) | | `Column {data-width=650}` | `## Column {width=650}` | | `### Chart Title` | `#| title: "Chart Title"` | | `{.tabset}` | `{.tabset}` (same!) | | `runtime: shiny` | `server: shiny` | | `flexdashboard::valueBox()` | `#| content: valuebox` | | `css: custom.css` | `theme: [default, custom.scss]` | | Bootstrap themes | Bootstrap themes + `_brand.yml` | --- # Summary ### flexdashboard * Mature, stable, great for R-only projects * Rich ecosystem of examples and documentation * If you're already comfortable with R Markdown, it's easy ### Quarto Dashboards * The future — actively developed with new features every release * Multi-language support (R, Python, Julia) * Native value boxes, `_brand.yml` branding, light/dark mode, accessibility checks * Better if you're already using Quarto for other things -- **My recommendation**: Learn both layouts (they're very similar!), stick to the one you are comfortable with. --- # Resources * [flexdashboard docs](https://rmarkdown.rstudio.com/flexdashboard/) * [Quarto Dashboards docs](https://quarto.org/docs/dashboards/) * [Mine Çetinkaya-Rundel's Build-a-Dashboard workshop](https://posit-conf-2024.github.io/quarto-dashboards/) * [Quarto 1.8 release notes](https://quarto.org/docs/blog/posts/2025-10-13-1.8-release/) — brand extensions, accessibility * [Quarto 1.7 release notes](https://quarto.org/docs/blog/posts/2025-04-28-1.7-release/) — light/dark mode * [`_brand.yml` documentation](https://quarto.org/docs/authoring/brand.html) --- class: inverse-green middle # Next time ## Websites w/Distill and Quarto ## Deployment to GitHub Pages ## More CSS customization